| Param | Original file | Final file |
|---|---|---|
| Filename | modeM0/AS1A05_208T01_9000002614_17676cztM0_level2.evt | modeM0/AS1A05_208T01_9000002614_17676cztM0_level2_quad_clean.evt |
| Size (bytes) | 479,355,840 | 94,864,320 |
| Size | 457.1 MB | 90.5 MB |
| Events in quadrant A | 3,467,633 | 603,327 |
| Events in quadrant B | 3,445,313 | 614,461 |
| Events in quadrant C | 3,693,591 | 591,044 |
| Events in quadrant D | 3,439,161 | 580,399 |
| Mode M9 | |||
|---|---|---|---|
| Quadrant | BADHDUFLAG | Total packets | Discarded packets |
| A | 0 | 9 | 0 |
| B | 0 | 10 | 0 |
| C | 0 | 10 | 0 |
| D | 0 | 10 | 0 |
| Mode M0 | |||
|---|---|---|---|
| Quadrant | BADHDUFLAG | Total packets | Discarded packets |
| A | 0 | 14564 | 2 |
| B | 0 | 14576 | 2 |
| C | 0 | 15141 | 2 |
| D | 0 | 14907 | 2 |
| Mode SS | |||
|---|---|---|---|
| Quadrant | BADHDUFLAG | Total packets | Discarded packets |
| A | 0 | 142 | 0 |
| B | 0 | 142 | 0 |
| C | 0 | 142 | 0 |
| D | 0 | 142 | 0 |
| Quadrant | Total seconds | Saturated seconds | Saturation percentage |
|---|---|---|---|
| A | 6937 | 90 | 1.297391% |
| B | 6937 | 91 | 1.311806% |
| C | 6937 | 144 | 2.075825% |
| D | 6937 | 147 | 2.119072% |
Noise dominated data is calculated using 1-second bins in cleaned event files. If a bin has >2000 counts, and if more than 50% of those come from <1% of pixels, then it is considered to be noise-dominated and hence unusable.
| Quadrant | # 1 sec bins | Bins with >0 counts | Bins with >2000 counts | High rate bins dominated by noise | Noise dominated (total time) | Noise dominated (detector-on time) | Marked lightcurve |
|---|---|---|---|---|---|---|---|
| A | 7612 | 6937 | 0 | 0 | 0.00% | 0.00% | 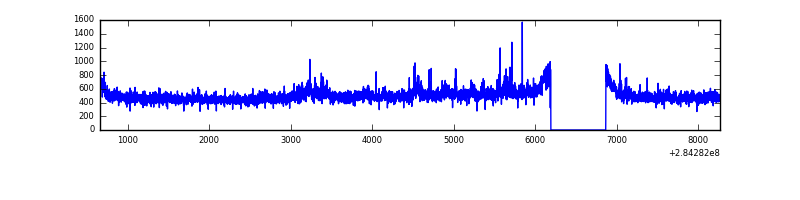 |
| B | 7612 | 6937 | 4 | 4 | 0.05% | 0.06% | 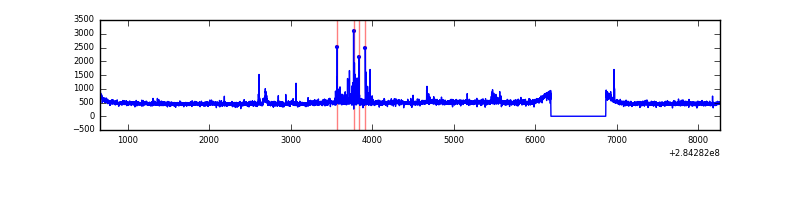 |
| C | 7612 | 6938 | 0 | 0 | 0.00% | 0.00% | 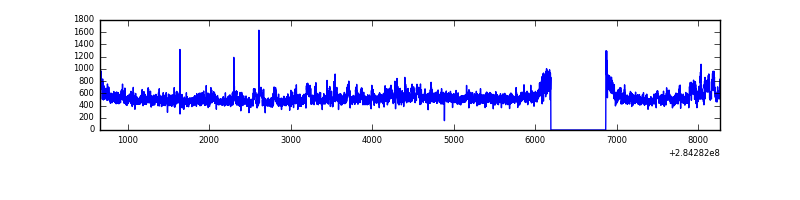 |
| D | 7612 | 6938 | 79 | 79 | 1.04% | 1.14% |  |
Top three noisy pixels from each quadrant. If the there are fewer than three noisy pixels in the level2.evt file, extra rows are filled as -1
| Pixel properties | Quadrant properties | ||||||
|---|---|---|---|---|---|---|---|
| Quadrant | DetID | PixID | Counts | Sigma | Mean | Median | Sigma |
| A | 14 | 237 | 214704 | 1239.56 | 846 | 826 | 172.5 |
| A | 0 | 226 | 7352 | 37.82 | 846 | 826 | 172.5 |
| A | 12 | 194 | 6243 | 31.4 | 846 | 826 | 172.5 |
| B | 7 | 220 | 67212 | 410.14 | 842 | 819 | 161.9 |
| B | 0 | 230 | 23023 | 137.16 | 842 | 819 | 161.9 |
| B | 12 | 111 | 19075 | 112.77 | 842 | 819 | 161.9 |
| C | 3 | 233 | 381860 | 1997.03 | 816 | 822 | 190.8 |
| C | 14 | 238 | 124294 | 647.12 | 816 | 822 | 190.8 |
| C | 13 | 61 | 5755 | 25.85 | 816 | 822 | 190.8 |
| D | 7 | 238 | 194426 | 957.18 | 823 | 800 | 202.3 |
| D | 1 | 52 | 53676 | 261.39 | 823 | 800 | 202.3 |
| D | 10 | 70 | 35377 | 170.93 | 823 | 800 | 202.3 |
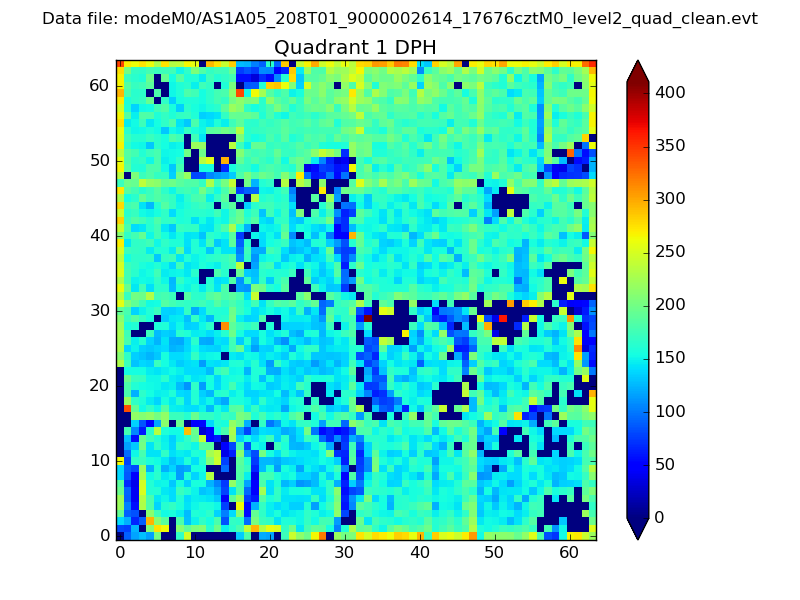
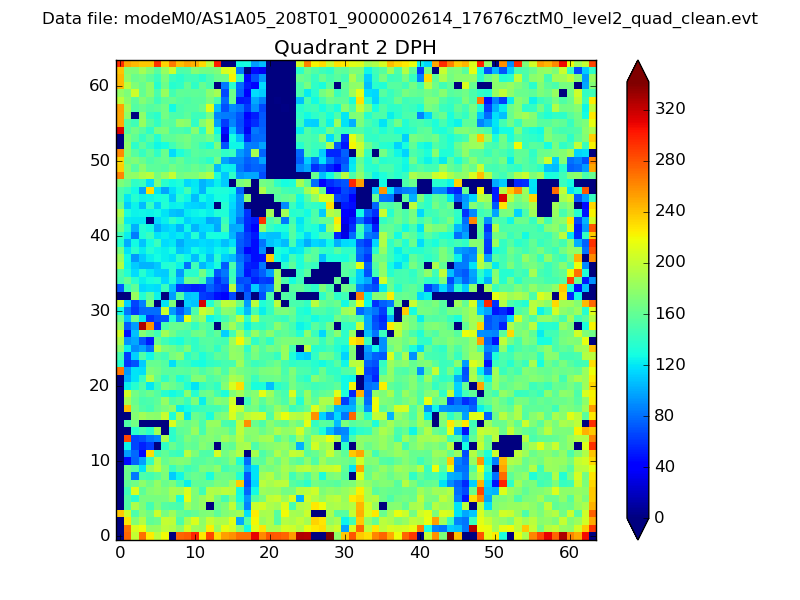
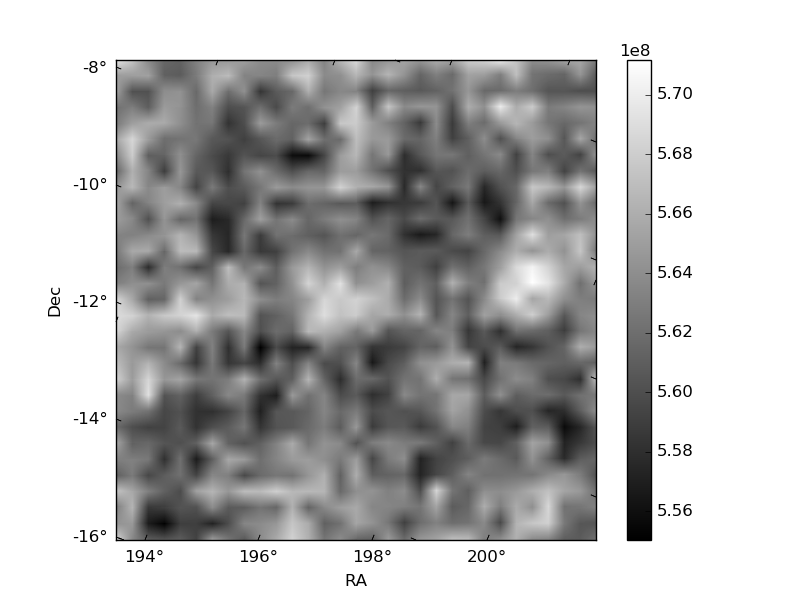
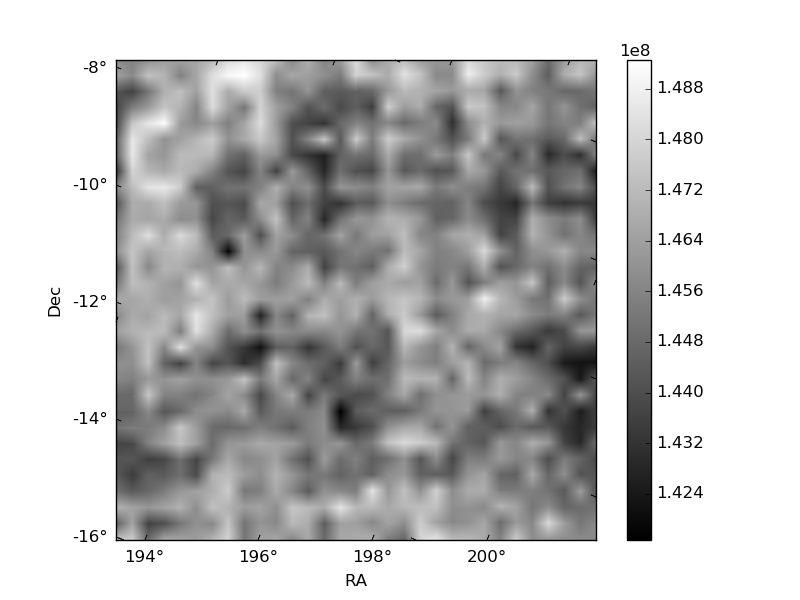
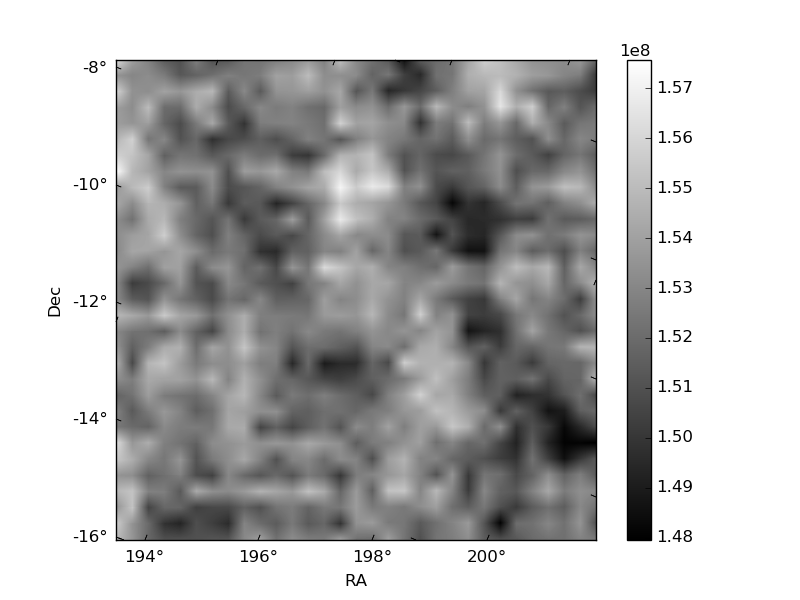
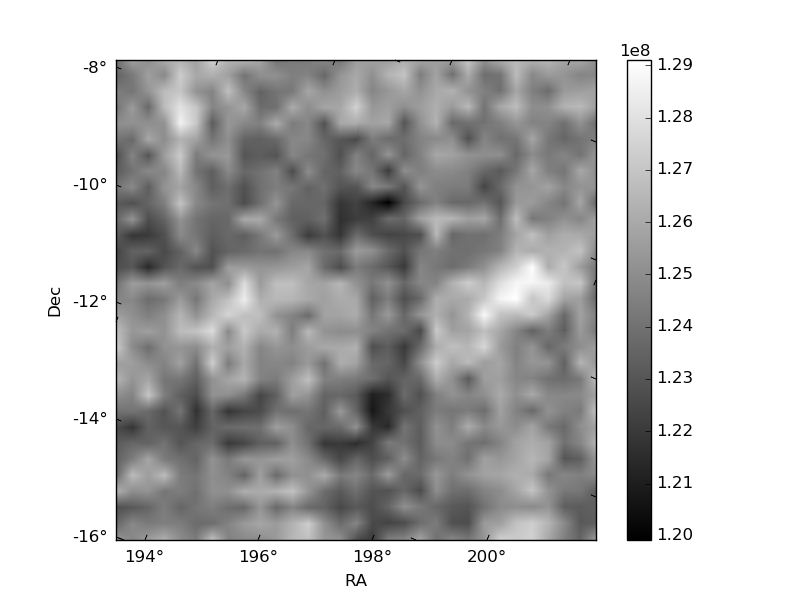
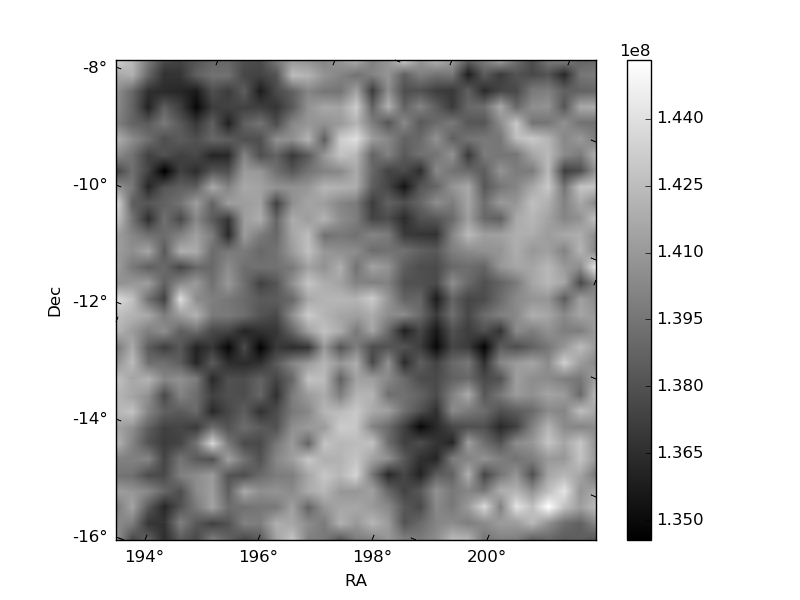
Histogram calculated using DETX and DETY for each event in the final _common_clean file
| Quadrant A | 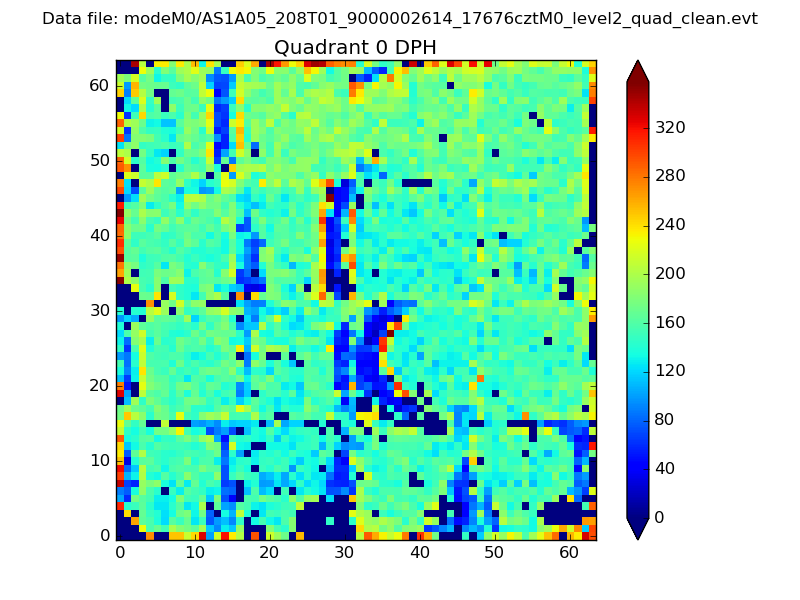 |
 |
Quadrant B |
|---|---|---|---|
| Quadrant D | 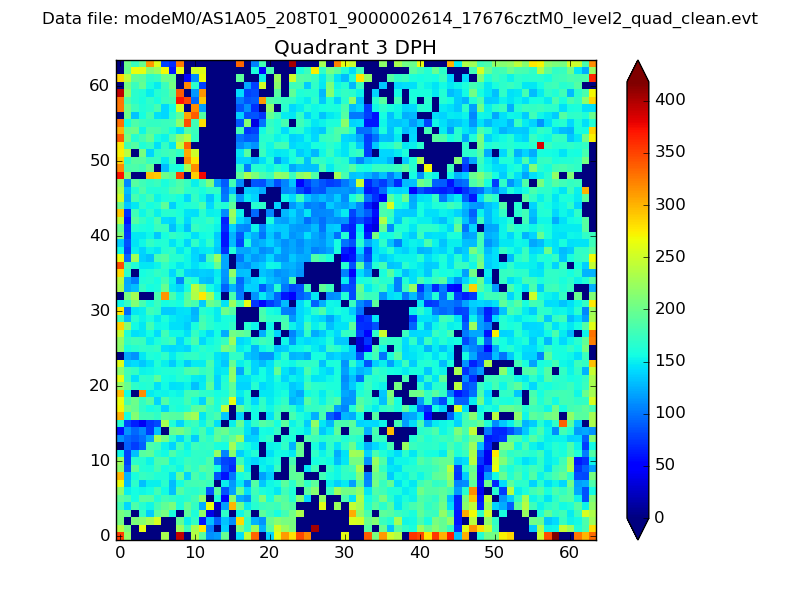 |
 |
Quadrant C |
| Plot type | Count rate plots | Images |
|---|---|---|
| Comparison with Poisson distribution Blue bars denote a histogram of data divided into 1 sec bins. Red curve is a Poisson curve with rate = median count rate of data. |
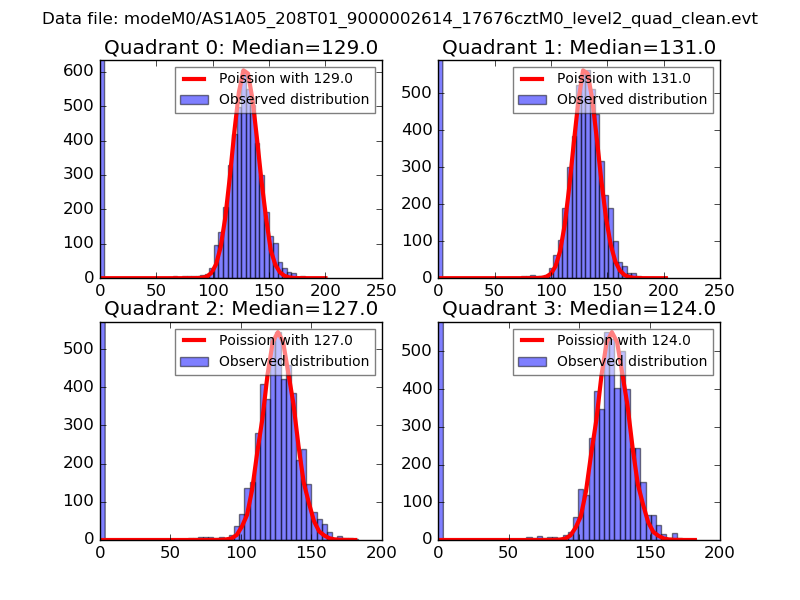 |
 |
| Quadrant-wise count rates Data is divided into 100 sec bins |
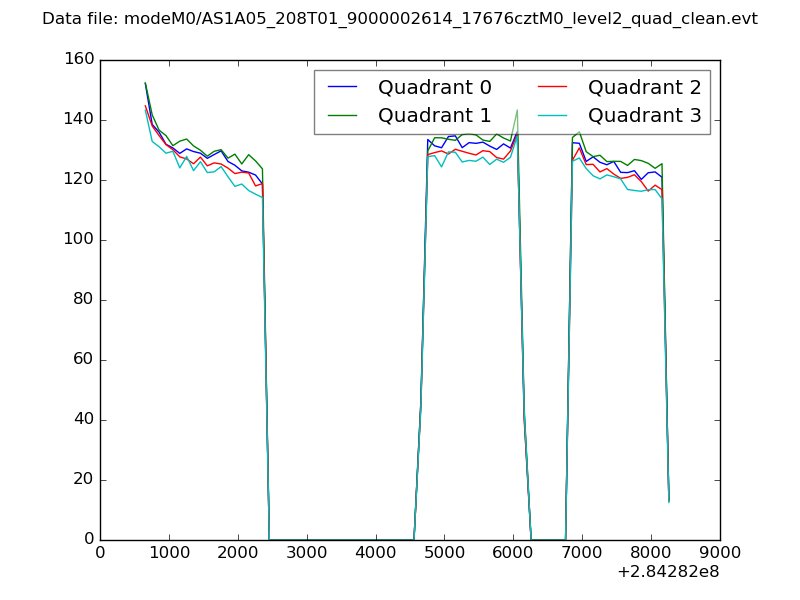 |
|
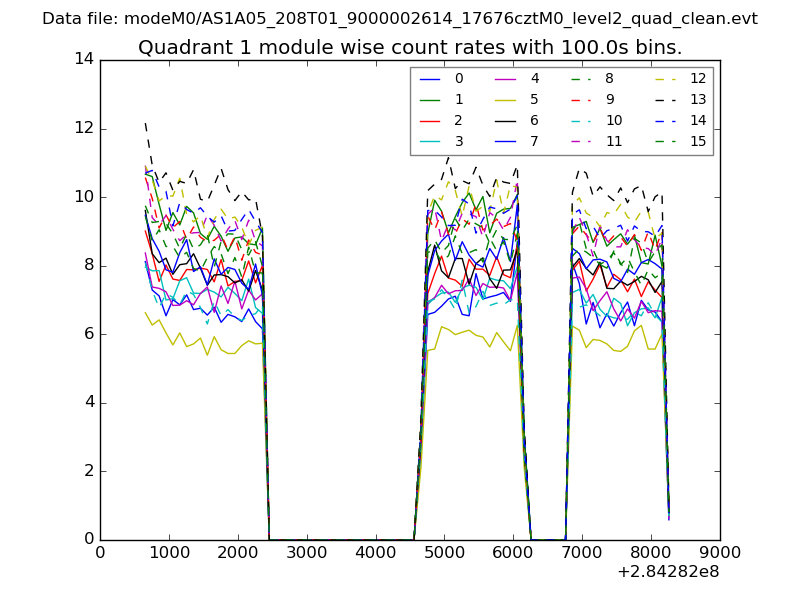
| Module-wise count rates for Quadrant A Data is divided into 100 sec bins |
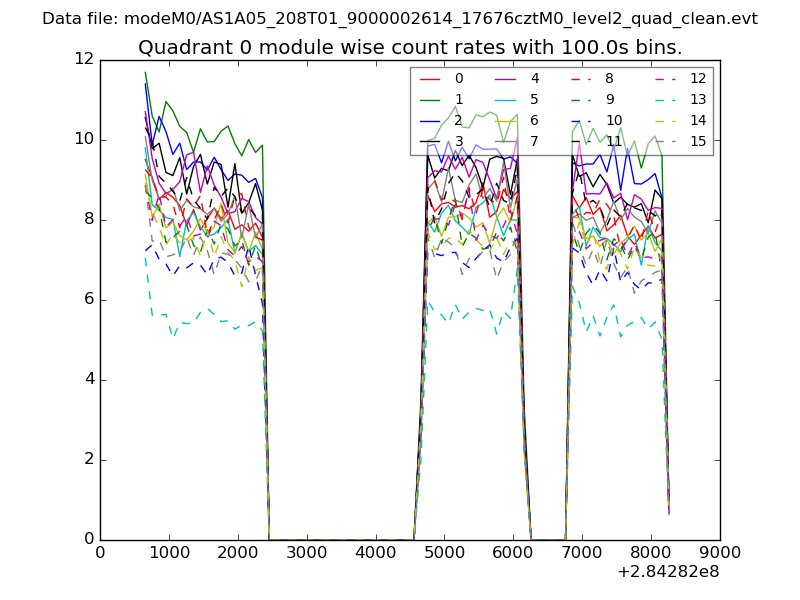 |
 |
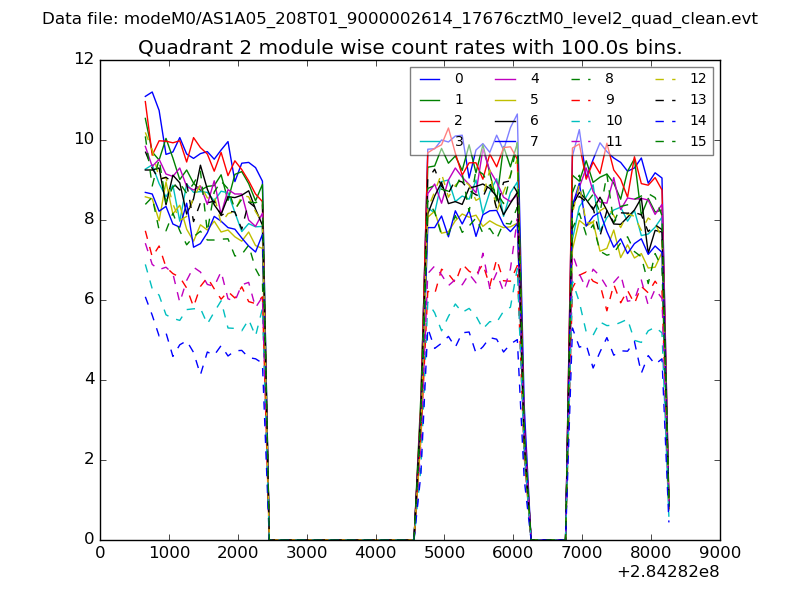
| Module-wise count rates for Quadrant B Data is divided into 100 sec bins |
 |
 |
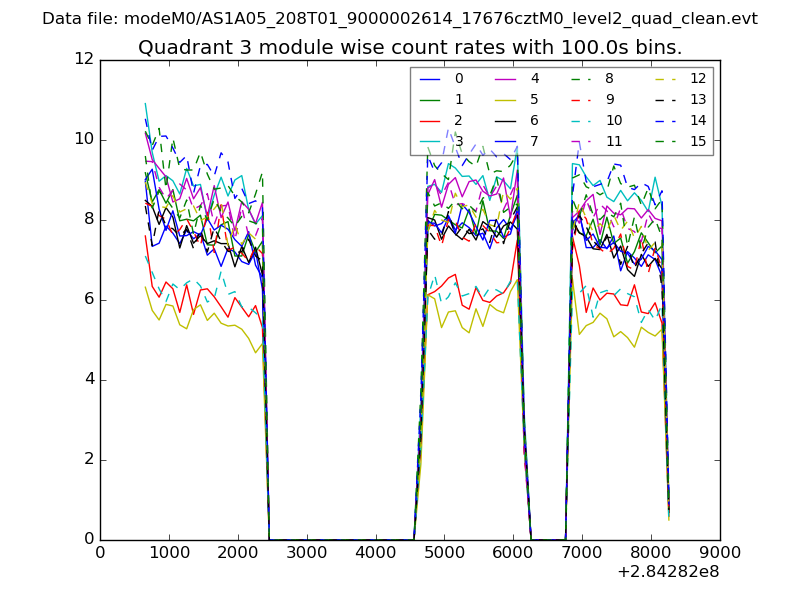
| Module-wise count rates for Quadrant C Data is divided into 100 sec bins |
 |
 |
| Module-wise count rates for Quadrant D Data is divided into 100 sec bins |
 |
 |
| Parameter | Plot |
|---|---|
| CZT HV Monitor | 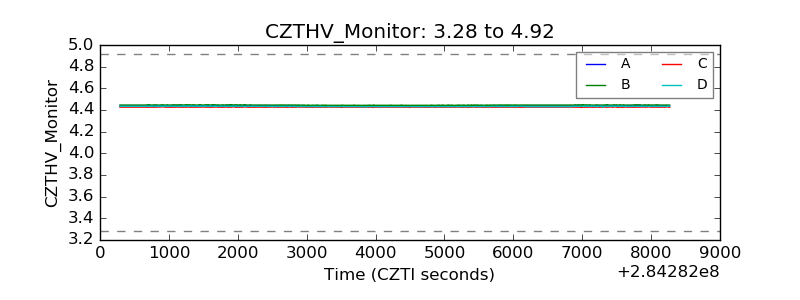 |
| D_VDD |  |
| Temperature 1 | 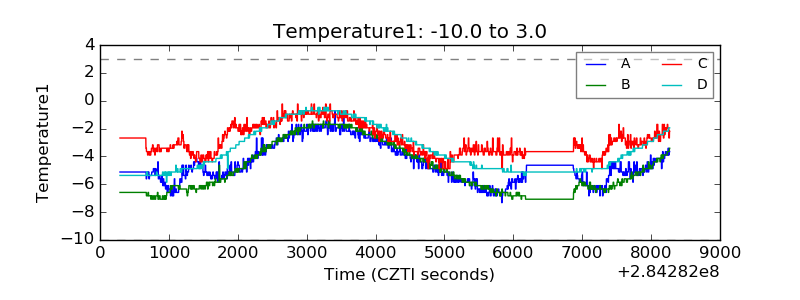 |
| Veto HV Monitor | 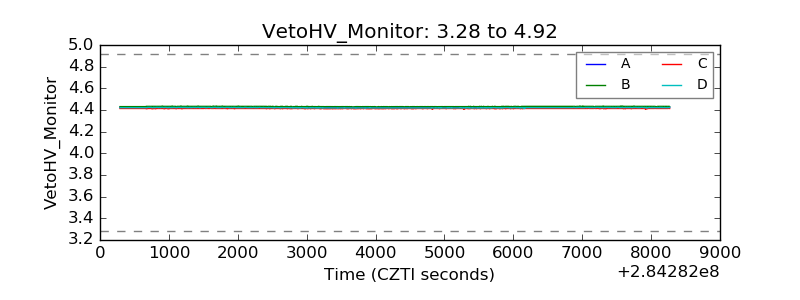 |
| Veto LLD | 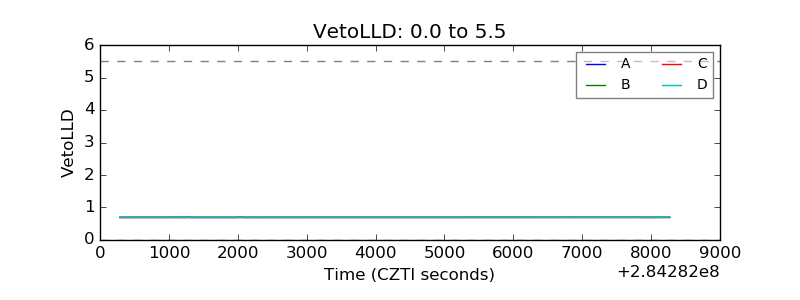 |
| Alpha Counter | 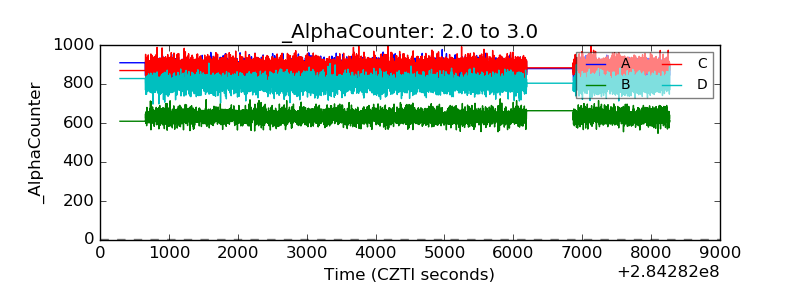 |
| _CPM_Rate | 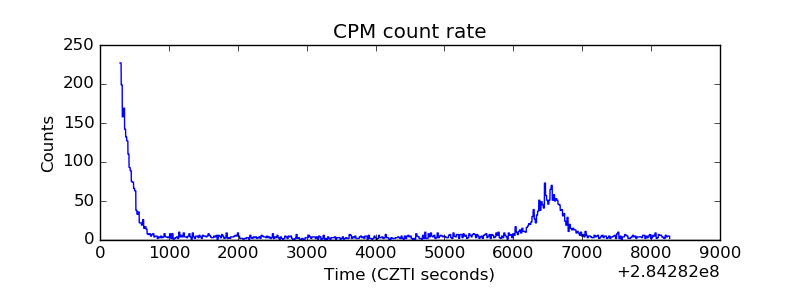 |
| CZT Counter | 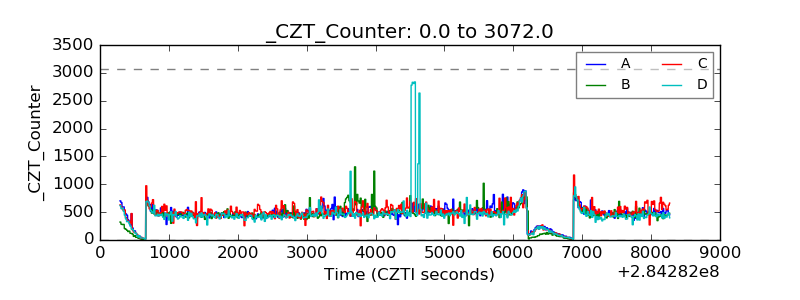 |
| +2.5 Volts monitor |  |
| +5 Volts monitor |  |
| _ROLL_ROT | 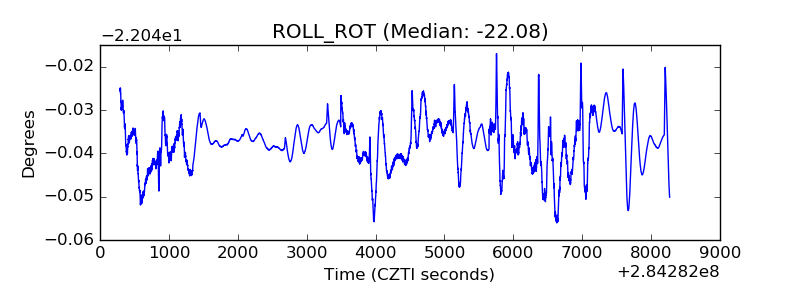 |
| _Roll_DEC | 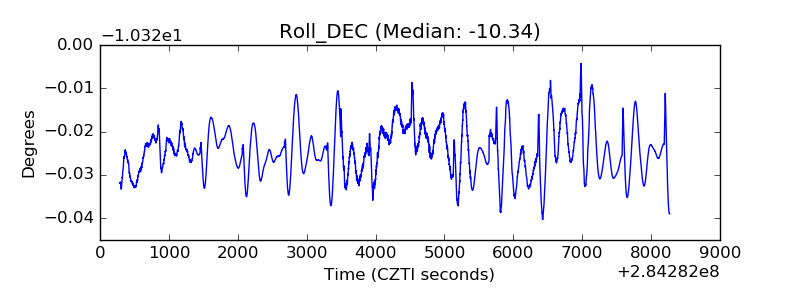 |
| _Roll_RA | 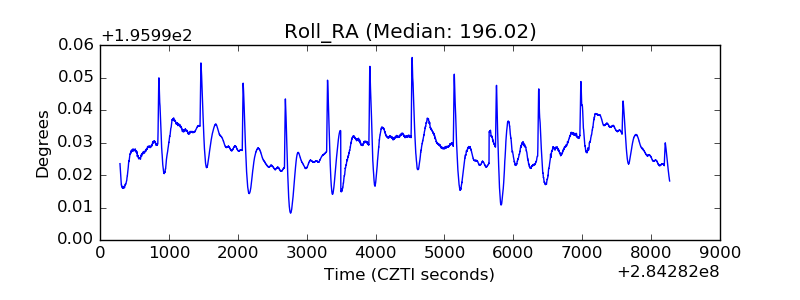 |
| Veto Counter | 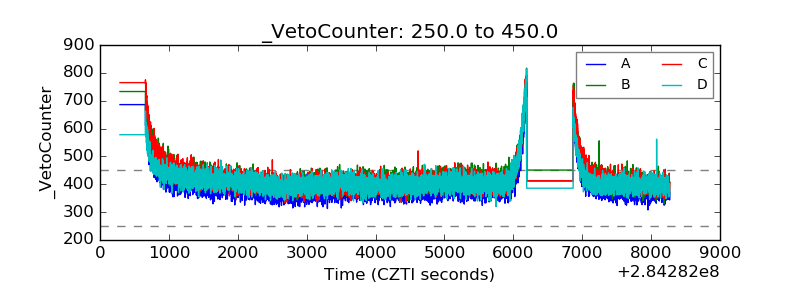 |