| Param | Original file | Final file |
|---|---|---|
| Filename | modeM0/AS1A05_208T01_9000002614_17677cztM0_level2.evt | modeM0/AS1A05_208T01_9000002614_17677cztM0_level2_quad_clean.evt |
| Size (bytes) | 506,856,960 | 94,276,800 |
| Size | 483.4 MB | 89.9 MB |
| Events in quadrant A | 3,496,008 | 591,412 |
| Events in quadrant B | 3,673,319 | 604,792 |
| Events in quadrant C | 4,271,531 | 577,138 |
| Events in quadrant D | 3,414,506 | 574,385 |
| Mode M9 | |||
|---|---|---|---|
| Quadrant | BADHDUFLAG | Total packets | Discarded packets |
| A | 0 | 1 | 0 |
| B | 0 | 1 | 0 |
| C | 0 | 1 | 0 |
| D | 0 | 1 | 0 |
| Mode M0 | |||
|---|---|---|---|
| Quadrant | BADHDUFLAG | Total packets | Discarded packets |
| A | 0 | 15054 | 2 |
| B | 0 | 15425 | 2 |
| C | 0 | 17322 | 2 |
| D | 0 | 15207 | 2 |
| Mode SS | |||
|---|---|---|---|
| Quadrant | BADHDUFLAG | Total packets | Discarded packets |
| A | 0 | 148 | 0 |
| B | 0 | 148 | 0 |
| C | 0 | 148 | 0 |
| D | 0 | 148 | 0 |
| Quadrant | Total seconds | Saturated seconds | Saturation percentage |
|---|---|---|---|
| A | 7280 | 212 | 2.912088% |
| B | 7280 | 228 | 3.131868% |
| C | 7281 | 257 | 3.529735% |
| D | 7281 | 185 | 2.540860% |
Noise dominated data is calculated using 1-second bins in cleaned event files. If a bin has >2000 counts, and if more than 50% of those come from <1% of pixels, then it is considered to be noise-dominated and hence unusable.
| Quadrant | # 1 sec bins | Bins with >0 counts | Bins with >2000 counts | High rate bins dominated by noise | Noise dominated (total time) | Noise dominated (detector-on time) | Marked lightcurve |
|---|---|---|---|---|---|---|---|
| A | 7475 | 7282 | 0 | 0 | 0.00% | 0.00% | 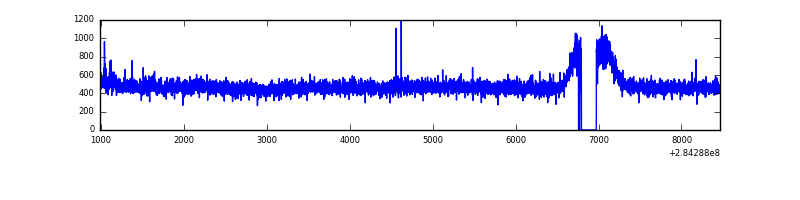 |
| B | 7475 | 7282 | 4 | 4 | 0.05% | 0.05% | 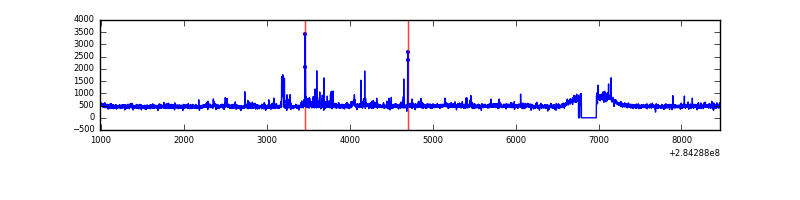 |
| C | 7476 | 7283 | 0 | 0 | 0.00% | 0.00% | 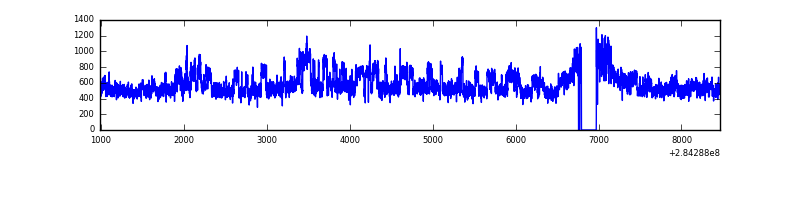 |
| D | 7476 | 7283 | 5 | 5 | 0.07% | 0.07% | 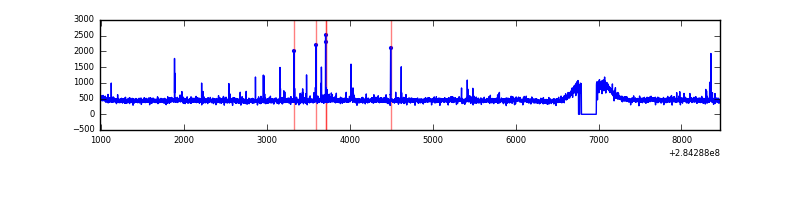 |
Top three noisy pixels from each quadrant. If the there are fewer than three noisy pixels in the level2.evt file, extra rows are filled as -1
| Pixel properties | Quadrant properties | ||||||
|---|---|---|---|---|---|---|---|
| Quadrant | DetID | PixID | Counts | Sigma | Mean | Median | Sigma |
| A | 14 | 237 | 64614 | 348.97 | 892 | 871 | 182.7 |
| A | 0 | 226 | 7665 | 37.19 | 892 | 871 | 182.7 |
| A | 3 | 137 | 6584 | 31.28 | 892 | 871 | 182.7 |
| B | 10 | 245 | 74396 | 425.69 | 888 | 864 | 172.7 |
| B | 7 | 220 | 46832 | 266.12 | 888 | 864 | 172.7 |
| B | 0 | 219 | 23227 | 129.46 | 888 | 864 | 172.7 |
| C | 3 | 233 | 801414 | 3928.6 | 855 | 859 | 203.8 |
| C | 14 | 238 | 129649 | 632.02 | 855 | 859 | 203.8 |
| C | 5 | 218 | 7311 | 31.66 | 855 | 859 | 203.8 |
| D | 2 | 234 | 35960 | 163.37 | 877 | 851 | 214.9 |
| D | 10 | 70 | 27374 | 123.42 | 877 | 851 | 214.9 |
| D | 7 | 38 | 14324 | 62.69 | 877 | 851 | 214.9 |
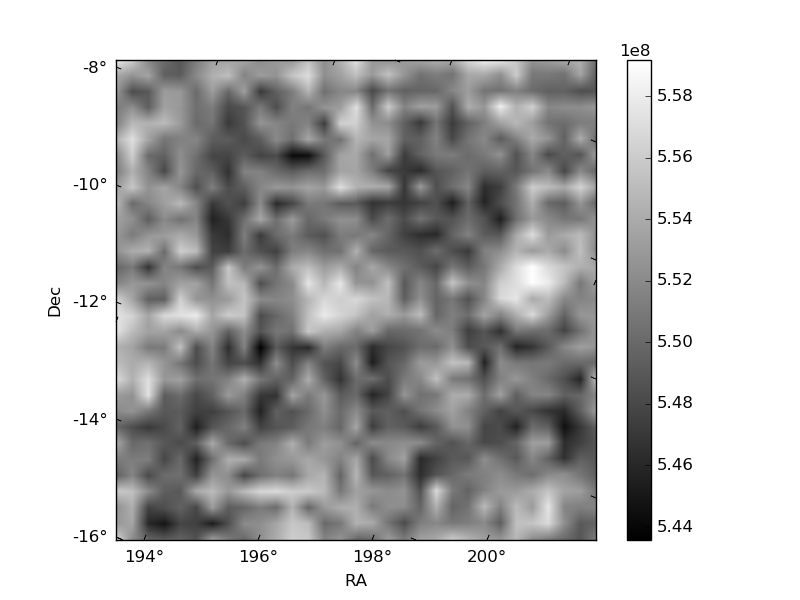
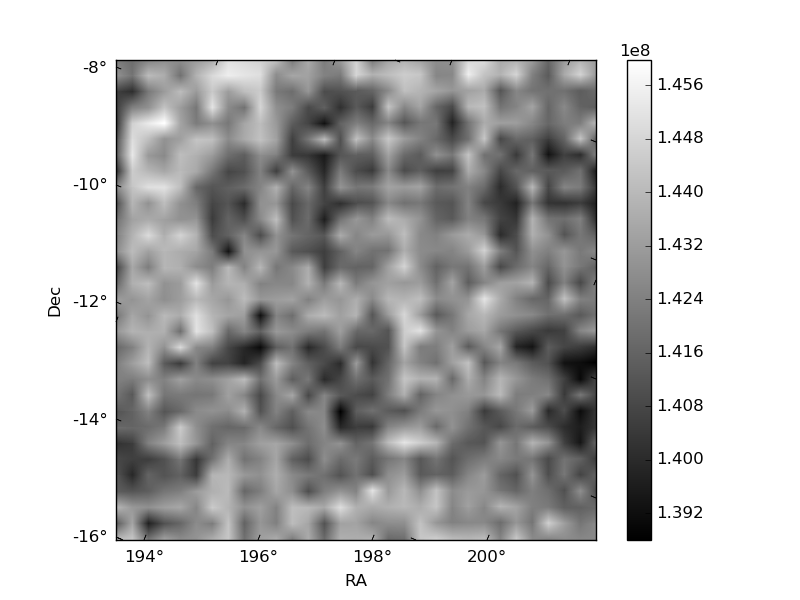
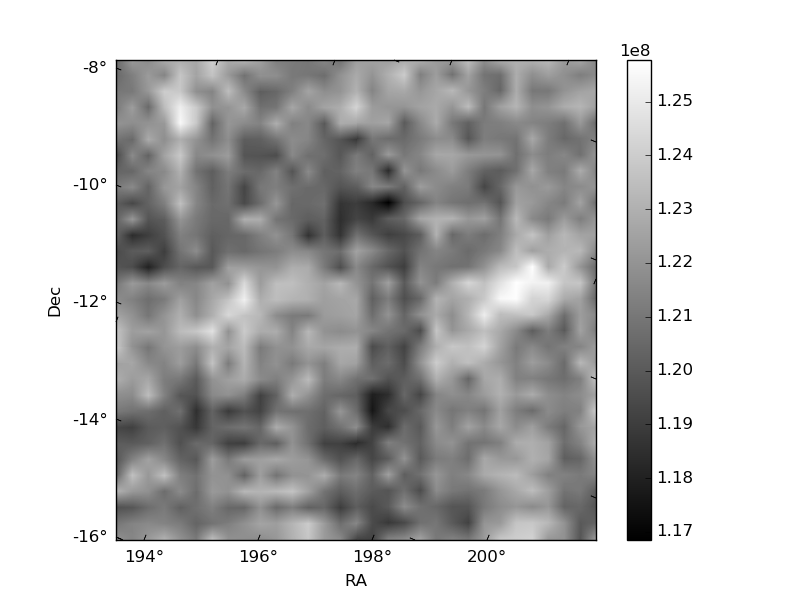
Histogram calculated using DETX and DETY for each event in the final _common_clean file
| Quadrant A | 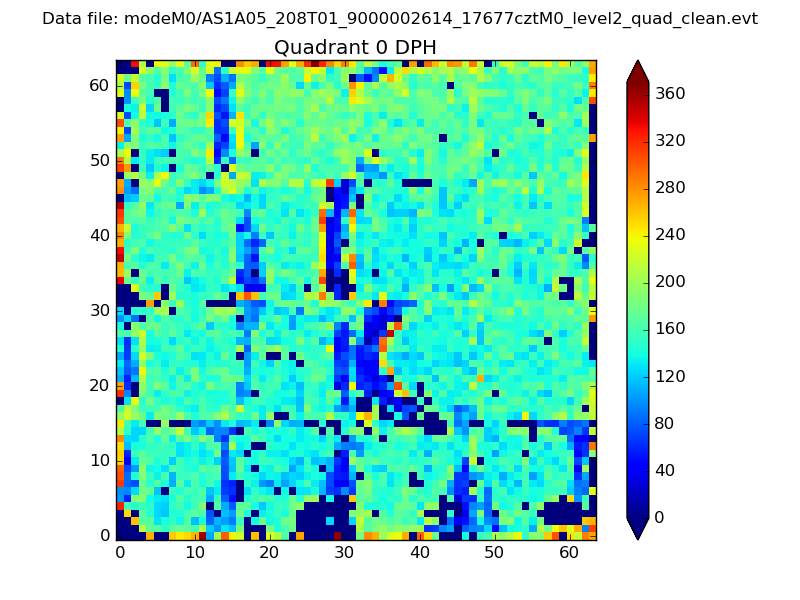 |
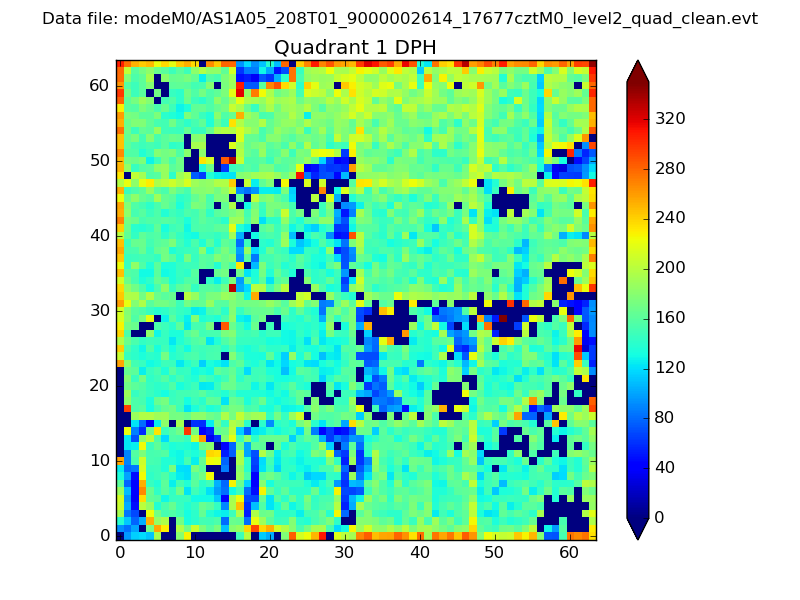 |
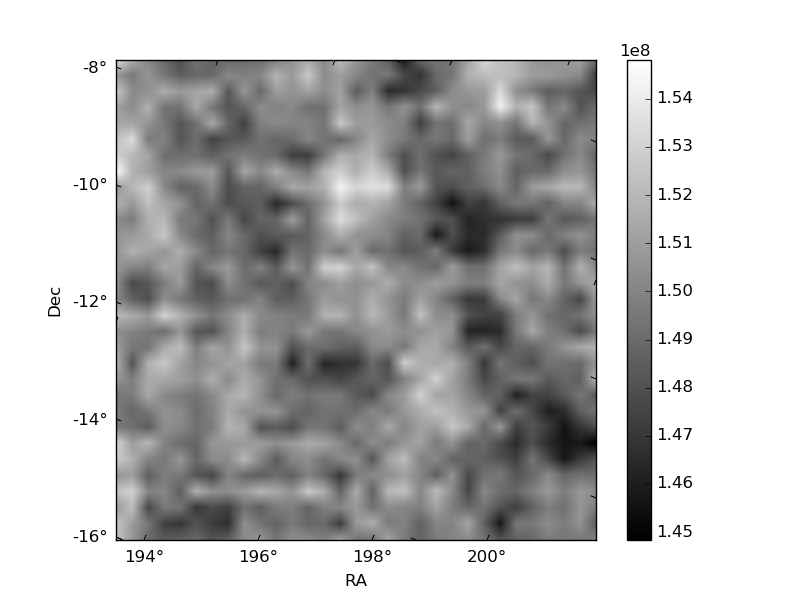
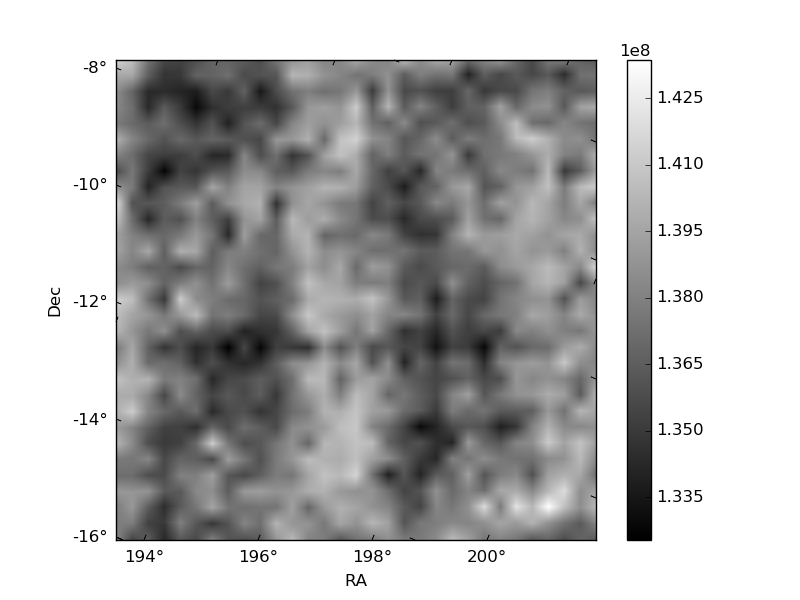
Quadrant B |
|---|---|---|---|
| Quadrant D | 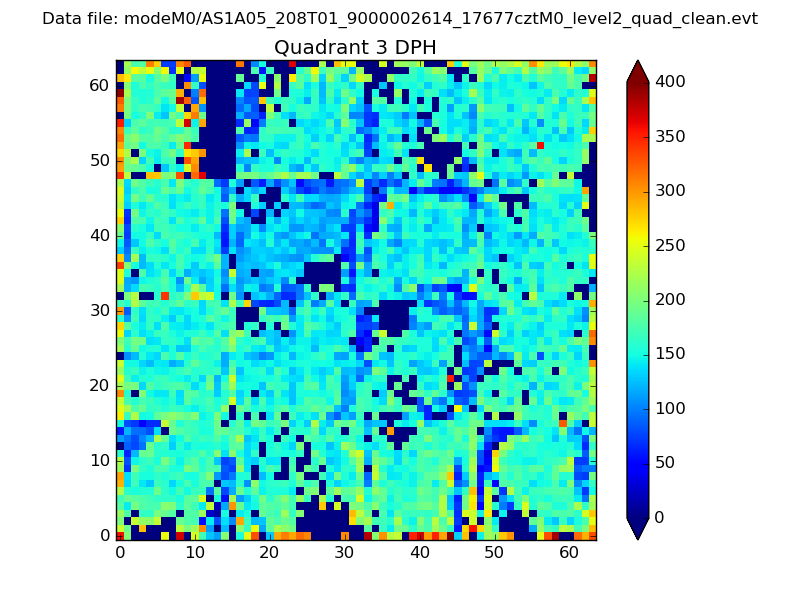 |
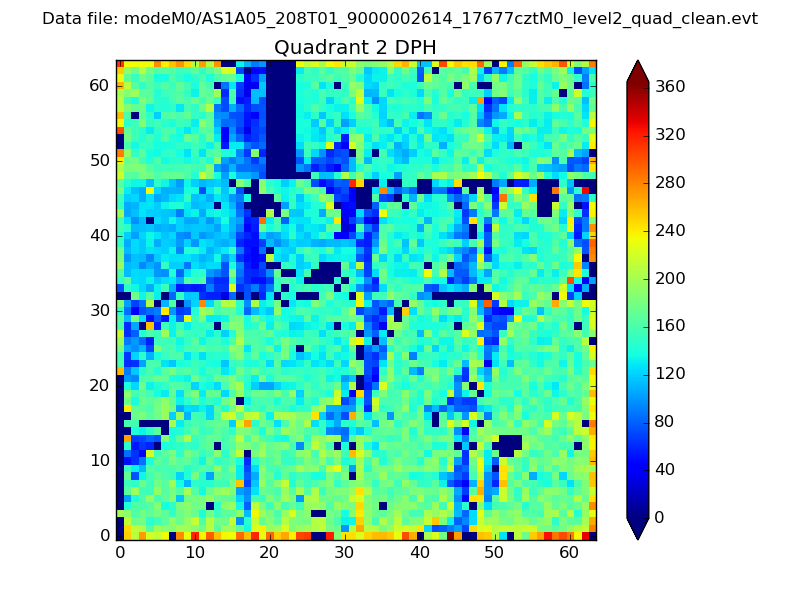 |
Quadrant C |
| Plot type | Count rate plots | Images |
|---|---|---|
| Comparison with Poisson distribution Blue bars denote a histogram of data divided into 1 sec bins. Red curve is a Poisson curve with rate = median count rate of data. |
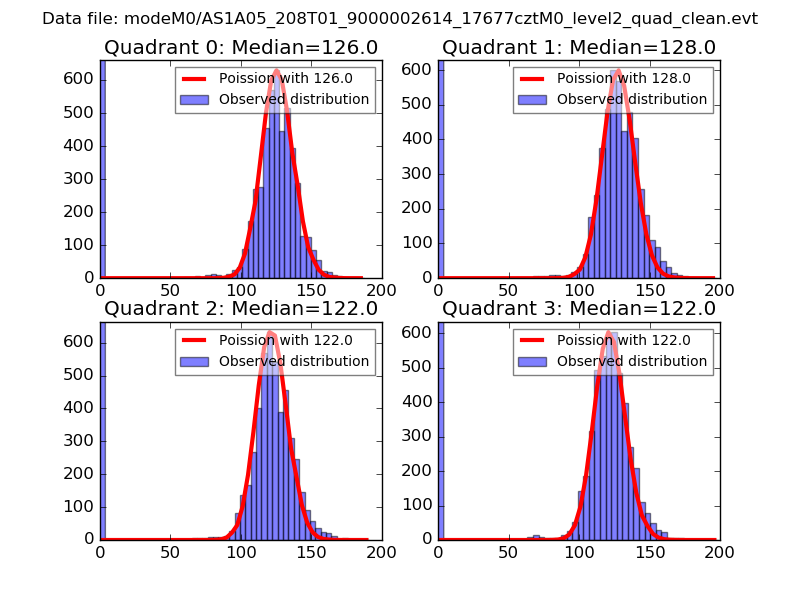 |
 |
| Quadrant-wise count rates Data is divided into 100 sec bins |
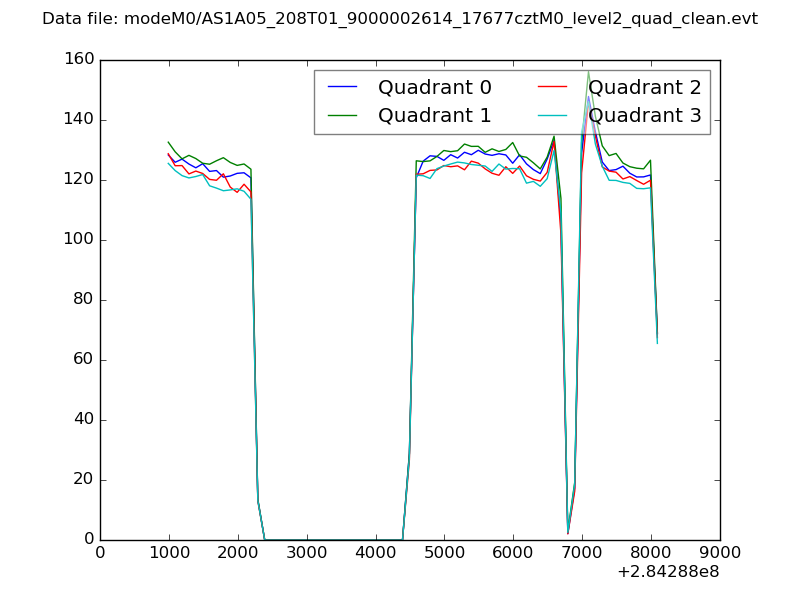 |
|
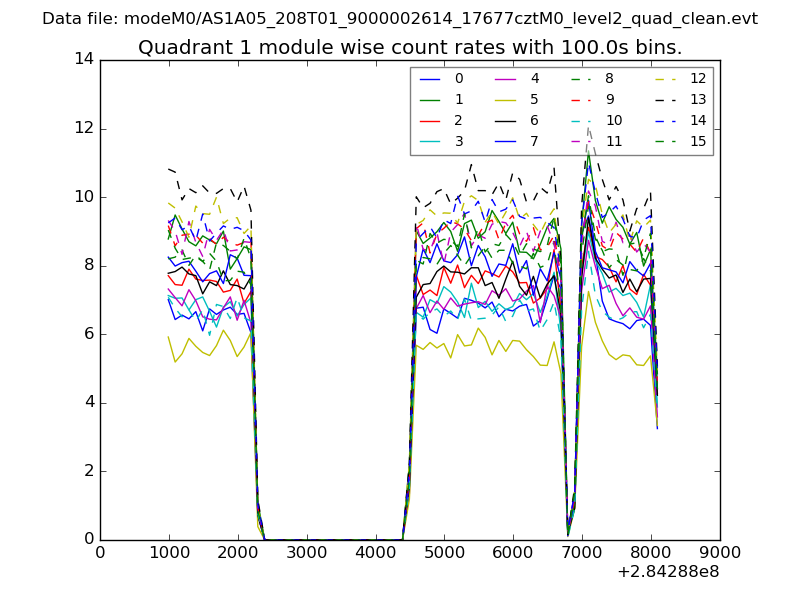
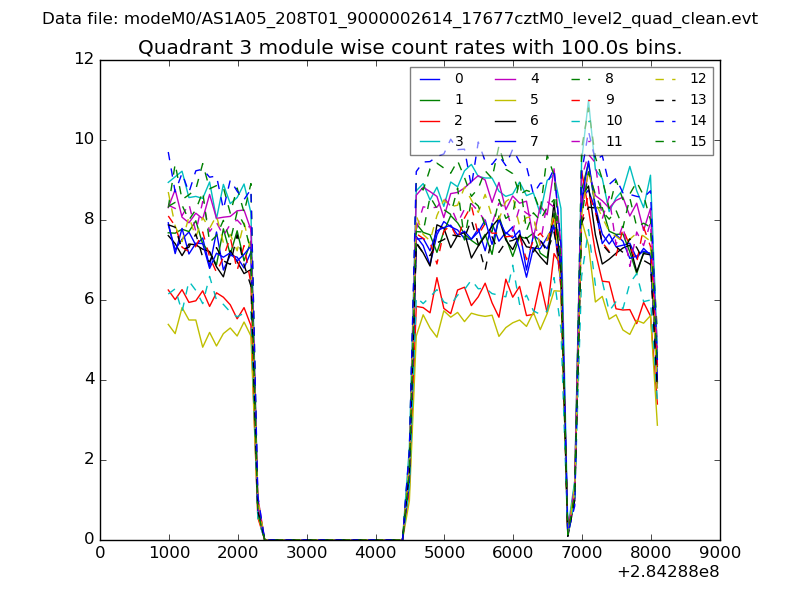
| Module-wise count rates for Quadrant A Data is divided into 100 sec bins |
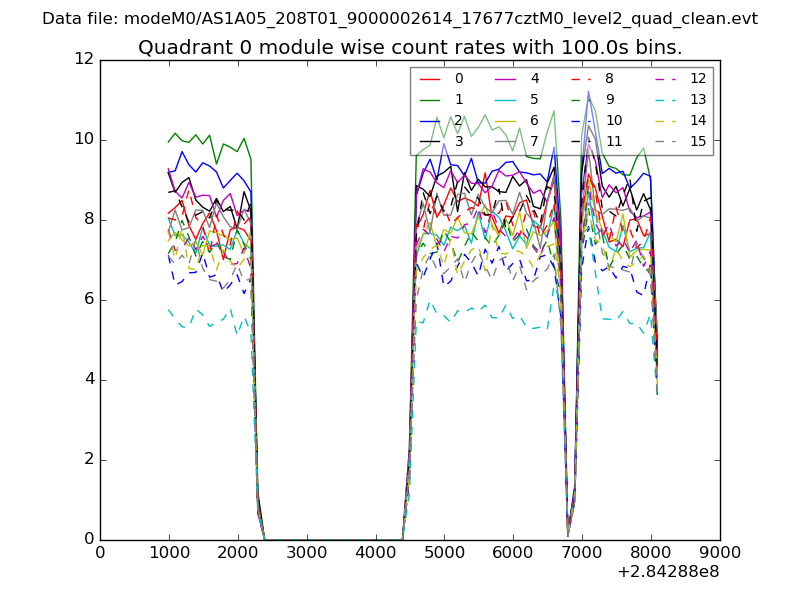 |
 |
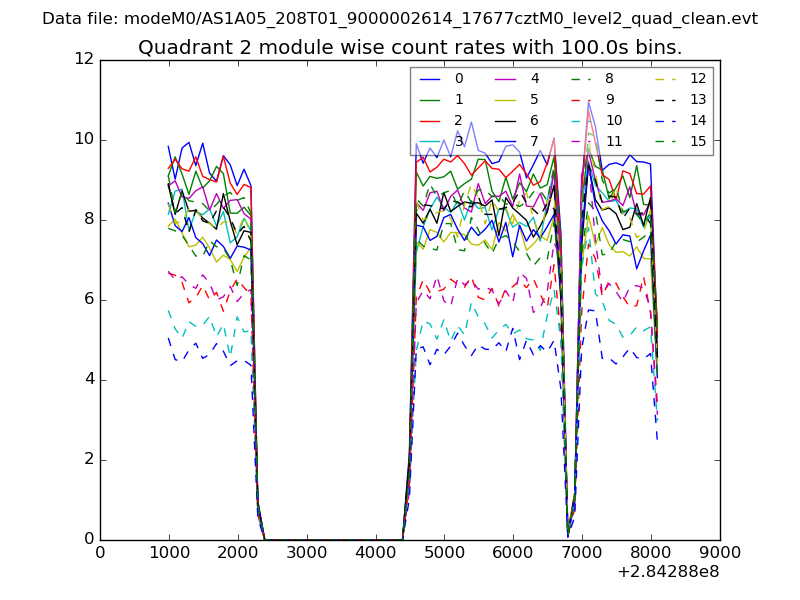
| Module-wise count rates for Quadrant B Data is divided into 100 sec bins |
 |
 |
| Module-wise count rates for Quadrant C Data is divided into 100 sec bins |
 |
 |
| Module-wise count rates for Quadrant D Data is divided into 100 sec bins |
 |
 |
| Parameter | Plot |
|---|---|
| CZT HV Monitor | 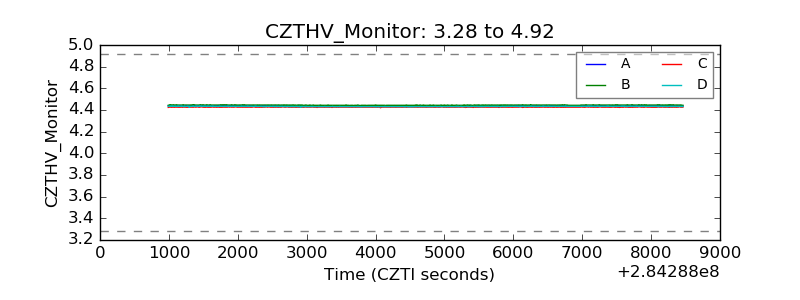 |
| D_VDD | 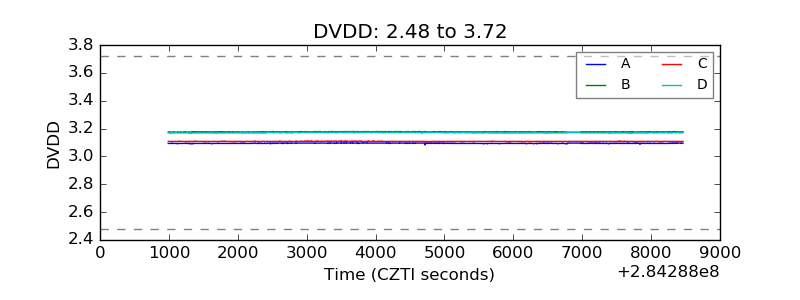 |
| Temperature 1 |  |
| Veto HV Monitor | 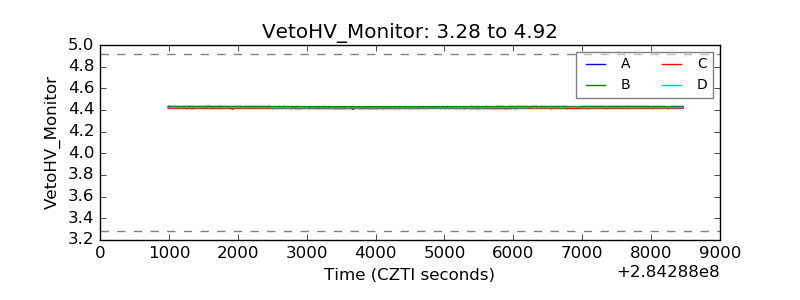 |
| Veto LLD | 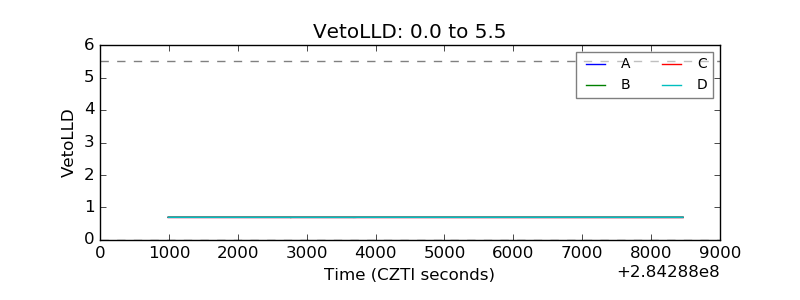 |
| Alpha Counter | 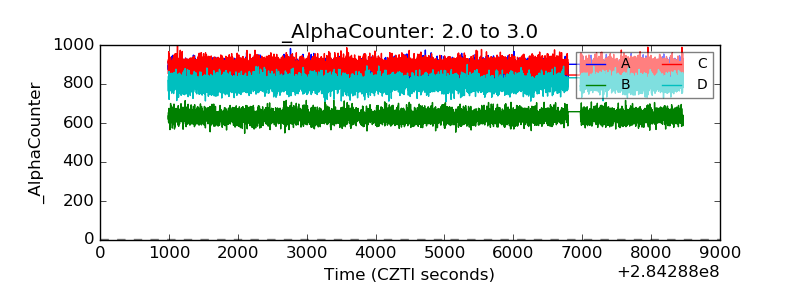 |
| _CPM_Rate | 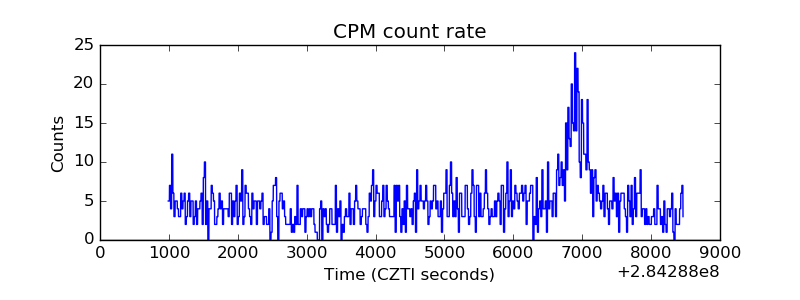 |
| CZT Counter | 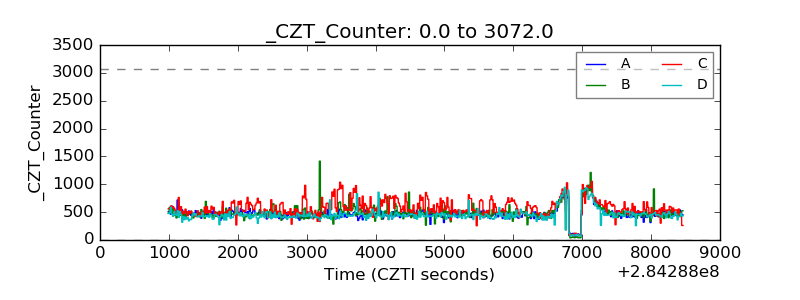 |
| +2.5 Volts monitor |  |
| +5 Volts monitor |  |
| _ROLL_ROT | 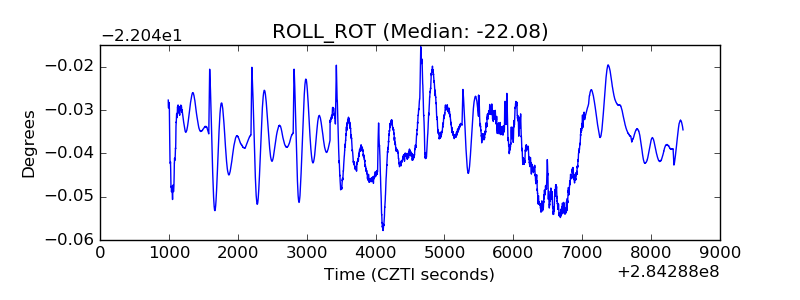 |
| _Roll_DEC | 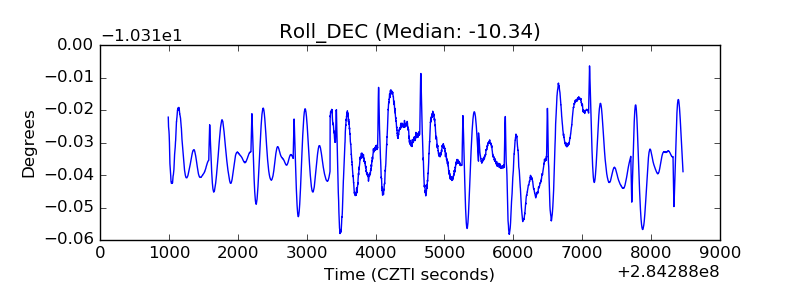 |
| _Roll_RA | 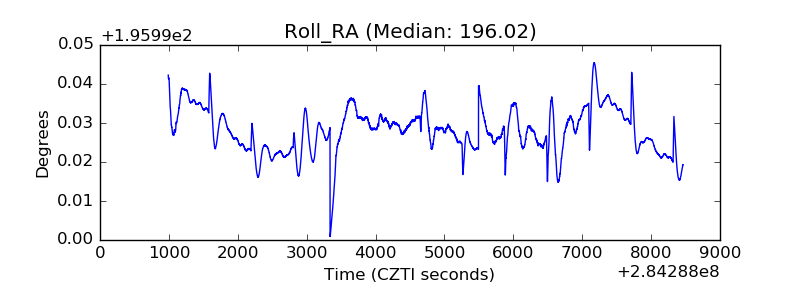 |
| Veto Counter |  |