| Param | Original file | Final file |
|---|---|---|
| Filename | modeM0/AS1A05_208T01_9000002614_17681cztM0_level2.evt | modeM0/AS1A05_208T01_9000002614_17681cztM0_level2_quad_clean.evt |
| Size (bytes) | 218,854,080 | 20,949,120 |
| Size | 208.7 MB | 20.0 MB |
| Events in quadrant A | 1,409,545 | 106,734 |
| Events in quadrant B | 1,588,427 | 107,568 |
| Events in quadrant C | 1,618,455 | 104,828 |
| Events in quadrant D | 1,809,546 | 104,331 |
| Mode M0 | |||
|---|---|---|---|
| Quadrant | BADHDUFLAG | Total packets | Discarded packets |
| A | 0 | 6049 | 0 |
| B | 0 | 6575 | 0 |
| C | 0 | 6694 | 0 |
| D | 0 | 7400 | 0 |
| Mode SS | |||
|---|---|---|---|
| Quadrant | BADHDUFLAG | Total packets | Discarded packets |
| A | 0 | 60 | 0 |
| B | 0 | 60 | 0 |
| C | 0 | 60 | 0 |
| D | 0 | 60 | 0 |
| Quadrant | Total seconds | Saturated seconds | Saturation percentage |
|---|---|---|---|
| A | 2941 | 3 | 0.102006% |
| B | 2941 | 46 | 1.564094% |
| C | 2941 | 18 | 0.612037% |
| D | 2942 | 49 | 1.665534% |
Noise dominated data is calculated using 1-second bins in cleaned event files. If a bin has >2000 counts, and if more than 50% of those come from <1% of pixels, then it is considered to be noise-dominated and hence unusable.
| Quadrant | # 1 sec bins | Bins with >0 counts | Bins with >2000 counts | High rate bins dominated by noise | Noise dominated (total time) | Noise dominated (detector-on time) | Marked lightcurve |
|---|---|---|---|---|---|---|---|
| A | 2941 | 2941 | 0 | 0 | 0.00% | 0.00% | 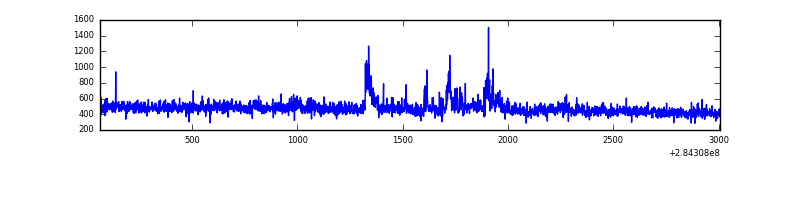 |
| B | 2941 | 2941 | 28 | 28 | 0.95% | 0.95% | 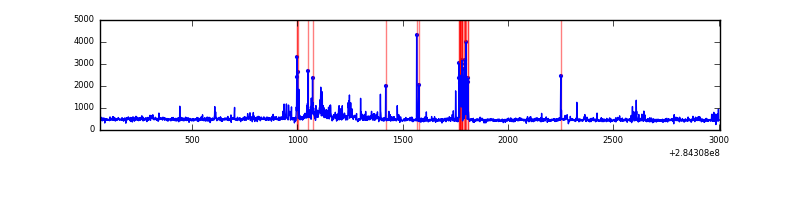 |
| C | 2941 | 2941 | 0 | 0 | 0.00% | 0.00% | 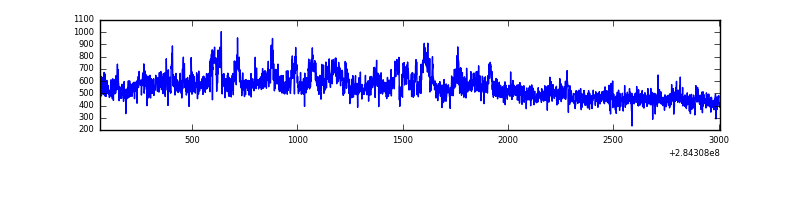 |
| D | 2942 | 2942 | 31 | 31 | 1.05% | 1.05% | 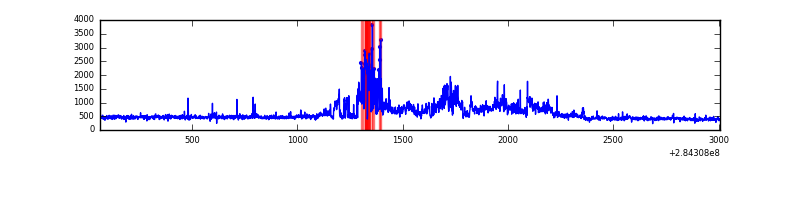 |
Top three noisy pixels from each quadrant. If the there are fewer than three noisy pixels in the level2.evt file, extra rows are filled as -1
| Pixel properties | Quadrant properties | ||||||
|---|---|---|---|---|---|---|---|
| Quadrant | DetID | PixID | Counts | Sigma | Mean | Median | Sigma |
| A | 14 | 237 | 89973 | 1241.63 | 342 | 334 | 72.2 |
| A | 0 | 226 | 2996 | 36.87 | 342 | 334 | 72.2 |
| A | 3 | 137 | 2683 | 32.54 | 342 | 334 | 72.2 |
| B | 7 | 220 | 134520 | 2014.86 | 340 | 332 | 66.6 |
| B | 10 | 245 | 37169 | 553.12 | 340 | 332 | 66.6 |
| B | 0 | 229 | 34203 | 508.58 | 340 | 332 | 66.6 |
| C | 3 | 233 | 277105 | 3536.86 | 327 | 329 | 78.3 |
| C | 14 | 238 | 50638 | 642.89 | 327 | 329 | 78.3 |
| C | 5 | 218 | 13967 | 174.28 | 327 | 329 | 78.3 |
| D | 7 | 238 | 534398 | 6424.63 | 332 | 322 | 83.1 |
| D | 2 | 234 | 14172 | 166.61 | 332 | 322 | 83.1 |
| D | 10 | 70 | 8702 | 100.81 | 332 | 322 | 83.1 |
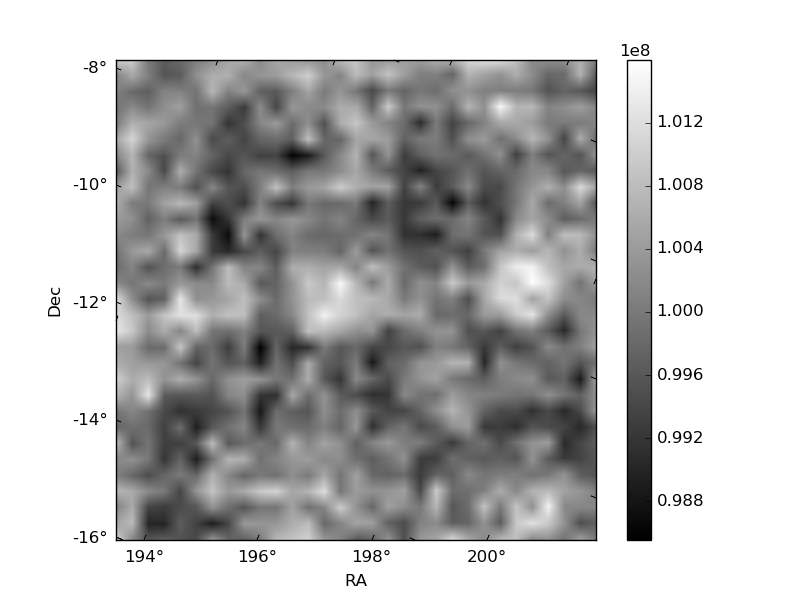
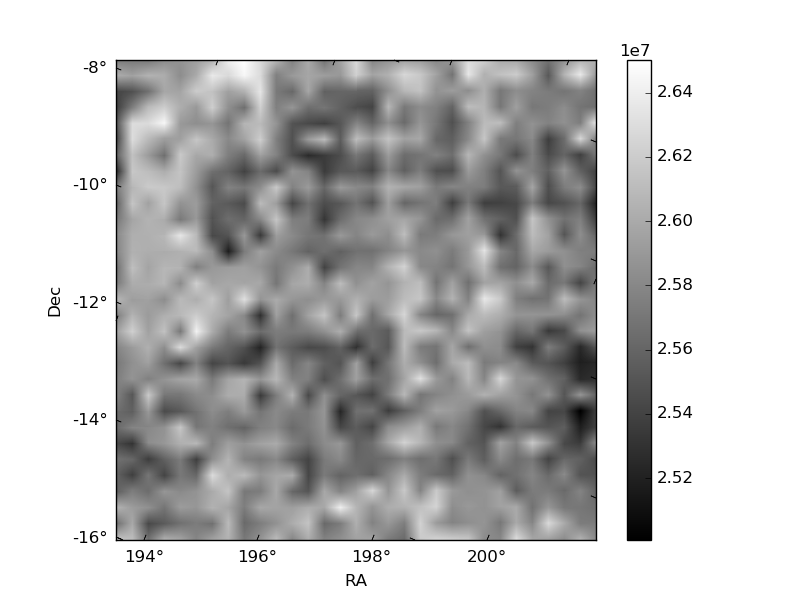
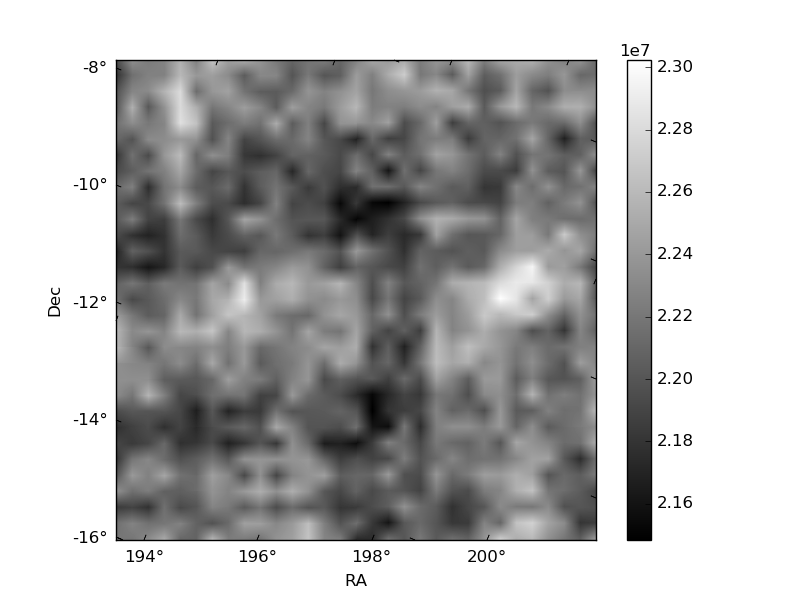
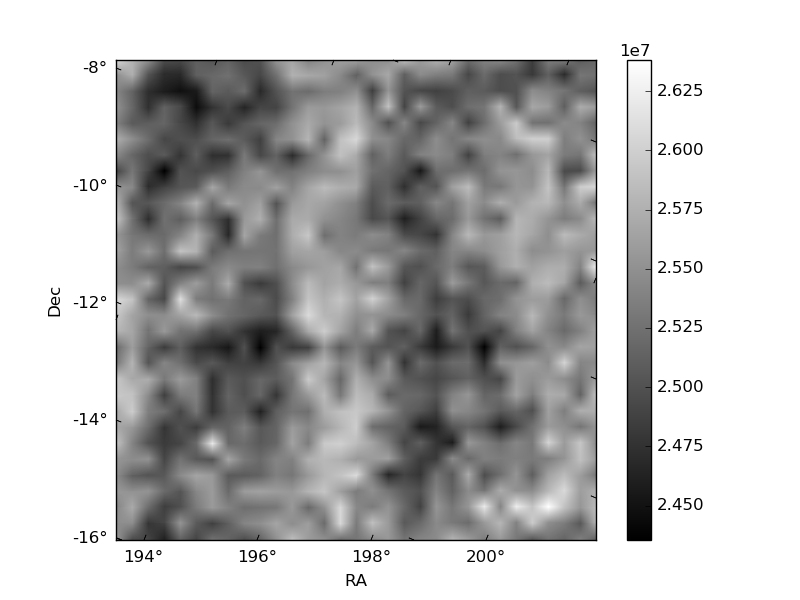
Histogram calculated using DETX and DETY for each event in the final _common_clean file
| Quadrant A | 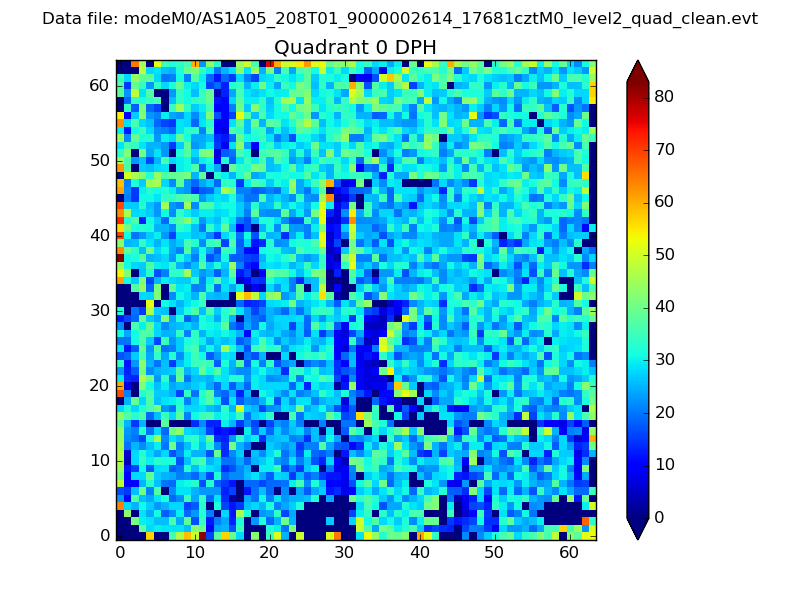 |
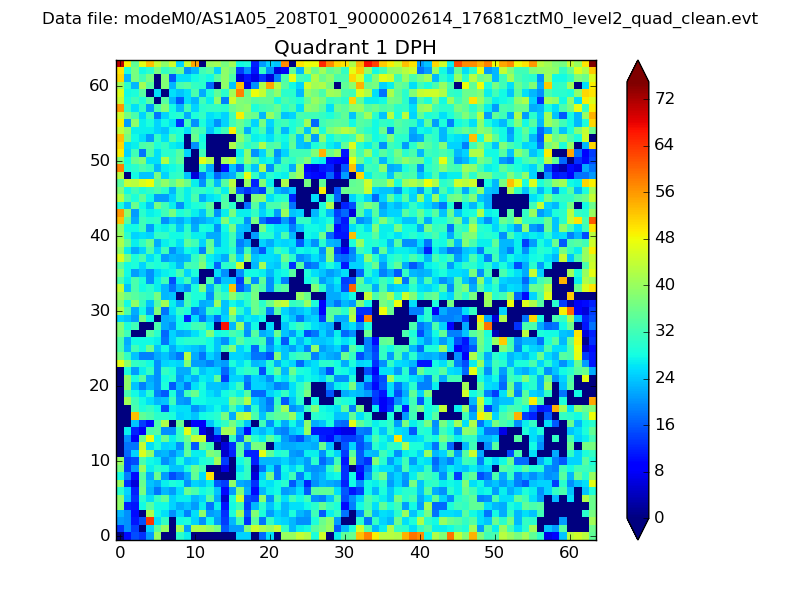 |
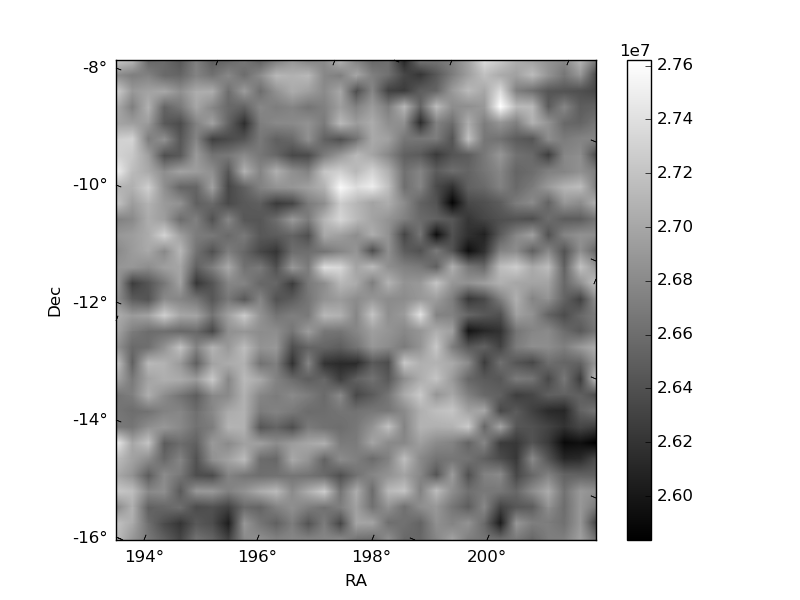
Quadrant B |
|---|---|---|---|
| Quadrant D | 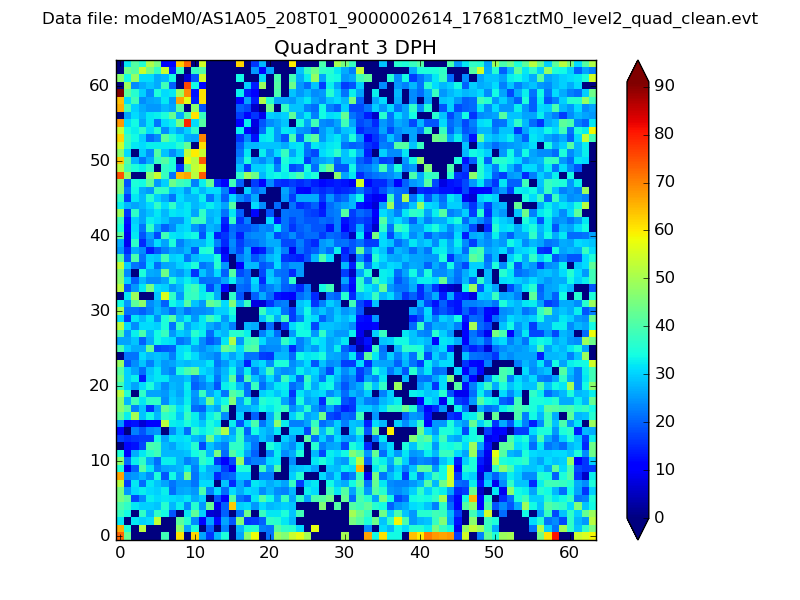 |
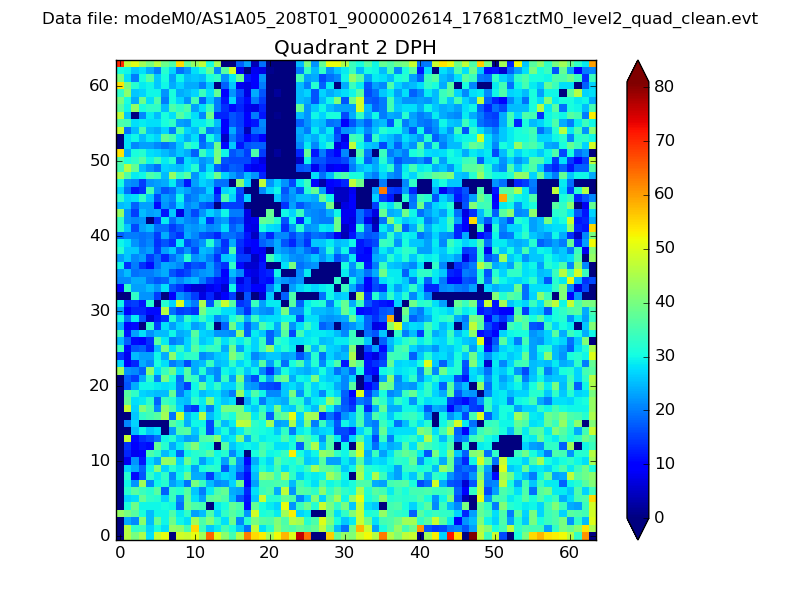 |
Quadrant C |
| Plot type | Count rate plots | Images |
|---|---|---|
| Comparison with Poisson distribution Blue bars denote a histogram of data divided into 1 sec bins. Red curve is a Poisson curve with rate = median count rate of data. |
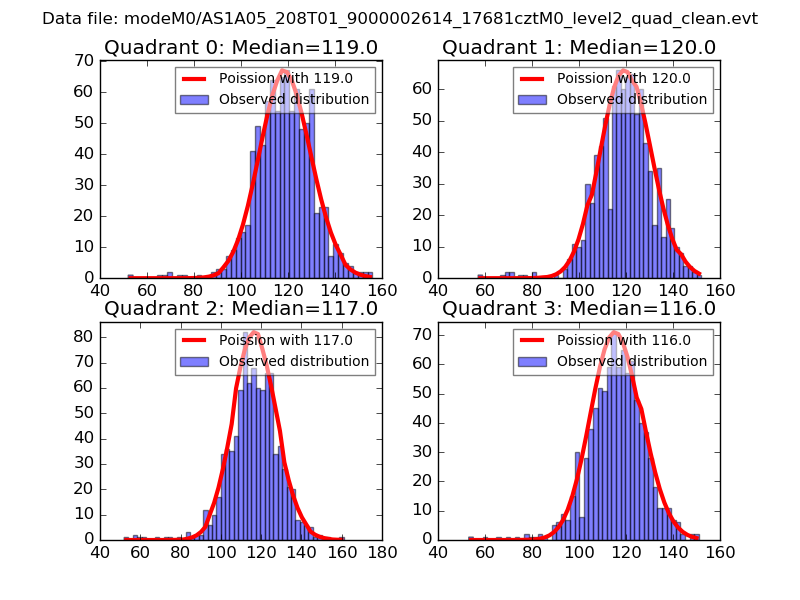 |
 |
| Quadrant-wise count rates Data is divided into 100 sec bins |
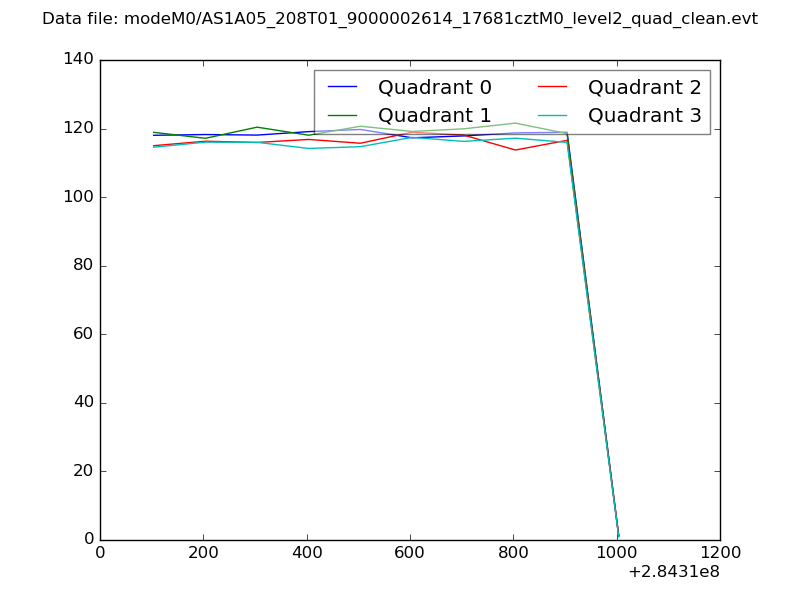 |
|
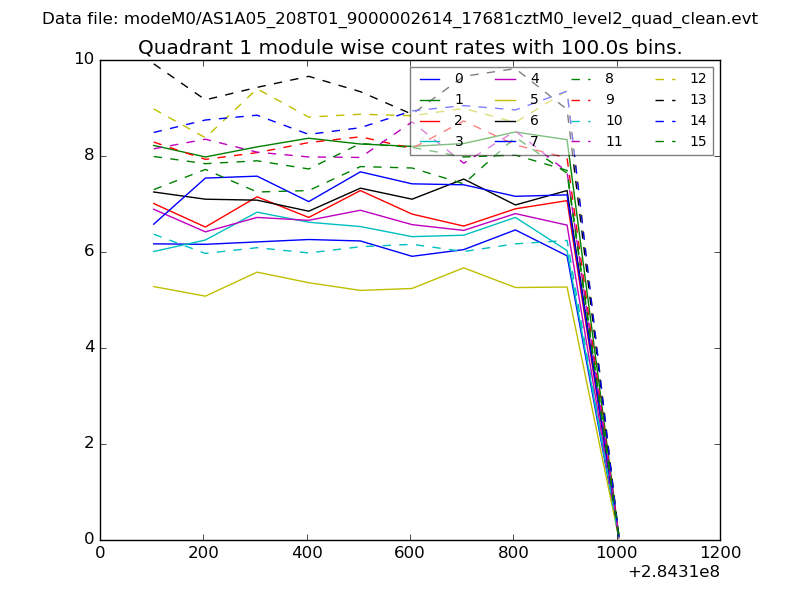
| Module-wise count rates for Quadrant A Data is divided into 100 sec bins |
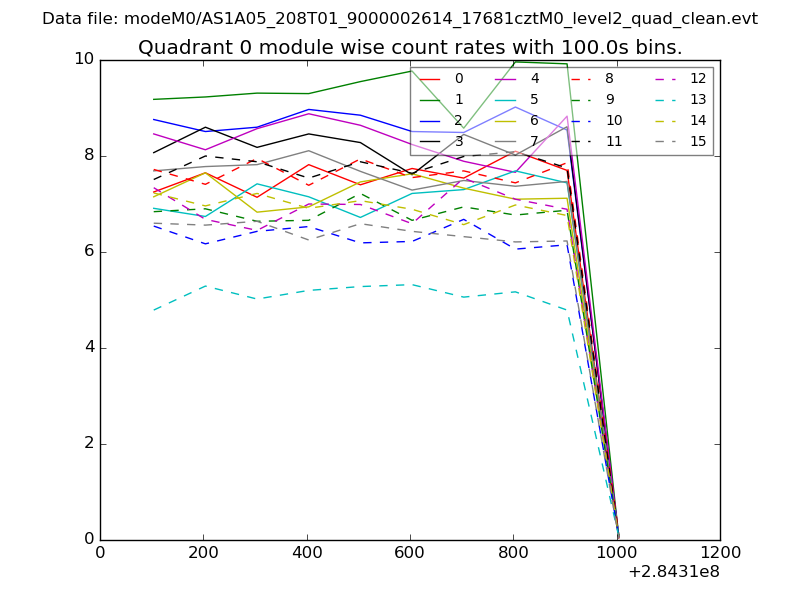 |
 |
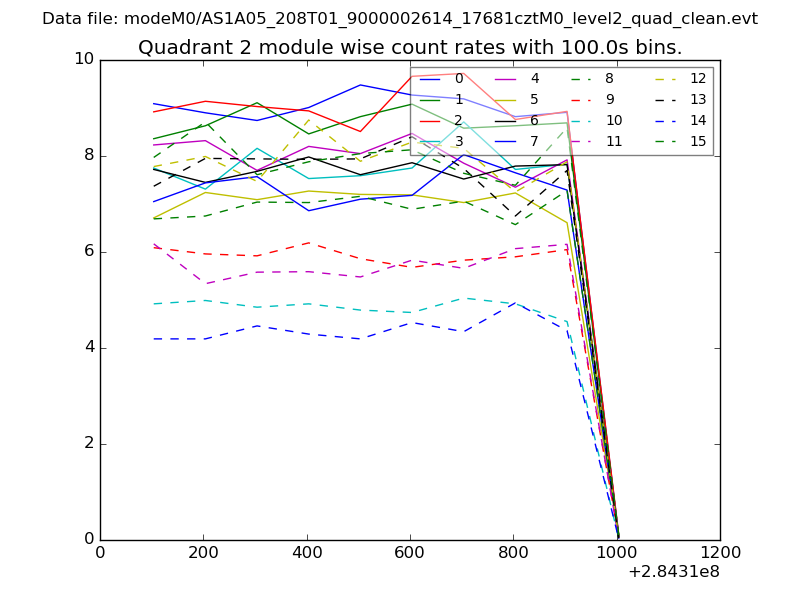
| Module-wise count rates for Quadrant B Data is divided into 100 sec bins |
 |
 |
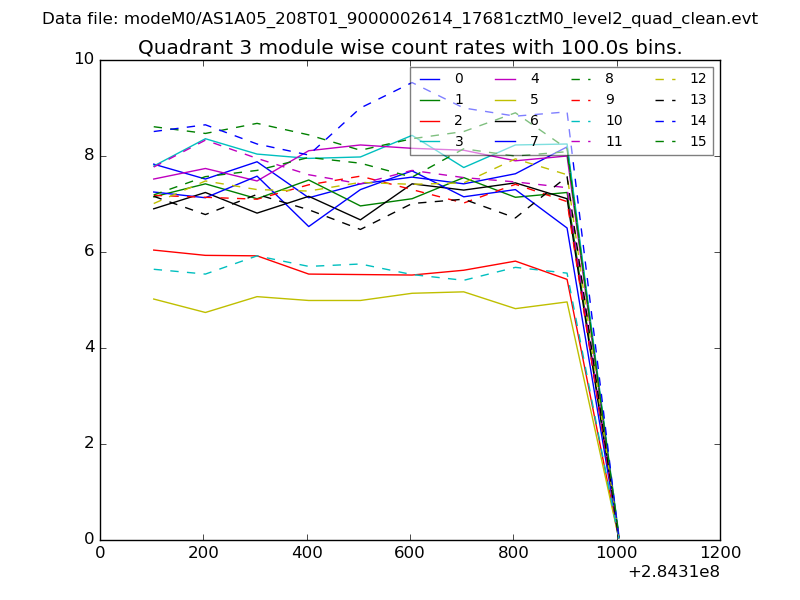
| Module-wise count rates for Quadrant C Data is divided into 100 sec bins |
 |
 |
| Module-wise count rates for Quadrant D Data is divided into 100 sec bins |
 |
 |
| Parameter | Plot |
|---|---|
| CZT HV Monitor | 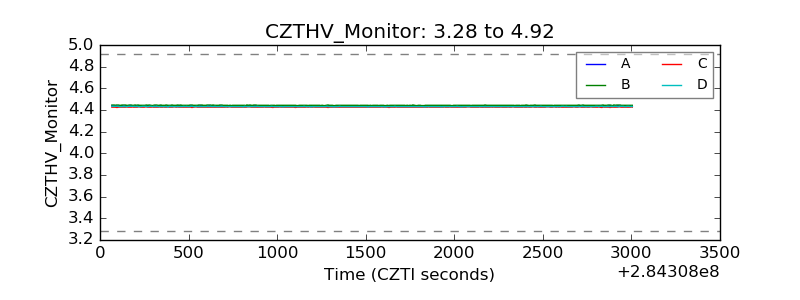 |
| D_VDD | 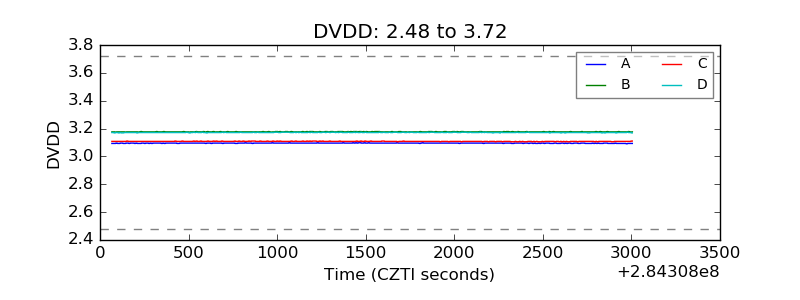 |
| Temperature 1 | 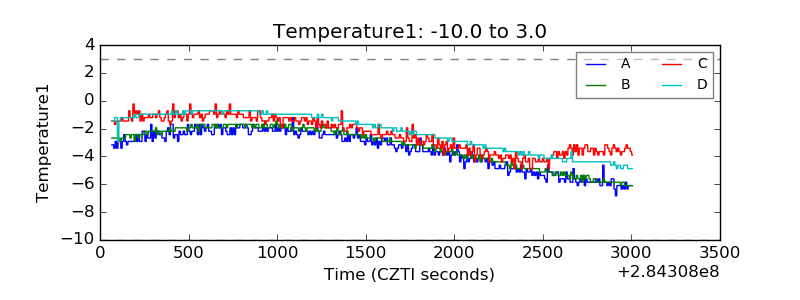 |
| Veto HV Monitor | 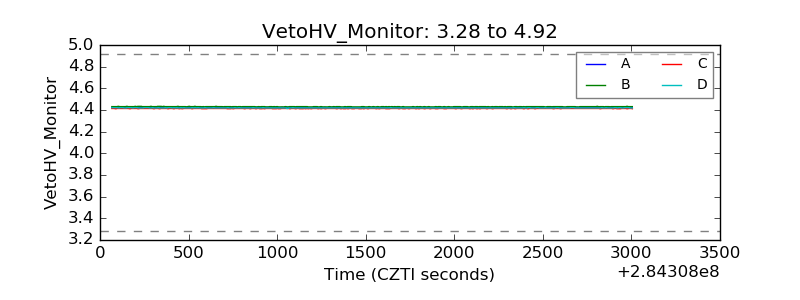 |
| Veto LLD | 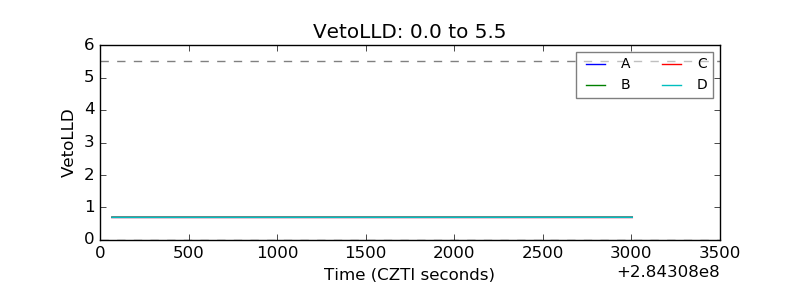 |
| Alpha Counter | 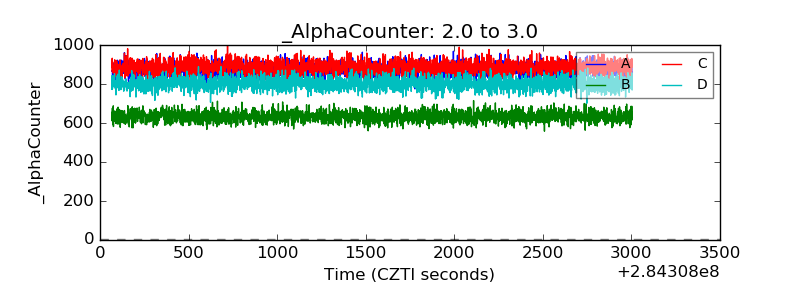 |
| _CPM_Rate | 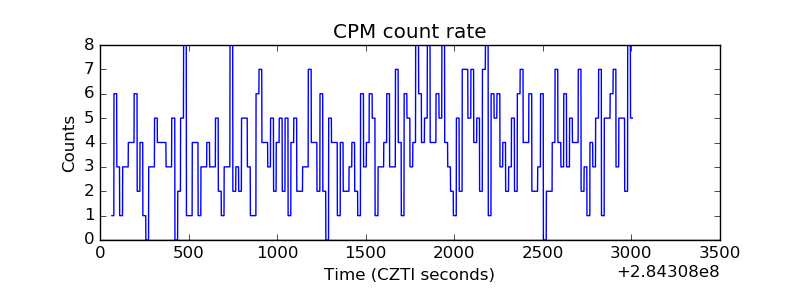 |
| CZT Counter | 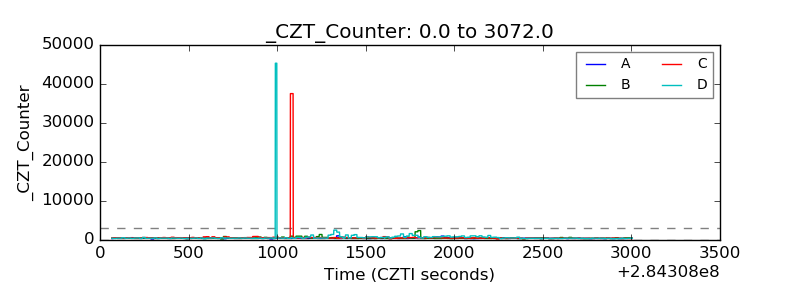 |
| +2.5 Volts monitor | 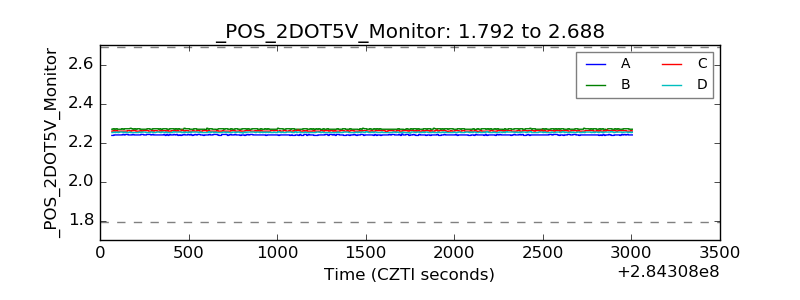 |
| +5 Volts monitor | 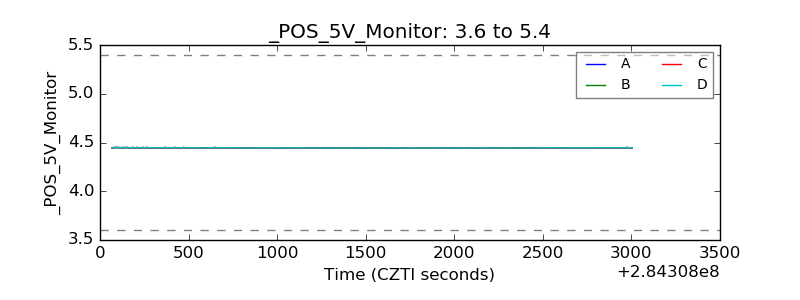 |
| _ROLL_ROT | 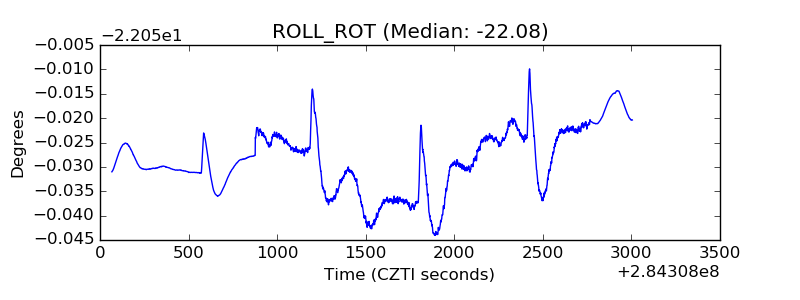 |
| _Roll_DEC | 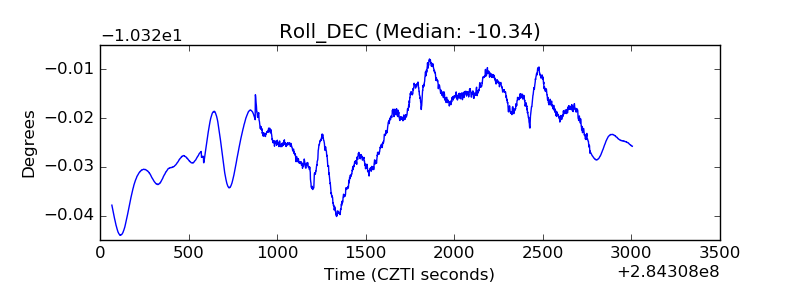 |
| _Roll_RA | 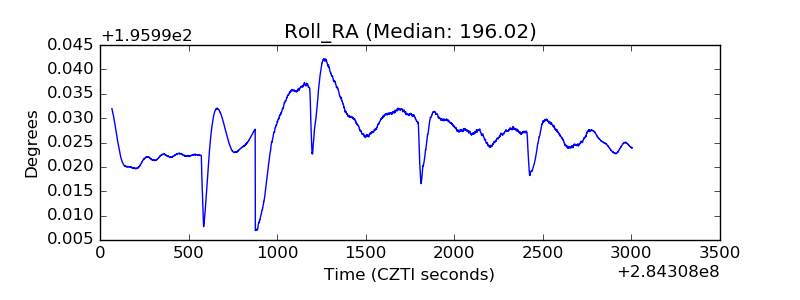 |
| Veto Counter | 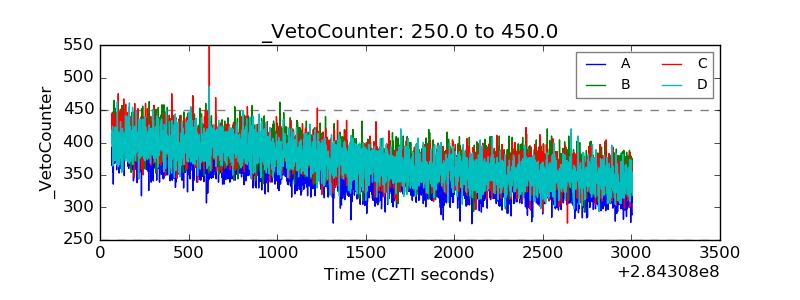 |