| Param | Original file | Final file |
|---|---|---|
| Filename | modeM0/AS1A05_208T01_9000002614_17682cztM0_level2.evt | modeM0/AS1A05_208T01_9000002614_17682cztM0_level2_quad_clean.evt |
| Size (bytes) | 613,503,360 | 87,563,520 |
| Size | 585.1 MB | 83.5 MB |
| Events in quadrant A | 4,105,780 | 516,099 |
| Events in quadrant B | 4,603,619 | 522,388 |
| Events in quadrant C | 4,700,009 | 503,938 |
| Events in quadrant D | 4,576,802 | 501,253 |
| Mode M9 | |||
|---|---|---|---|
| Quadrant | BADHDUFLAG | Total packets | Discarded packets |
| A | 0 | 4 | 0 |
| B | 0 | 4 | 0 |
| C | 0 | 4 | 0 |
| D | 0 | 4 | 0 |
| Mode M0 | |||
|---|---|---|---|
| Quadrant | BADHDUFLAG | Total packets | Discarded packets |
| A | 0 | 17989 | 1 |
| B | 0 | 19226 | 1 |
| C | 0 | 19342 | 1 |
| D | 0 | 19655 | 1 |
| Mode SS | |||
|---|---|---|---|
| Quadrant | BADHDUFLAG | Total packets | Discarded packets |
| A | 0 | 178 | 0 |
| B | 0 | 178 | 0 |
| C | 0 | 178 | 0 |
| D | 0 | 178 | 0 |
| Quadrant | Total seconds | Saturated seconds | Saturation percentage |
|---|---|---|---|
| A | 8752 | 90 | 1.028336% |
| B | 8752 | 170 | 1.942413% |
| C | 8753 | 145 | 1.656575% |
| D | 8753 | 140 | 1.599452% |
Noise dominated data is calculated using 1-second bins in cleaned event files. If a bin has >2000 counts, and if more than 50% of those come from <1% of pixels, then it is considered to be noise-dominated and hence unusable.
| Quadrant | # 1 sec bins | Bins with >0 counts | Bins with >2000 counts | High rate bins dominated by noise | Noise dominated (total time) | Noise dominated (detector-on time) | Marked lightcurve |
|---|---|---|---|---|---|---|---|
| A | 9157 | 8752 | 0 | 0 | 0.00% | 0.00% | 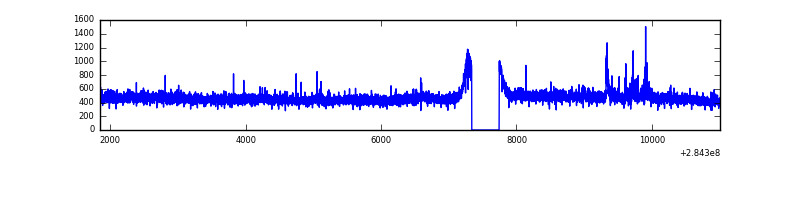 |
| B | 9157 | 8752 | 47 | 47 | 0.51% | 0.54% | 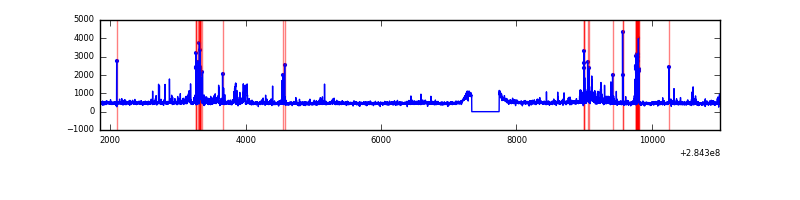 |
| C | 9158 | 8753 | 1 | 1 | 0.01% | 0.01% | 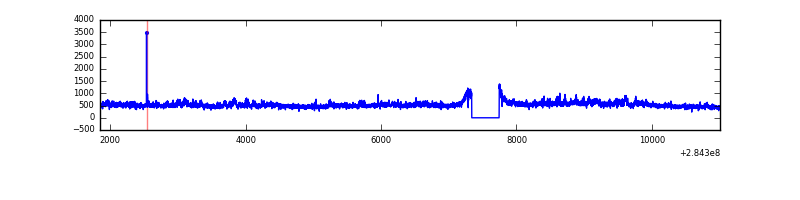 |
| D | 9158 | 8753 | 40 | 40 | 0.44% | 0.46% |  |
Top three noisy pixels from each quadrant. If the there are fewer than three noisy pixels in the level2.evt file, extra rows are filled as -1
| Pixel properties | Quadrant properties | ||||||
|---|---|---|---|---|---|---|---|
| Quadrant | DetID | PixID | Counts | Sigma | Mean | Median | Sigma |
| A | 14 | 237 | 107650 | 499.59 | 1039 | 1013 | 213.4 |
| A | 0 | 226 | 9013 | 37.48 | 1039 | 1013 | 213.4 |
| A | 3 | 137 | 7973 | 32.61 | 1039 | 1013 | 213.4 |
| B | 7 | 220 | 231134 | 1162.63 | 1033 | 1007 | 197.9 |
| B | 10 | 245 | 178818 | 898.32 | 1033 | 1007 | 197.9 |
| B | 0 | 189 | 41537 | 204.76 | 1033 | 1007 | 197.9 |
| C | 3 | 233 | 600679 | 2542.14 | 999 | 1007 | 235.9 |
| C | 14 | 238 | 151807 | 639.28 | 999 | 1007 | 235.9 |
| C | 5 | 218 | 27663 | 113.0 | 999 | 1007 | 235.9 |
| D | 7 | 238 | 537107 | 2159.53 | 1016 | 989 | 248.3 |
| D | 1 | 52 | 133122 | 532.24 | 1016 | 989 | 248.3 |
| D | 2 | 234 | 42110 | 165.64 | 1016 | 989 | 248.3 |
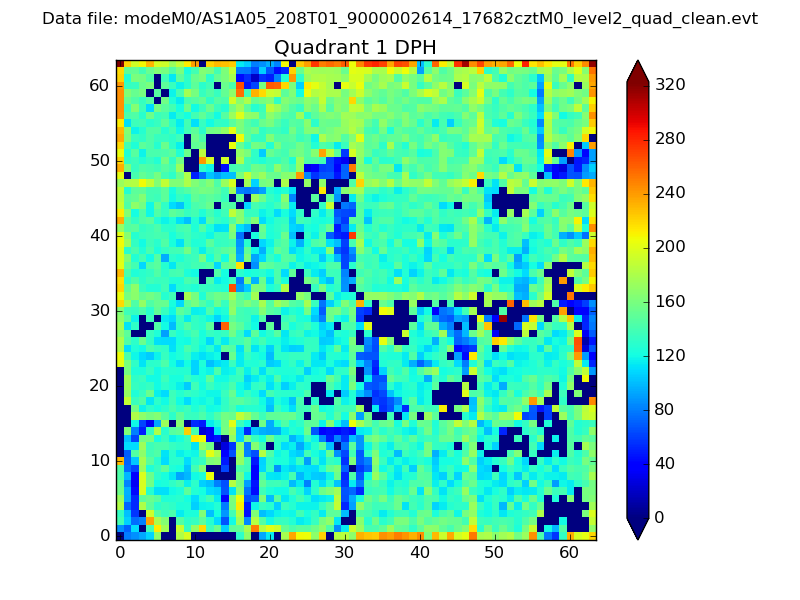
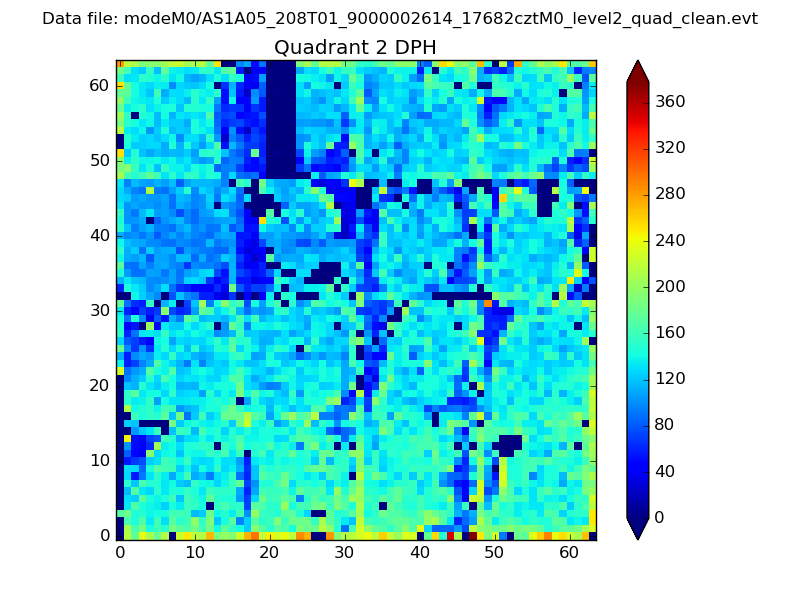
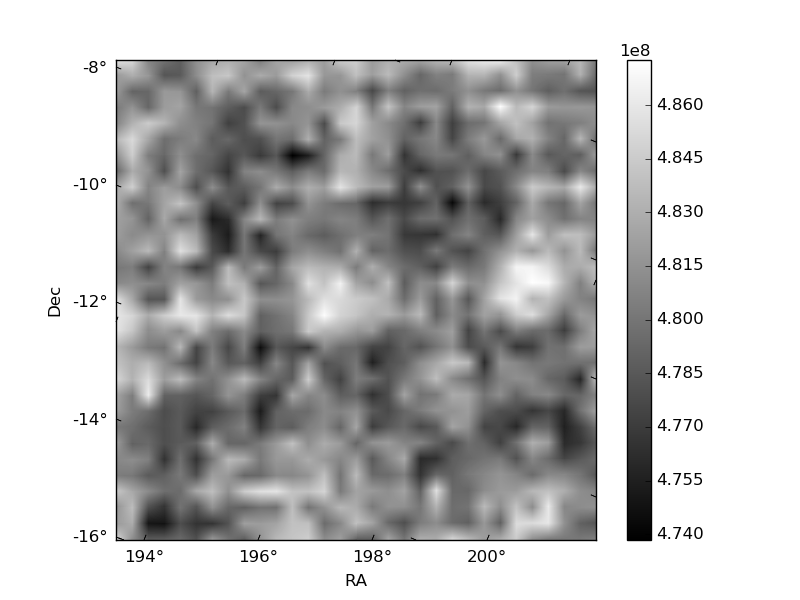
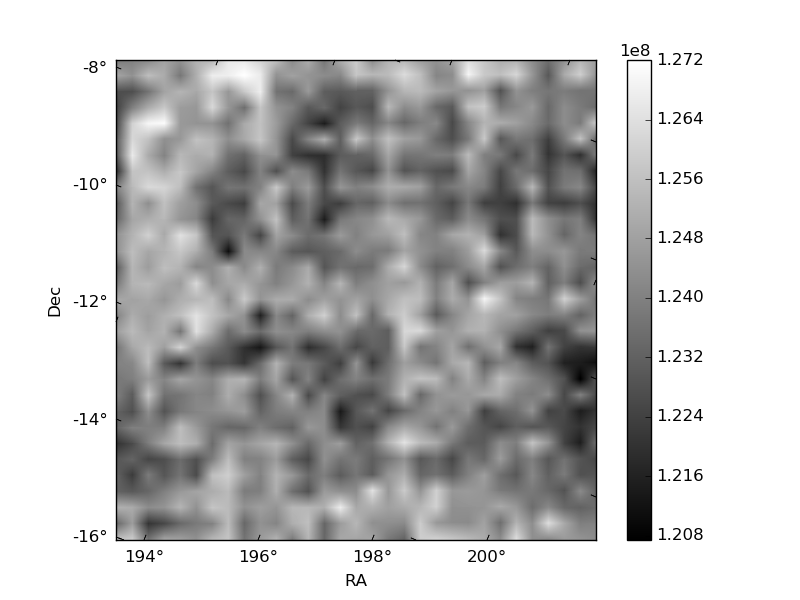
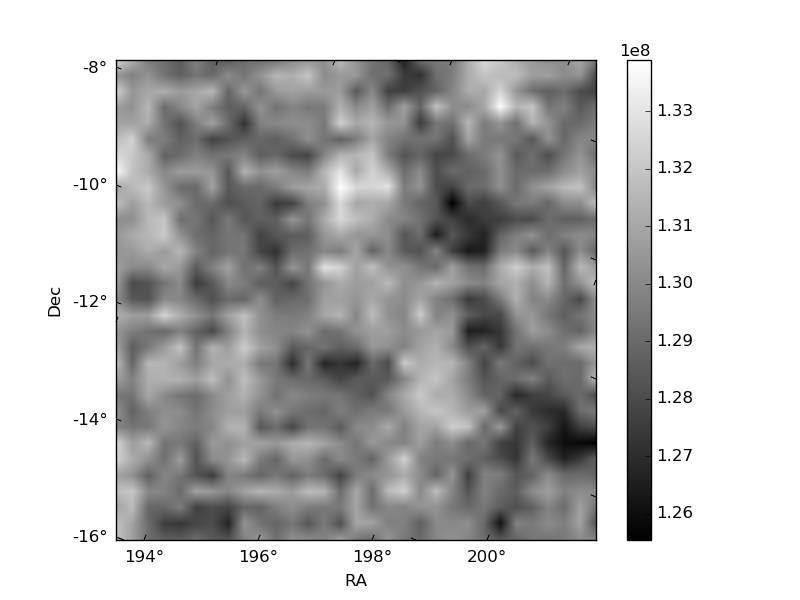
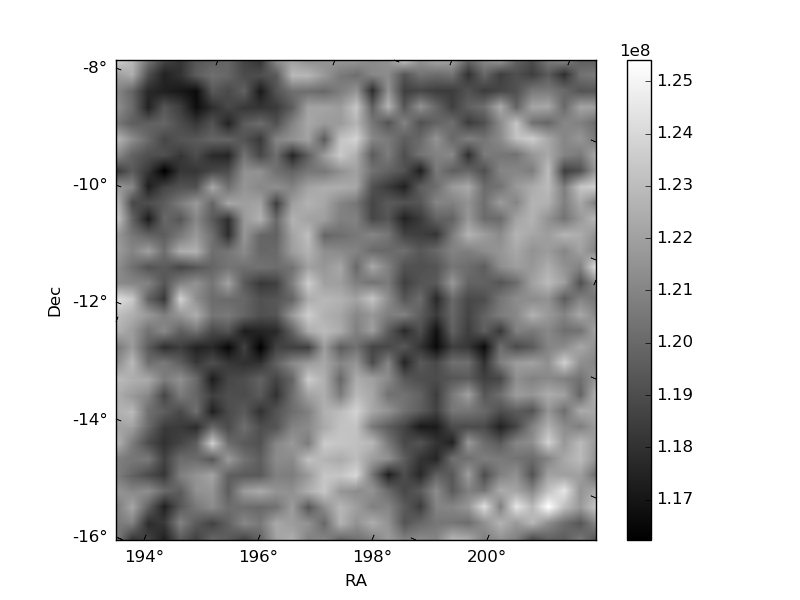
Histogram calculated using DETX and DETY for each event in the final _common_clean file
| Quadrant A | 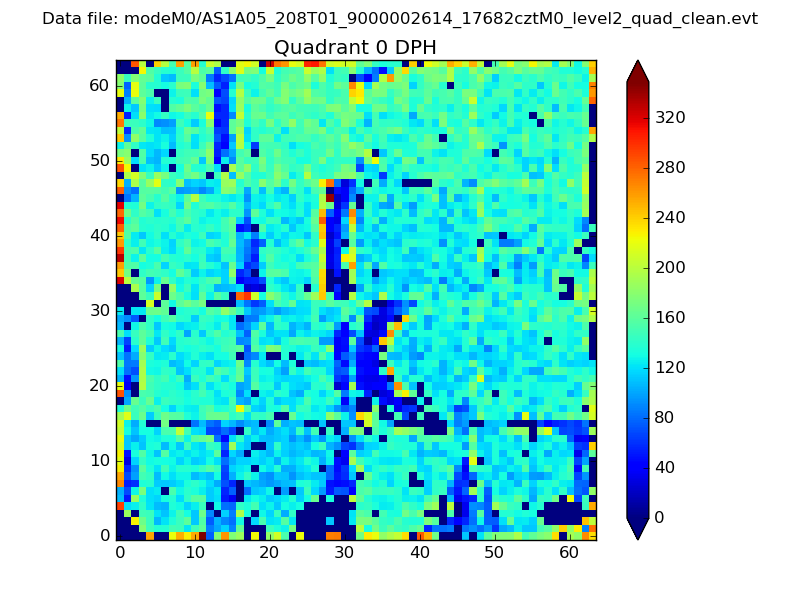 |
 |
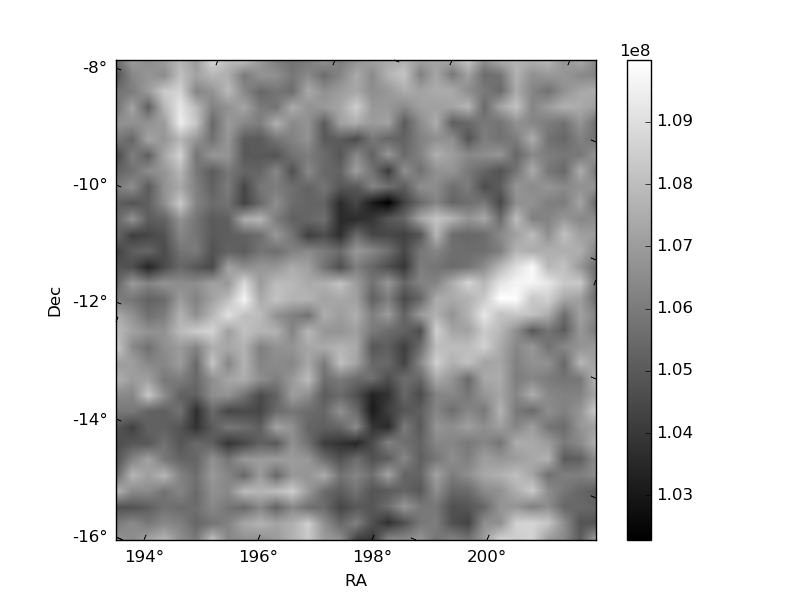
Quadrant B |
|---|---|---|---|
| Quadrant D | 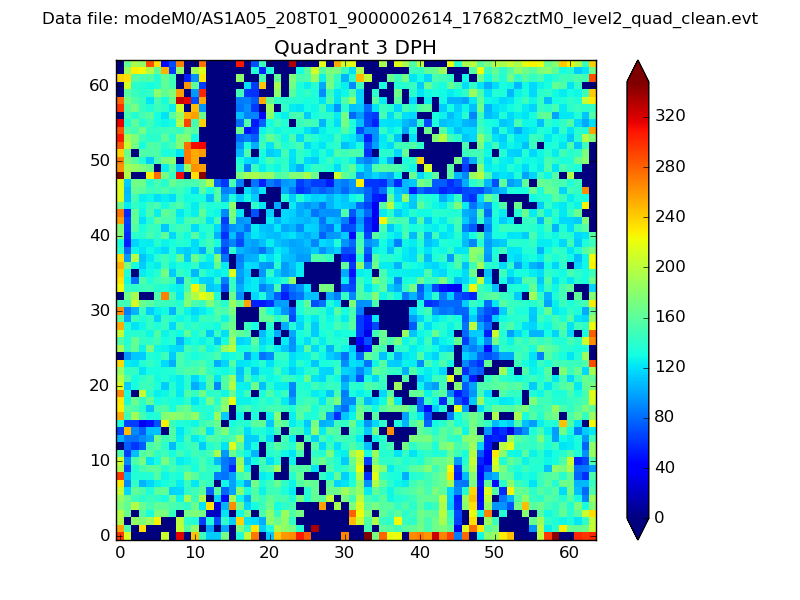 |
 |
Quadrant C |
| Plot type | Count rate plots | Images |
|---|---|---|
| Comparison with Poisson distribution Blue bars denote a histogram of data divided into 1 sec bins. Red curve is a Poisson curve with rate = median count rate of data. |
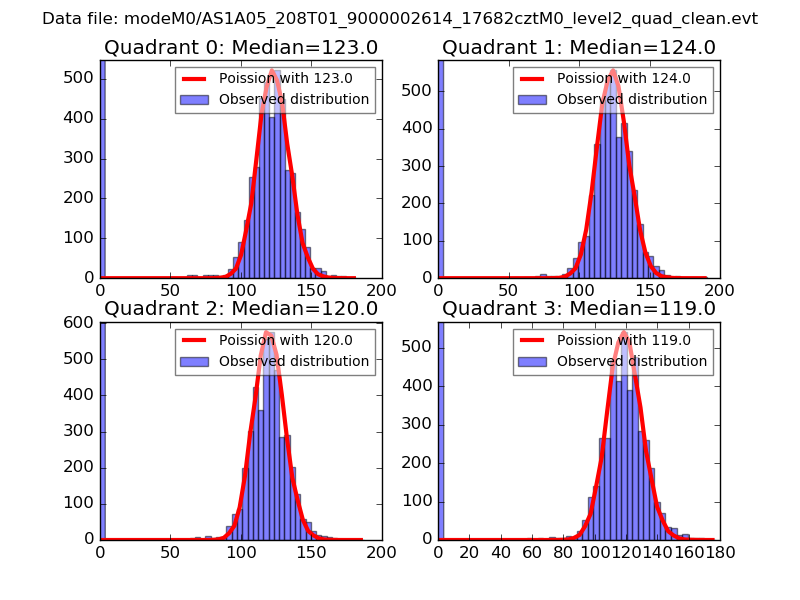 |
 |
| Quadrant-wise count rates Data is divided into 100 sec bins |
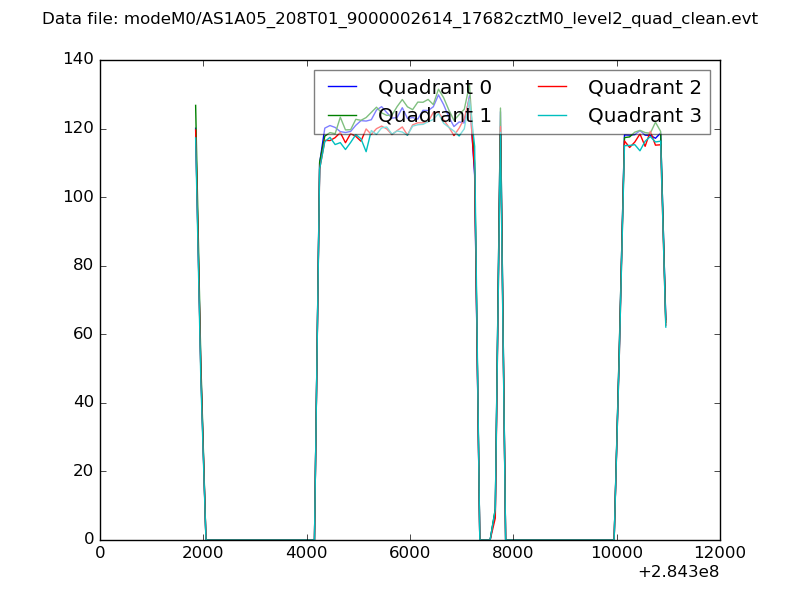 |
|
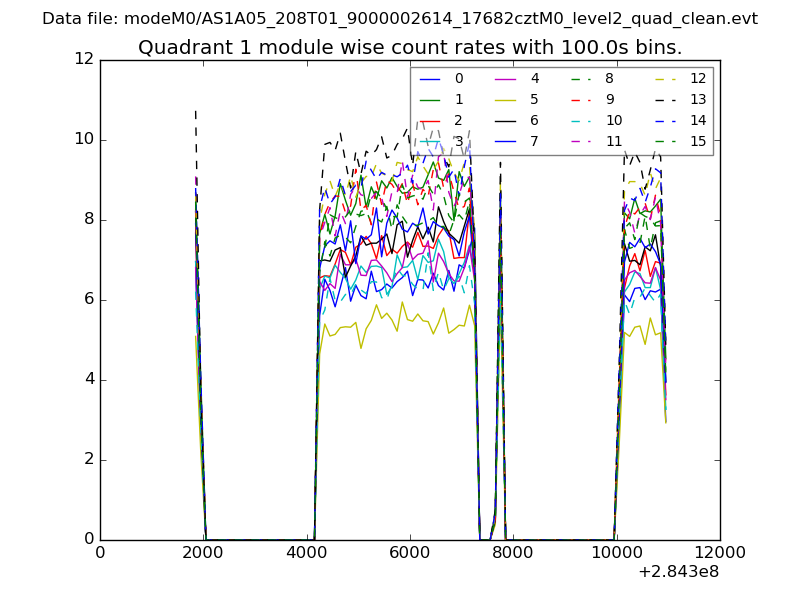
| Module-wise count rates for Quadrant A Data is divided into 100 sec bins |
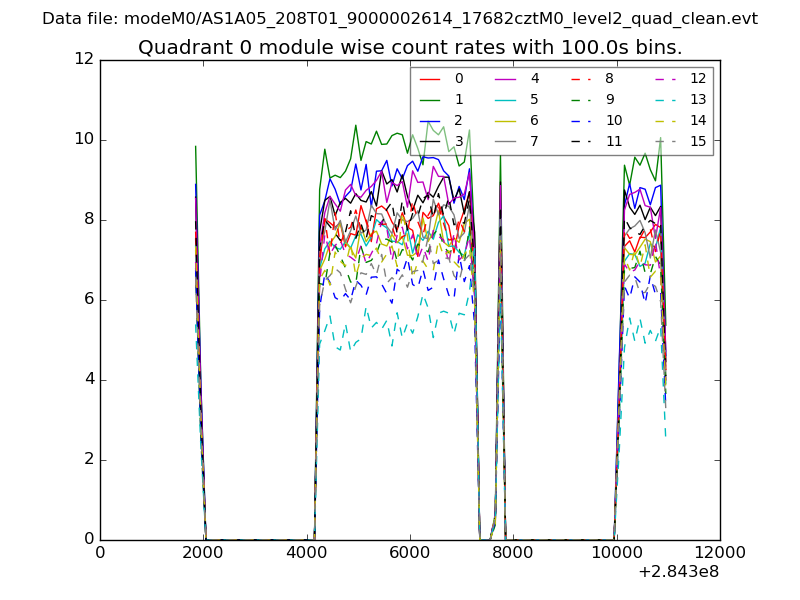 |
 |
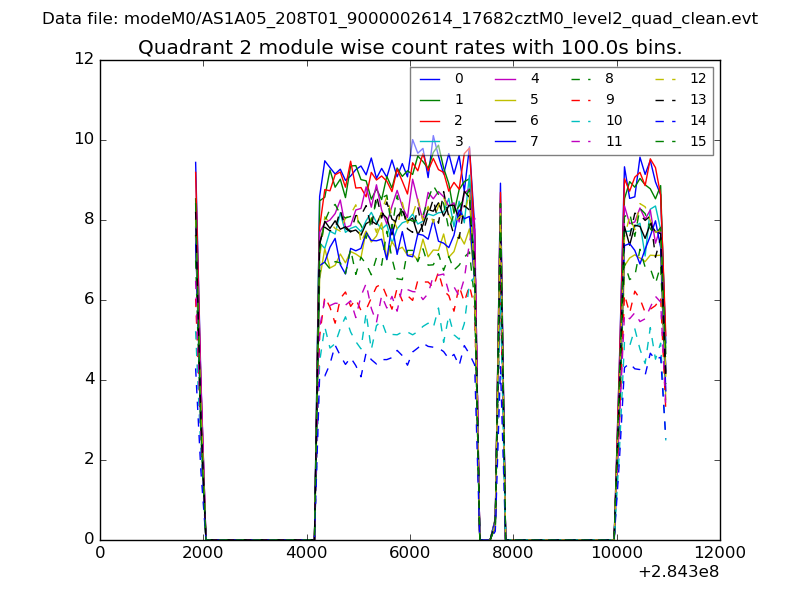
| Module-wise count rates for Quadrant B Data is divided into 100 sec bins |
 |
 |
| Module-wise count rates for Quadrant C Data is divided into 100 sec bins |
 |
 |
| Module-wise count rates for Quadrant D Data is divided into 100 sec bins |
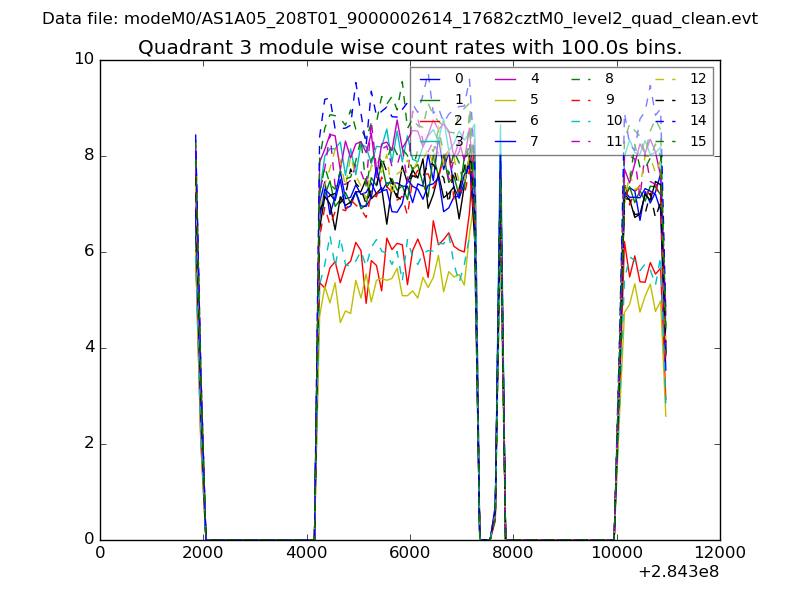 |
 |
| Parameter | Plot |
|---|---|
| CZT HV Monitor | 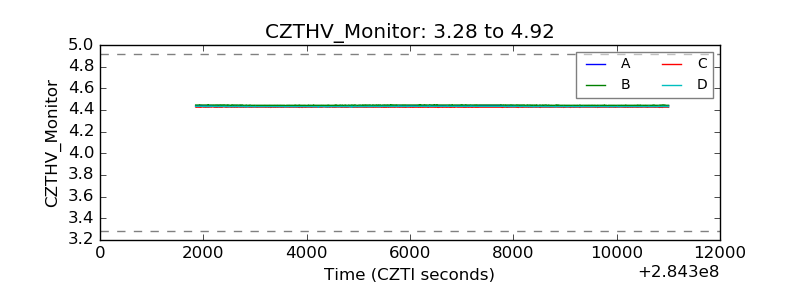 |
| D_VDD |  |
| Temperature 1 | 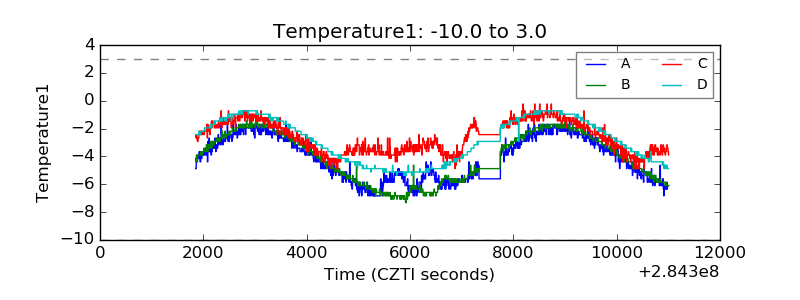 |
| Veto HV Monitor | 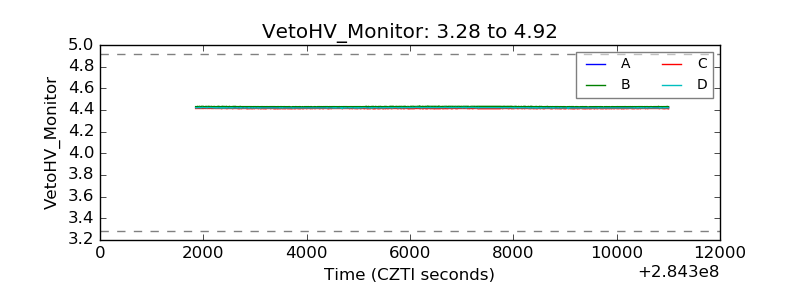 |
| Veto LLD | 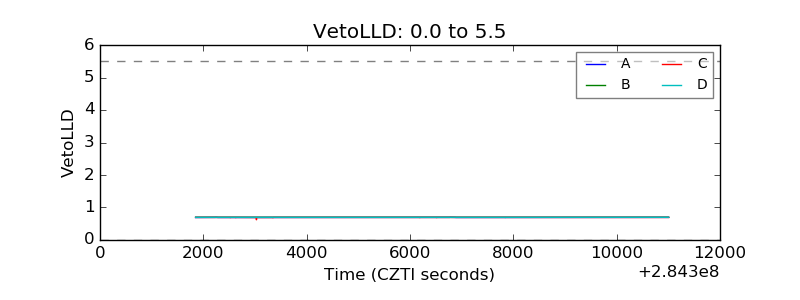 |
| Alpha Counter | 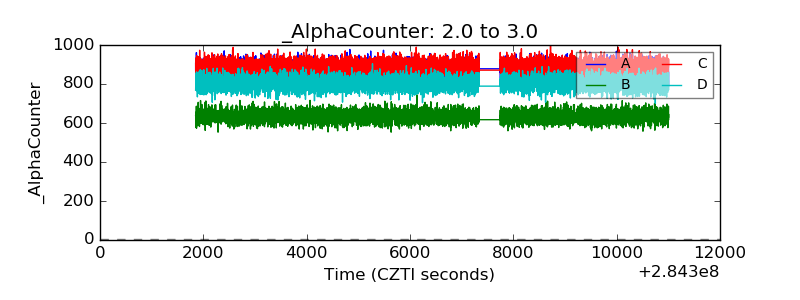 |
| _CPM_Rate | 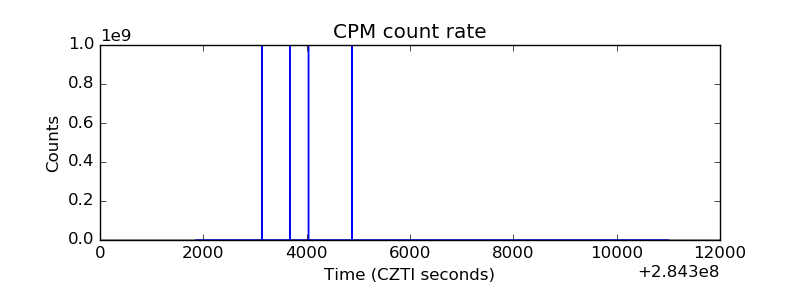 |
| CZT Counter | 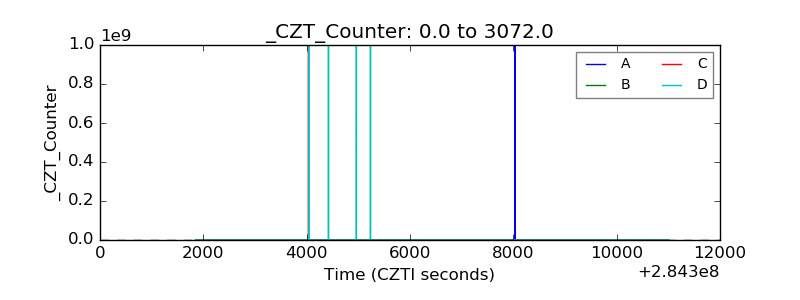 |
| +2.5 Volts monitor |  |
| +5 Volts monitor |  |
| _ROLL_ROT | 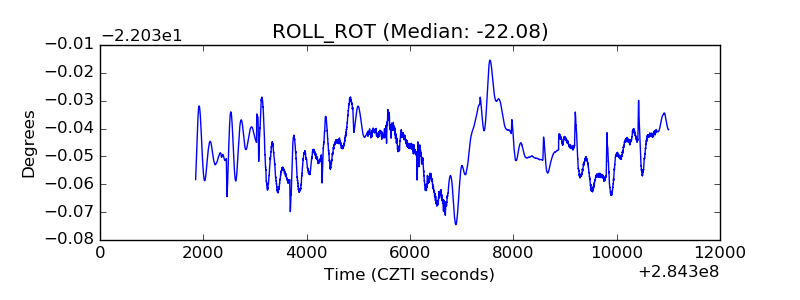 |
| _Roll_DEC | 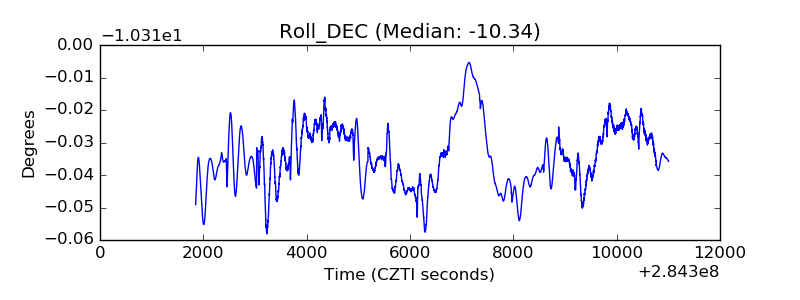 |
| _Roll_RA | 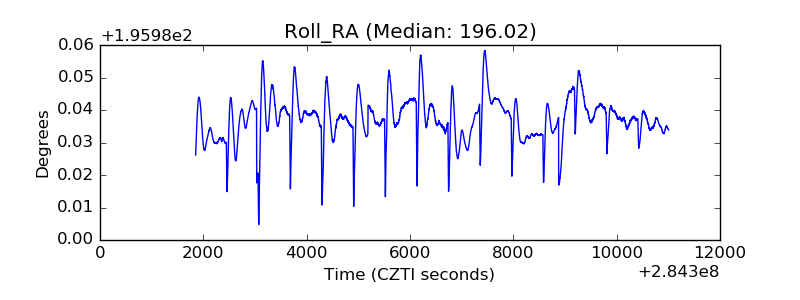 |
| Veto Counter | 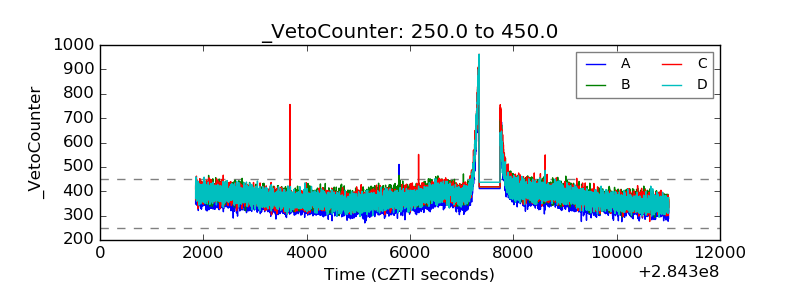 |