| Param | Original file | Final file |
|---|---|---|
| Filename | modeM0/AS1C04_009T02_9000002618_17681cztM0_level2.evt | modeM0/AS1C04_009T02_9000002618_17681cztM0_level2_quad_clean.evt |
| Size (bytes) | 114,042,240 | 28,463,040 |
| Size | 108.8 MB | 27.1 MB |
| Events in quadrant A | 723,155 | 194,454 |
| Events in quadrant B | 941,580 | 194,678 |
| Events in quadrant C | 795,480 | 182,819 |
| Events in quadrant D | 889,859 | 179,358 |
| Mode M0 | |||
|---|---|---|---|
| Quadrant | BADHDUFLAG | Total packets | Discarded packets |
| A | 0 | 3020 | 2 |
| B | 0 | 3754 | 1 |
| C | 0 | 3209 | 1 |
| D | 0 | 3567 | 1 |
| Mode SS | |||
|---|---|---|---|
| Quadrant | BADHDUFLAG | Total packets | Discarded packets |
| A | 0 | 30 | 0 |
| B | 0 | 30 | 0 |
| C | 0 | 30 | 0 |
| D | 0 | 30 | 0 |
| Quadrant | Total seconds | Saturated seconds | Saturation percentage |
|---|---|---|---|
| A | 1484 | 3 | 0.202156% |
| B | 1484 | 38 | 2.560647% |
| C | 1484 | 18 | 1.212938% |
| D | 1484 | 49 | 3.301887% |
Noise dominated data is calculated using 1-second bins in cleaned event files. If a bin has >2000 counts, and if more than 50% of those come from <1% of pixels, then it is considered to be noise-dominated and hence unusable.
| Quadrant | # 1 sec bins | Bins with >0 counts | Bins with >2000 counts | High rate bins dominated by noise | Noise dominated (total time) | Noise dominated (detector-on time) | Marked lightcurve |
|---|---|---|---|---|---|---|---|
| A | 1484 | 1484 | 0 | 0 | 0.00% | 0.00% | 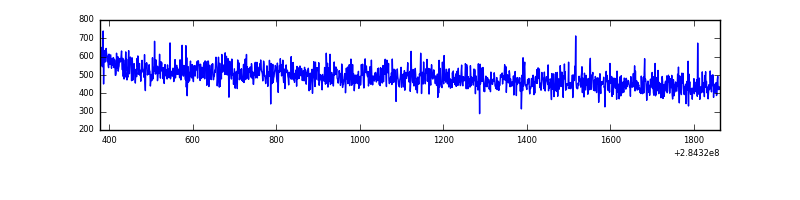 |
| B | 1484 | 1484 | 20 | 20 | 1.35% | 1.35% | 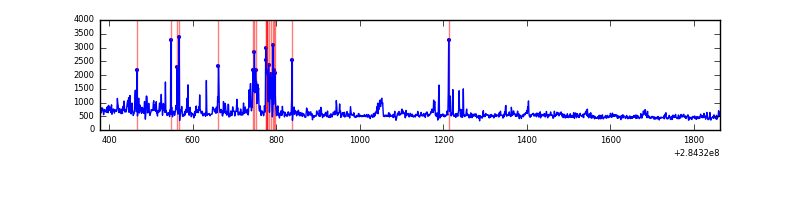 |
| C | 1484 | 1484 | 0 | 0 | 0.00% | 0.00% | 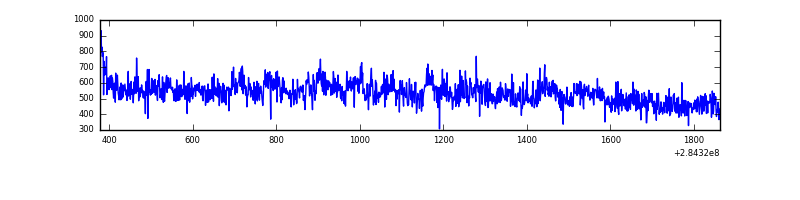 |
| D | 1484 | 1484 | 29 | 29 | 1.95% | 1.95% | 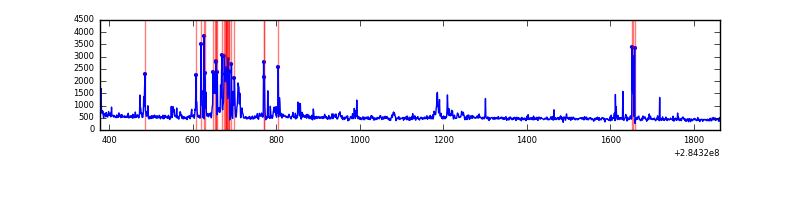 |
Top three noisy pixels from each quadrant. If the there are fewer than three noisy pixels in the level2.evt file, extra rows are filled as -1
| Pixel properties | Quadrant properties | ||||||
|---|---|---|---|---|---|---|---|
| Quadrant | DetID | PixID | Counts | Sigma | Mean | Median | Sigma |
| A | 0 | 226 | 1660 | 36.79 | 187 | 184 | 40.1 |
| A | 12 | 194 | 1459 | 31.78 | 187 | 184 | 40.1 |
| A | 3 | 137 | 1367 | 29.49 | 187 | 184 | 40.1 |
| B | 7 | 220 | 123855 | 3279.96 | 187 | 182 | 37.7 |
| B | 4 | 142 | 22542 | 593.01 | 187 | 182 | 37.7 |
| B | 0 | 198 | 11099 | 289.53 | 187 | 182 | 37.7 |
| C | 3 | 233 | 48141 | 1083.47 | 182 | 182 | 44.3 |
| C | 14 | 238 | 27737 | 622.51 | 182 | 182 | 44.3 |
| C | 5 | 218 | 9154 | 202.69 | 182 | 182 | 44.3 |
| D | 12 | 233 | 103976 | 2261.42 | 184 | 178 | 45.9 |
| D | 5 | 32 | 29629 | 641.64 | 184 | 178 | 45.9 |
| D | 10 | 70 | 17985 | 387.96 | 184 | 178 | 45.9 |
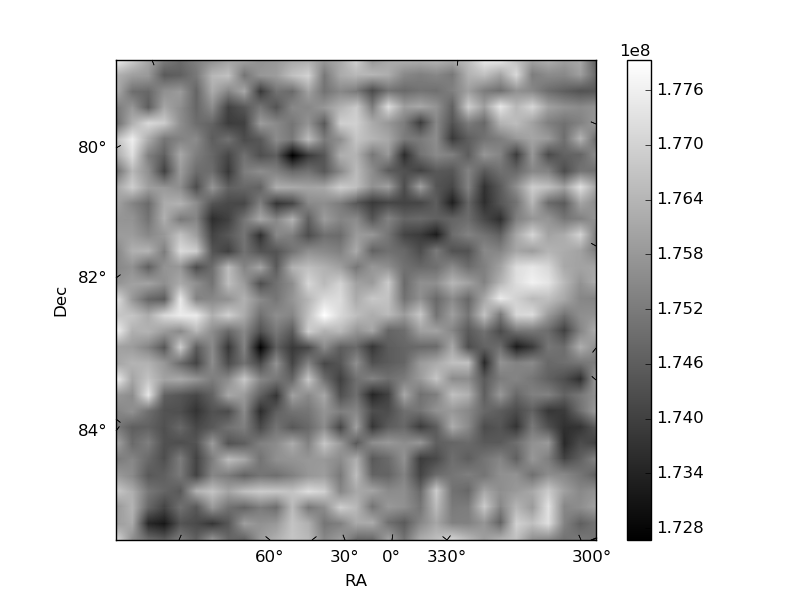
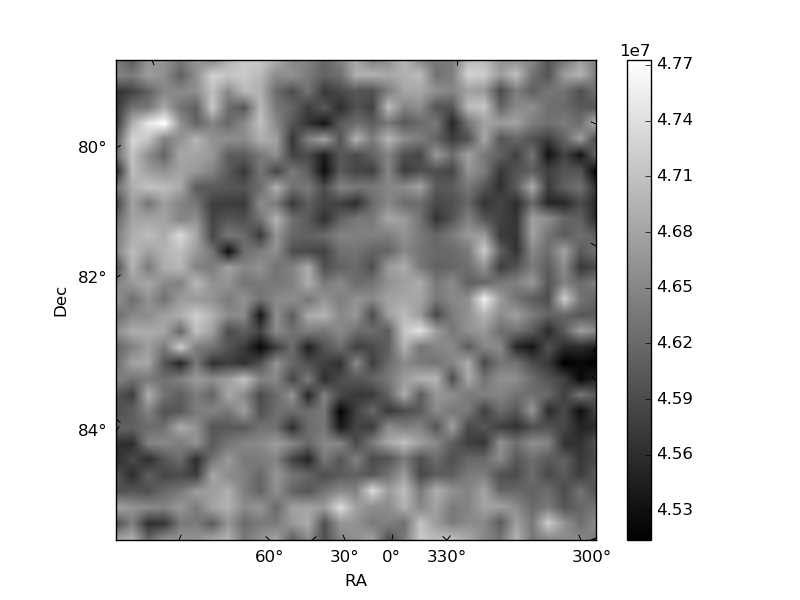
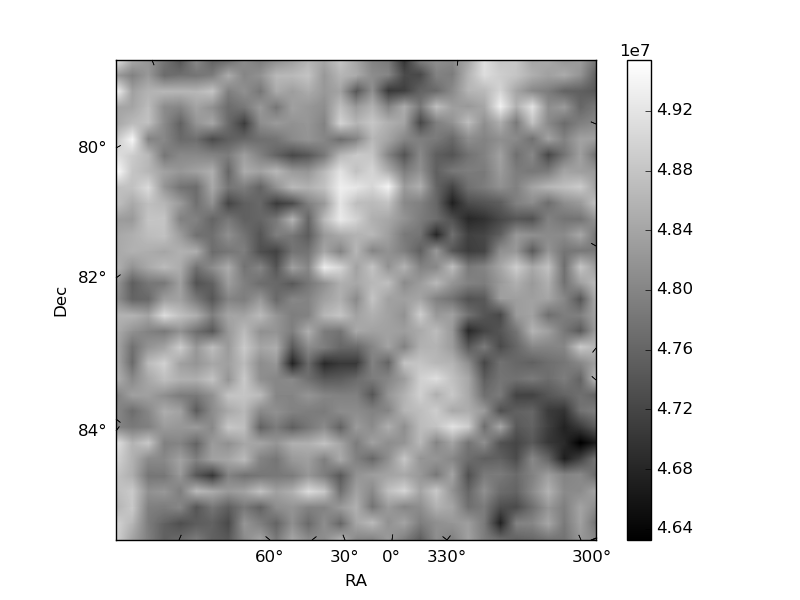
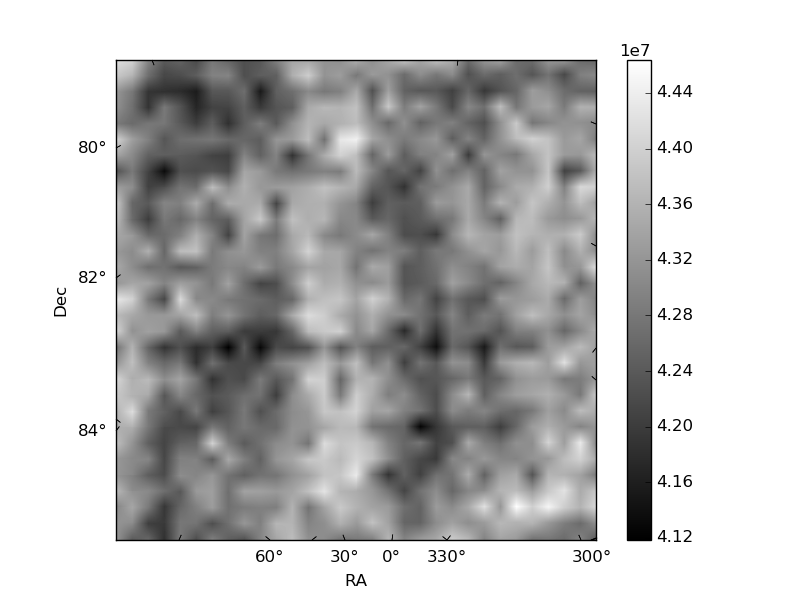
Histogram calculated using DETX and DETY for each event in the final _common_clean file
| Quadrant A | 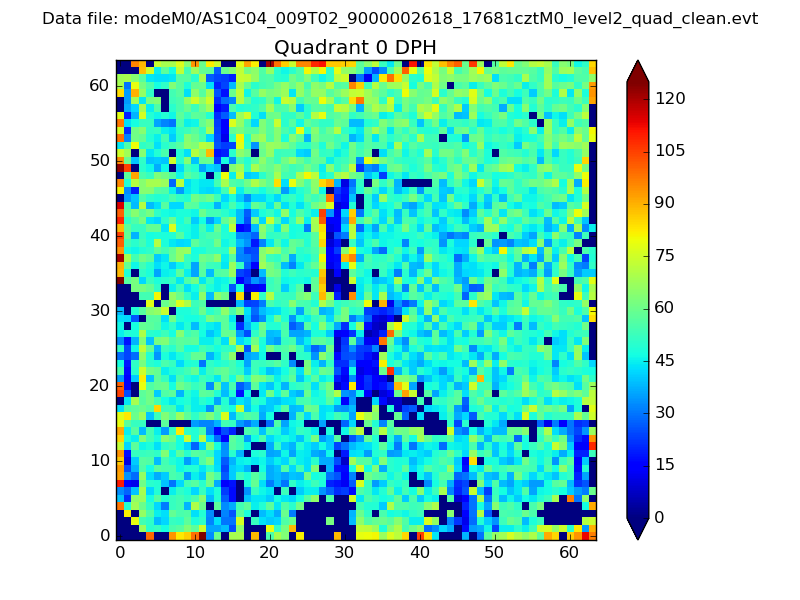 |
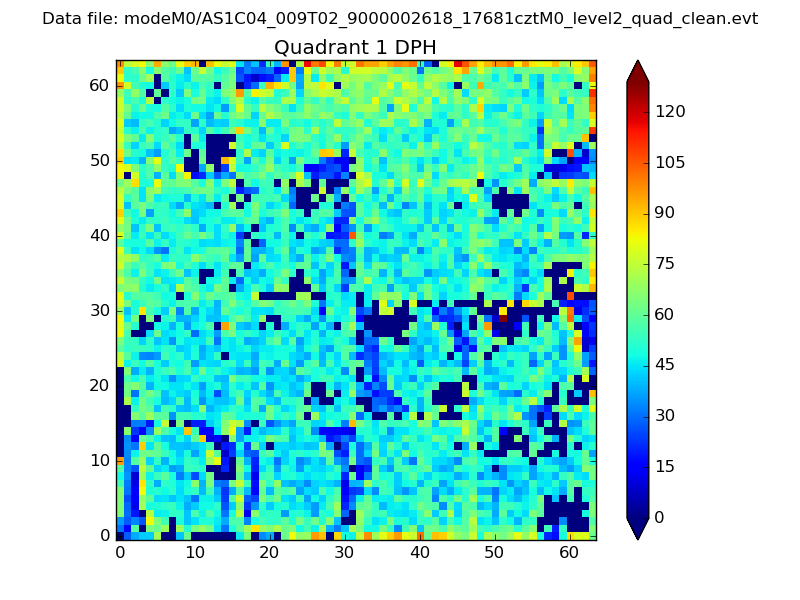 |
Quadrant B |
|---|---|---|---|
| Quadrant D | 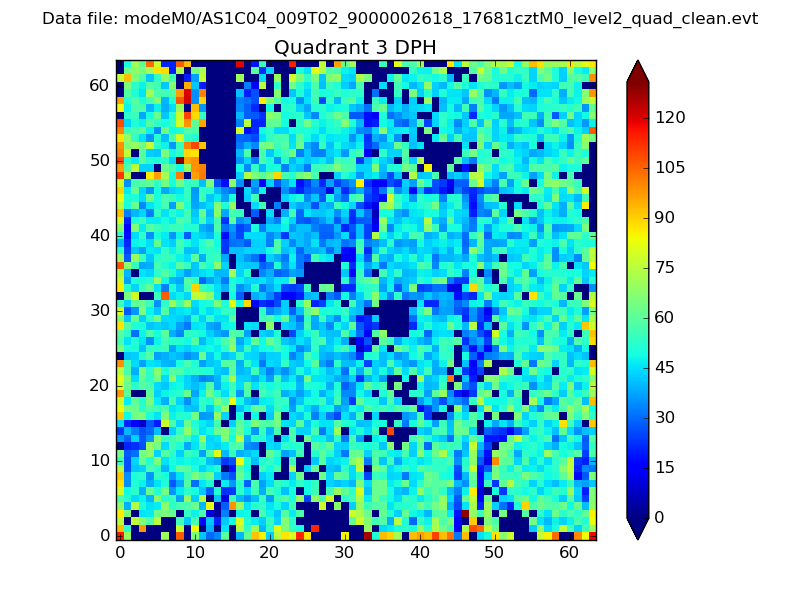 |
 |
Quadrant C |
| Plot type | Count rate plots | Images |
|---|---|---|
| Comparison with Poisson distribution Blue bars denote a histogram of data divided into 1 sec bins. Red curve is a Poisson curve with rate = median count rate of data. |
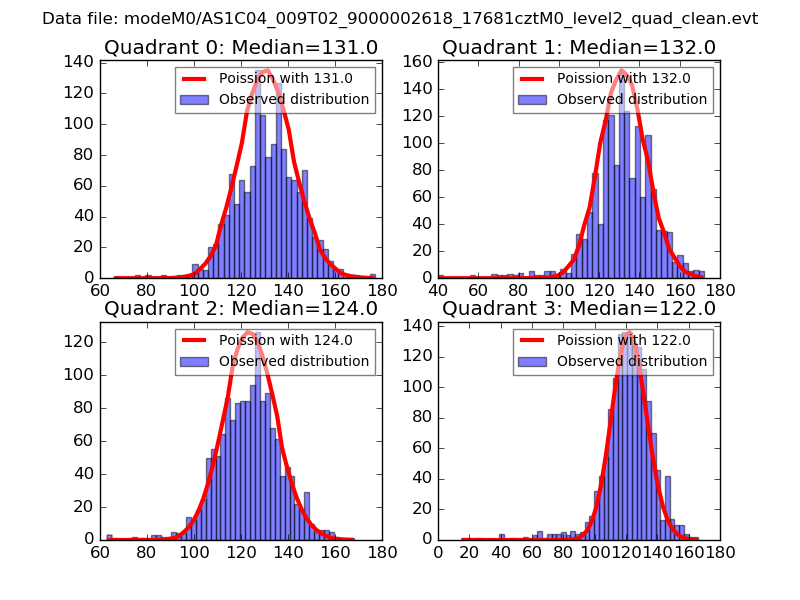 |
 |
| Quadrant-wise count rates Data is divided into 100 sec bins |
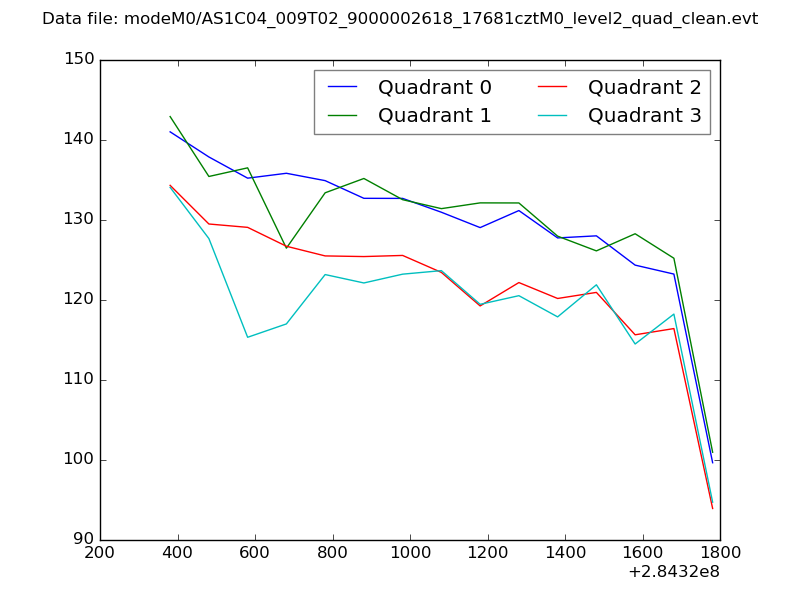 |
|
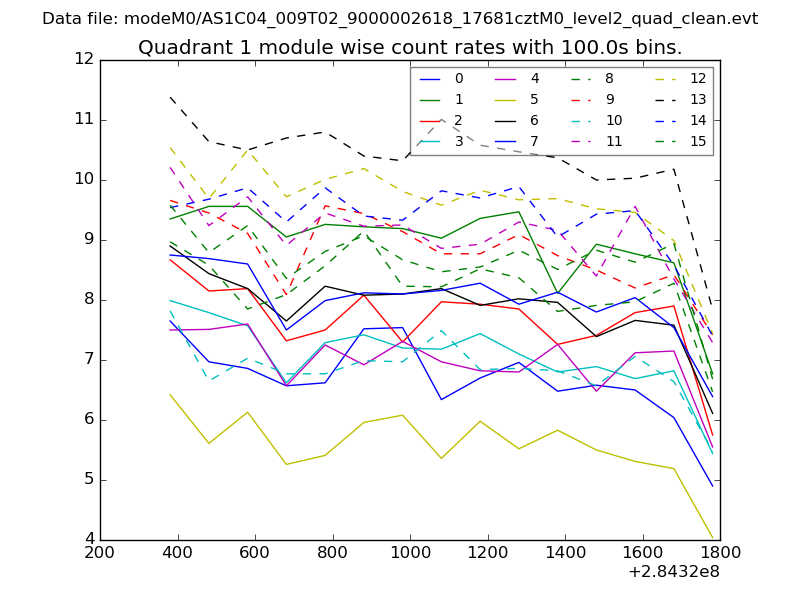
| Module-wise count rates for Quadrant A Data is divided into 100 sec bins |
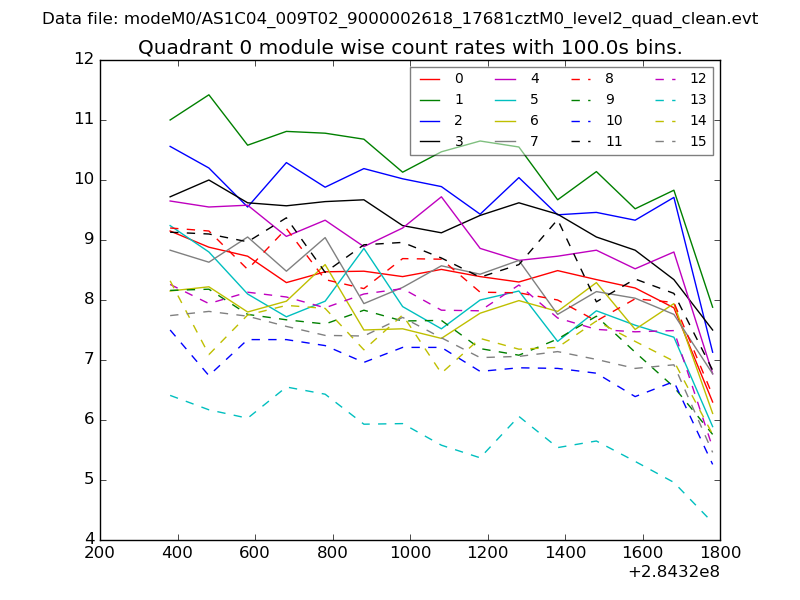 |
 |
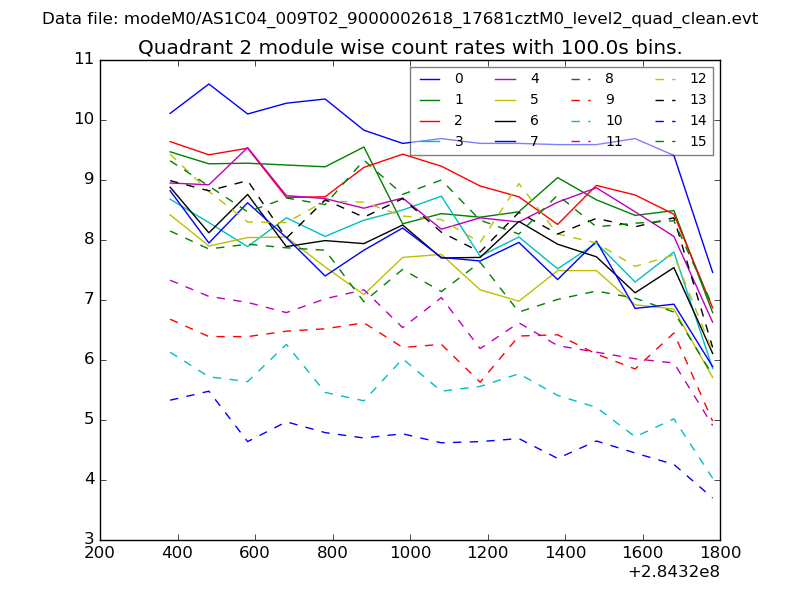
| Module-wise count rates for Quadrant B Data is divided into 100 sec bins |
 |
 |
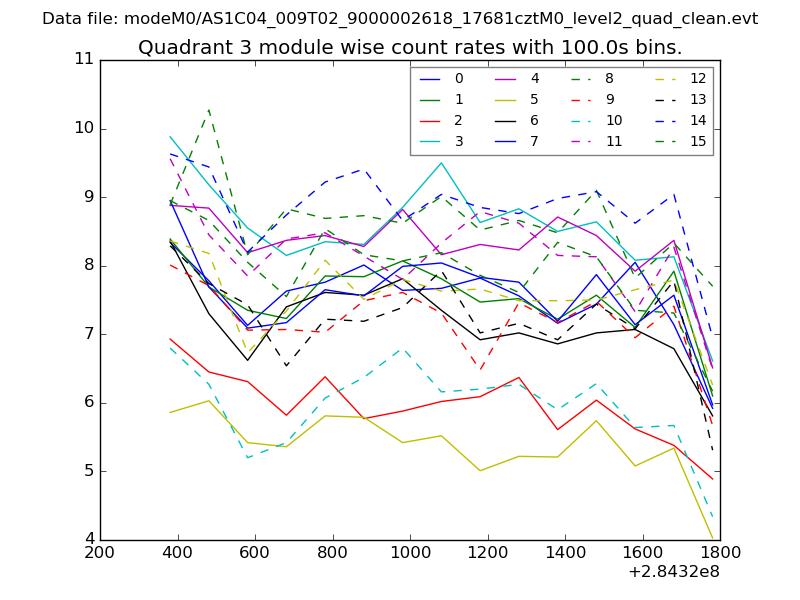
| Module-wise count rates for Quadrant C Data is divided into 100 sec bins |
 |
 |
| Module-wise count rates for Quadrant D Data is divided into 100 sec bins |
 |
 |
| Parameter | Plot |
|---|---|
| CZT HV Monitor | 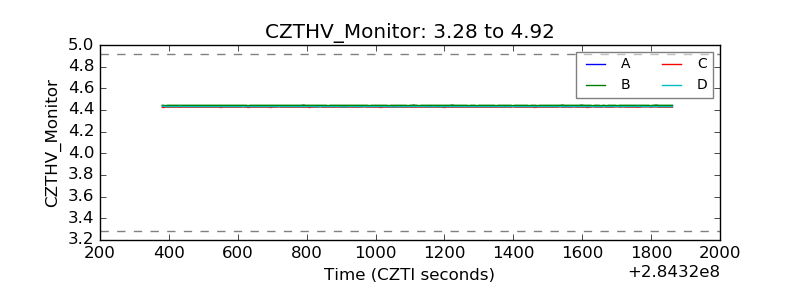 |
| D_VDD |  |
| Temperature 1 | 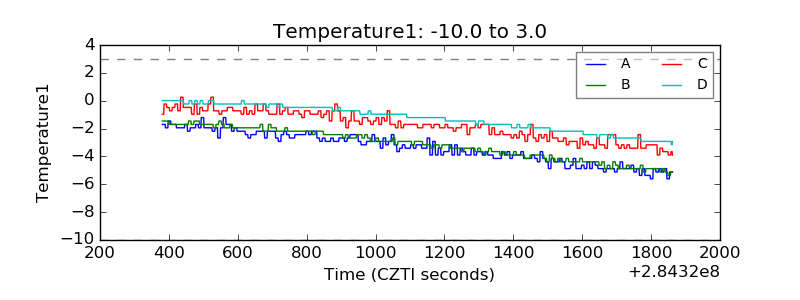 |
| Veto HV Monitor | 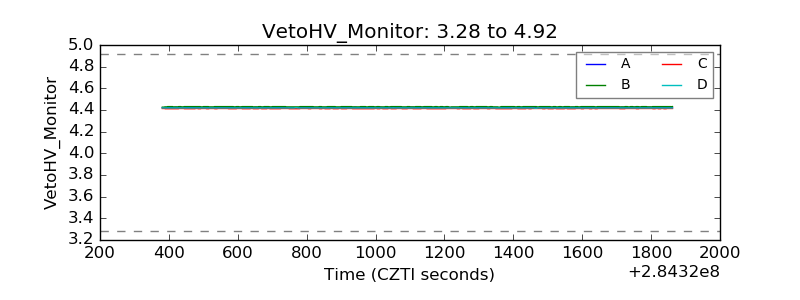 |
| Veto LLD | 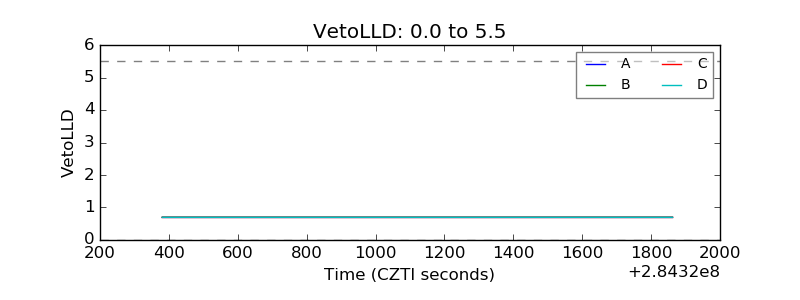 |
| Alpha Counter | 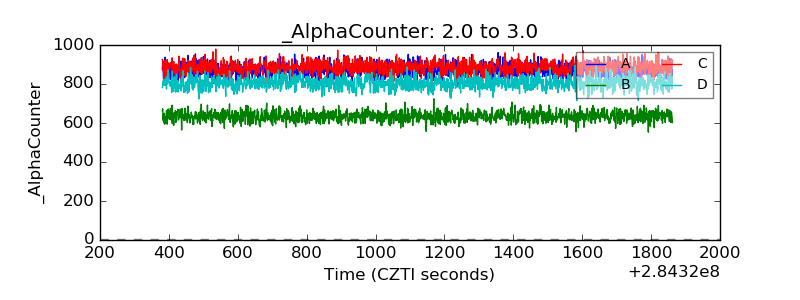 |
| _CPM_Rate | 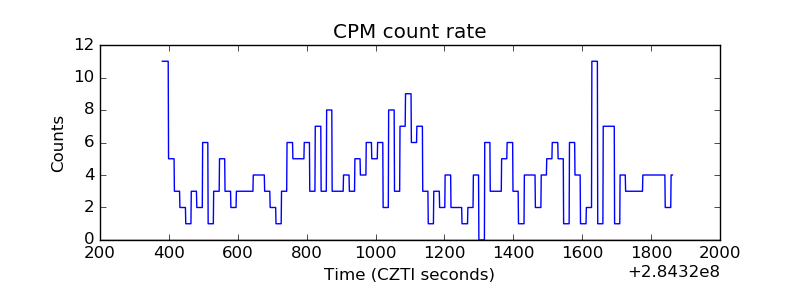 |
| CZT Counter |  |
| +2.5 Volts monitor |  |
| +5 Volts monitor | 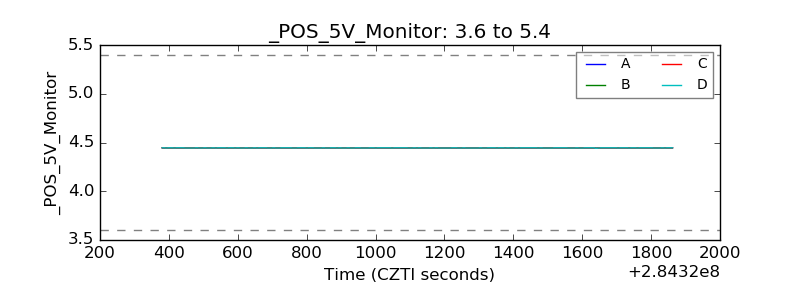 |
| _ROLL_ROT | 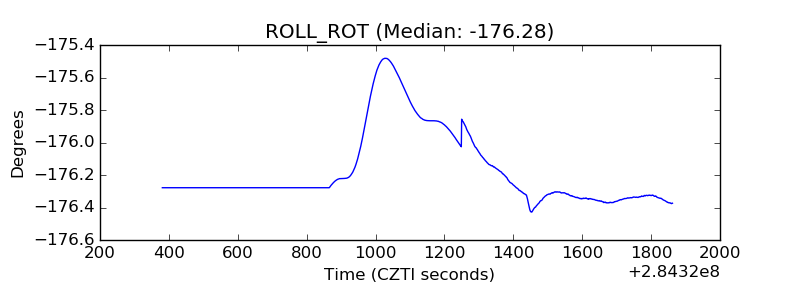 |
| _Roll_DEC | 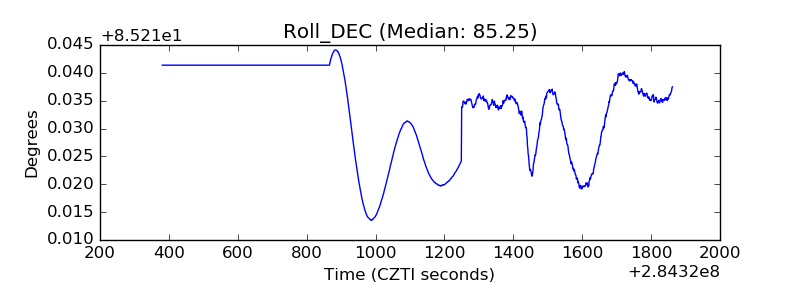 |
| _Roll_RA | 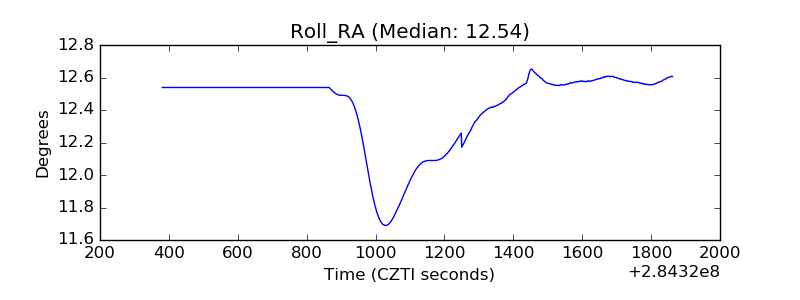 |
| Veto Counter | 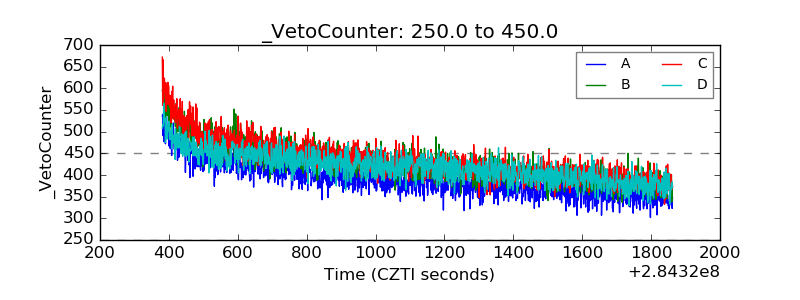 |