| Param | Original file | Final file |
|---|---|---|
| Filename | modeM0/AS1C04_009T02_9000002618_17682cztM0_level2.evt | modeM0/AS1C04_009T02_9000002618_17682cztM0_level2_quad_clean.evt |
| Size (bytes) | 450,613,440 | 123,863,040 |
| Size | 429.7 MB | 118.1 MB |
| Events in quadrant A | 3,016,407 | 839,130 |
| Events in quadrant B | 3,559,932 | 843,722 |
| Events in quadrant C | 3,196,191 | 807,153 |
| Events in quadrant D | 3,420,646 | 796,231 |
| Mode M0 | |||
|---|---|---|---|
| Quadrant | BADHDUFLAG | Total packets | Discarded packets |
| A | 0 | 13535 | 0 |
| B | 0 | 15194 | 0 |
| C | 0 | 13879 | 0 |
| D | 0 | 14836 | 0 |
| Mode M9 | |||
|---|---|---|---|
| Quadrant | BADHDUFLAG | Total packets | Discarded packets |
| A | 0 | 9 | 0 |
| B | 0 | 9 | 0 |
| C | 0 | 9 | 0 |
| D | 0 | 9 | 0 |
| Mode SS | |||
|---|---|---|---|
| Quadrant | BADHDUFLAG | Total packets | Discarded packets |
| A | 0 | 138 | 0 |
| B | 0 | 138 | 0 |
| C | 0 | 138 | 0 |
| D | 0 | 137 | 0 |
| Quadrant | Total seconds | Saturated seconds | Saturation percentage |
|---|---|---|---|
| A | 6670 | 11 | 0.164918% |
| B | 6670 | 62 | 0.929535% |
| C | 6670 | 61 | 0.914543% |
| D | 6670 | 69 | 1.034483% |
Noise dominated data is calculated using 1-second bins in cleaned event files. If a bin has >2000 counts, and if more than 50% of those come from <1% of pixels, then it is considered to be noise-dominated and hence unusable.
| Quadrant | # 1 sec bins | Bins with >0 counts | Bins with >2000 counts | High rate bins dominated by noise | Noise dominated (total time) | Noise dominated (detector-on time) | Marked lightcurve |
|---|---|---|---|---|---|---|---|
| A | 7610 | 6671 | 0 | 0 | 0.00% | 0.00% | 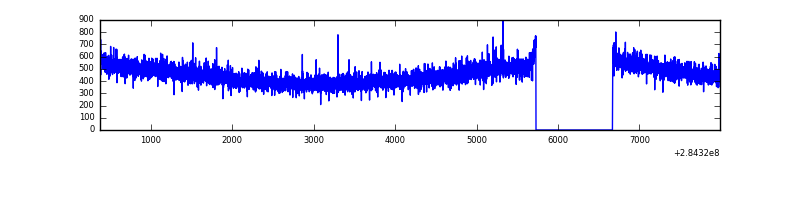 |
| B | 7610 | 6671 | 28 | 28 | 0.37% | 0.42% | 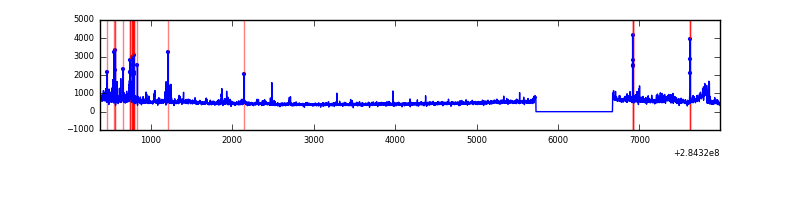 |
| C | 7610 | 6671 | 0 | 0 | 0.00% | 0.00% | 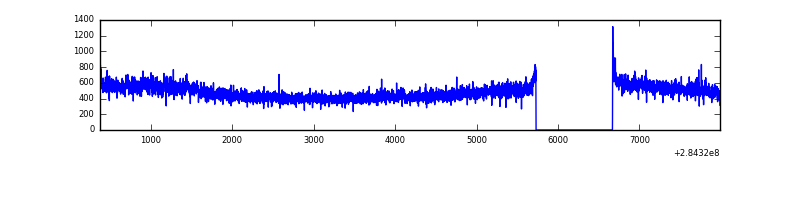 |
| D | 7610 | 6671 | 34 | 34 | 0.45% | 0.51% | 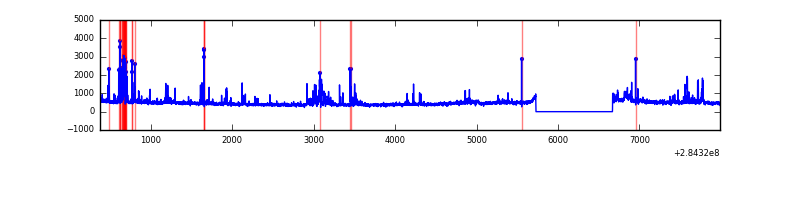 |
Top three noisy pixels from each quadrant. If the there are fewer than three noisy pixels in the level2.evt file, extra rows are filled as -1
| Pixel properties | Quadrant properties | ||||||
|---|---|---|---|---|---|---|---|
| Quadrant | DetID | PixID | Counts | Sigma | Mean | Median | Sigma |
| A | 0 | 226 | 6716 | 37.33 | 784 | 766 | 159.4 |
| A | 3 | 137 | 5874 | 32.05 | 784 | 766 | 159.4 |
| A | 12 | 194 | 5808 | 31.64 | 784 | 766 | 159.4 |
| B | 7 | 220 | 162921 | 1080.08 | 785 | 764 | 150.1 |
| B | 10 | 245 | 114332 | 756.44 | 785 | 764 | 150.1 |
| B | 0 | 189 | 64228 | 422.72 | 785 | 764 | 150.1 |
| C | 14 | 238 | 116988 | 660.37 | 756 | 760 | 176.0 |
| C | 3 | 233 | 94218 | 530.99 | 756 | 760 | 176.0 |
| C | 5 | 218 | 36470 | 202.89 | 756 | 760 | 176.0 |
| D | 12 | 233 | 128895 | 697.02 | 765 | 743 | 183.9 |
| D | 1 | 52 | 122887 | 664.34 | 765 | 743 | 183.9 |
| D | 7 | 238 | 105912 | 572.01 | 765 | 743 | 183.9 |
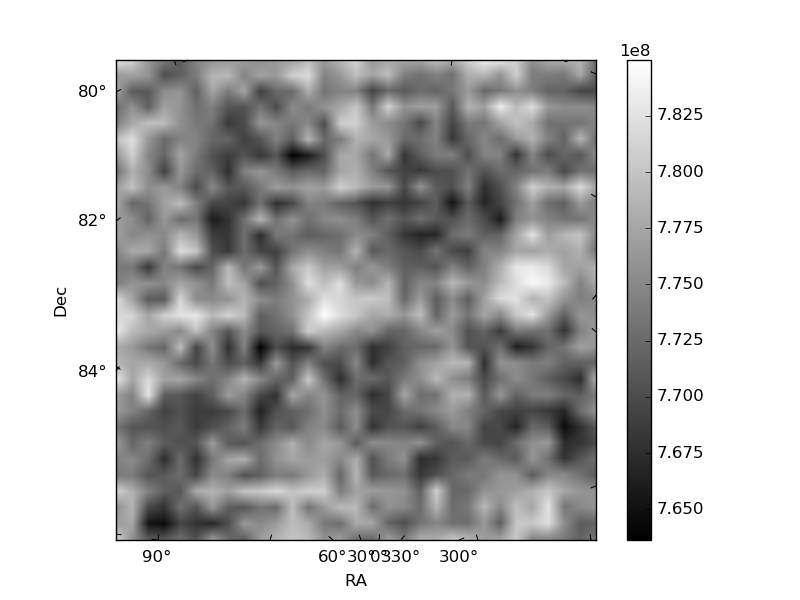
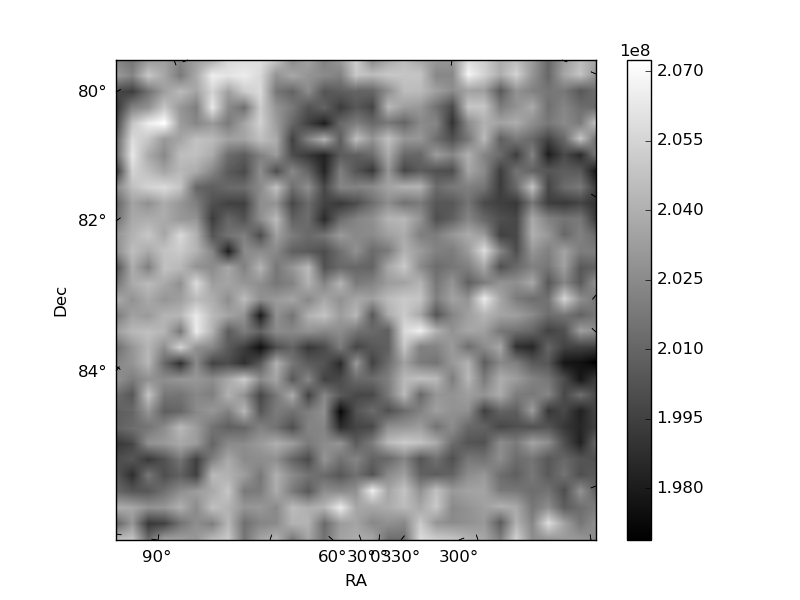
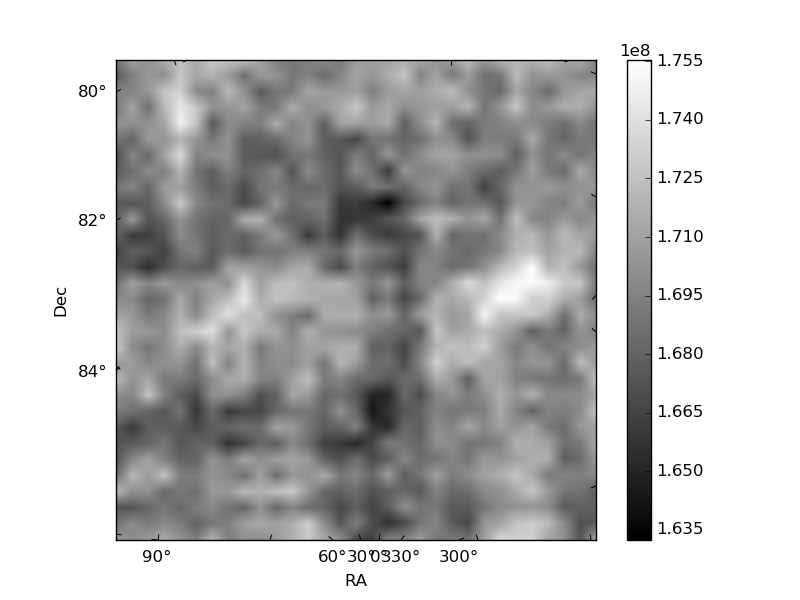
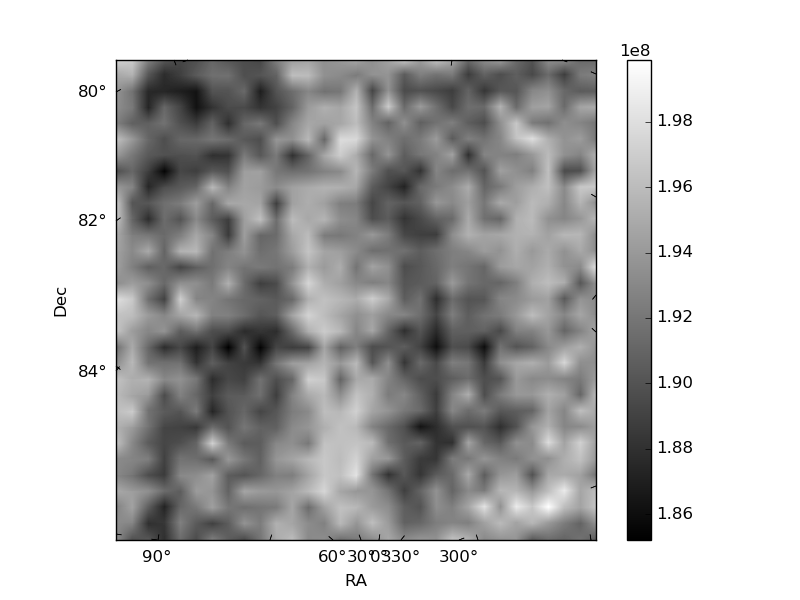
Histogram calculated using DETX and DETY for each event in the final _common_clean file
| Quadrant A | 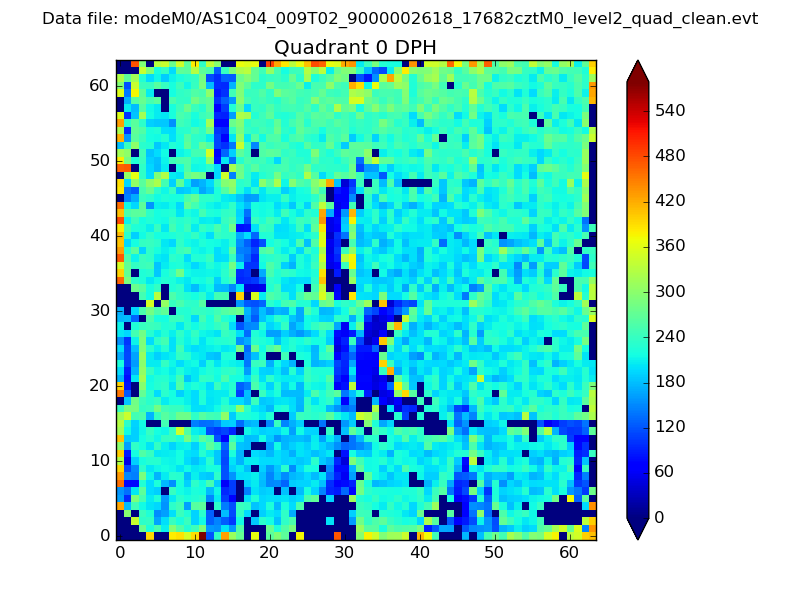 |
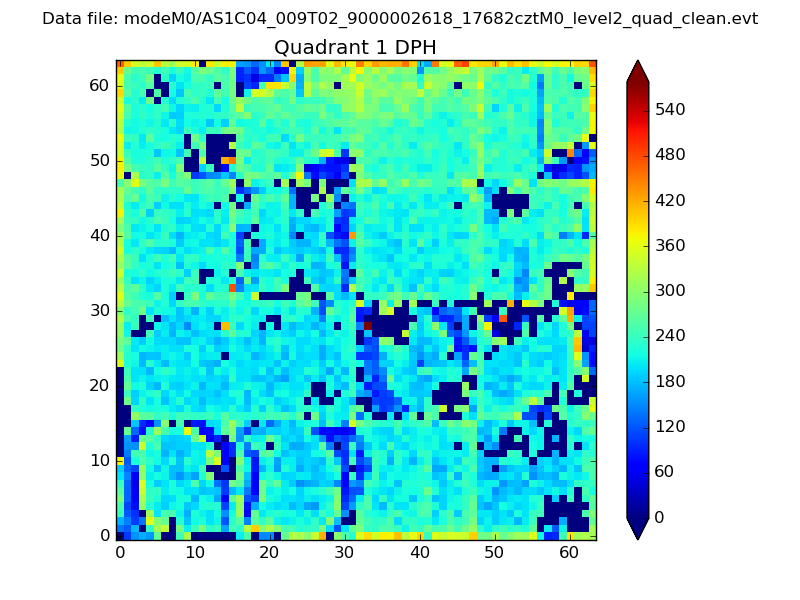 |
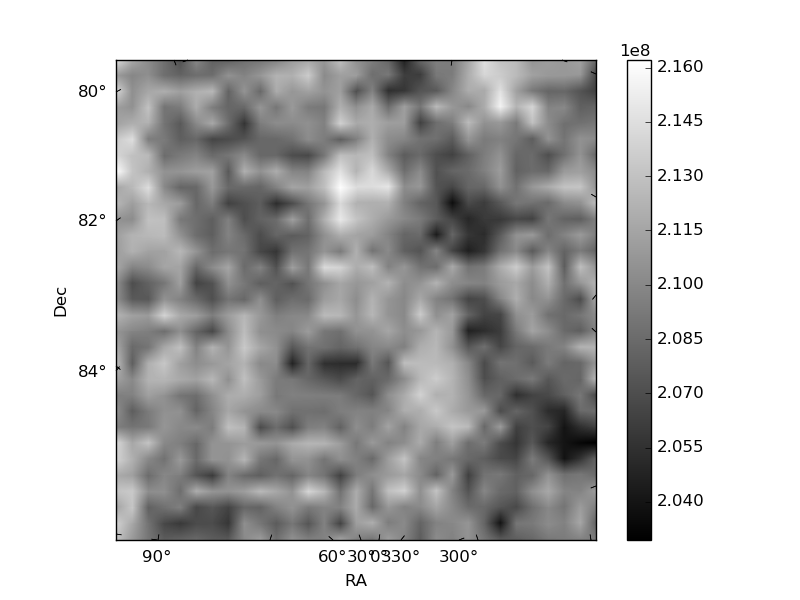
Quadrant B |
|---|---|---|---|
| Quadrant D | 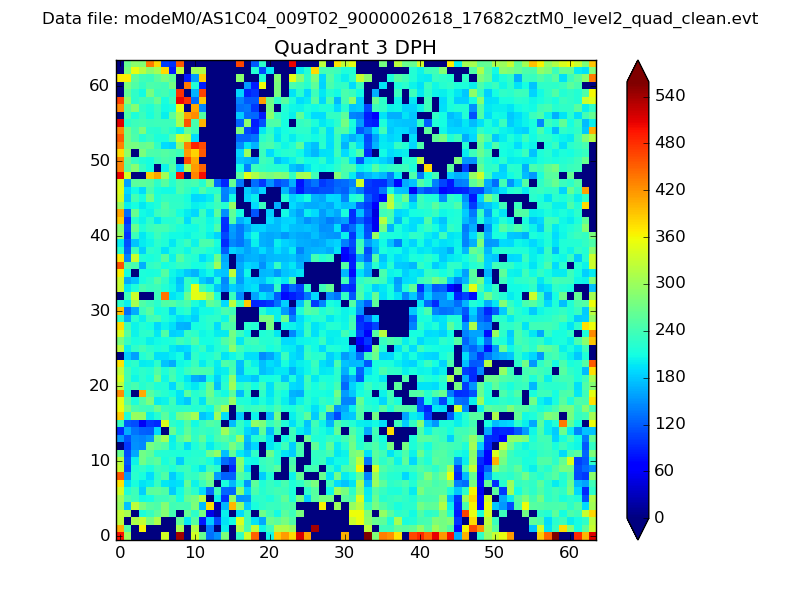 |
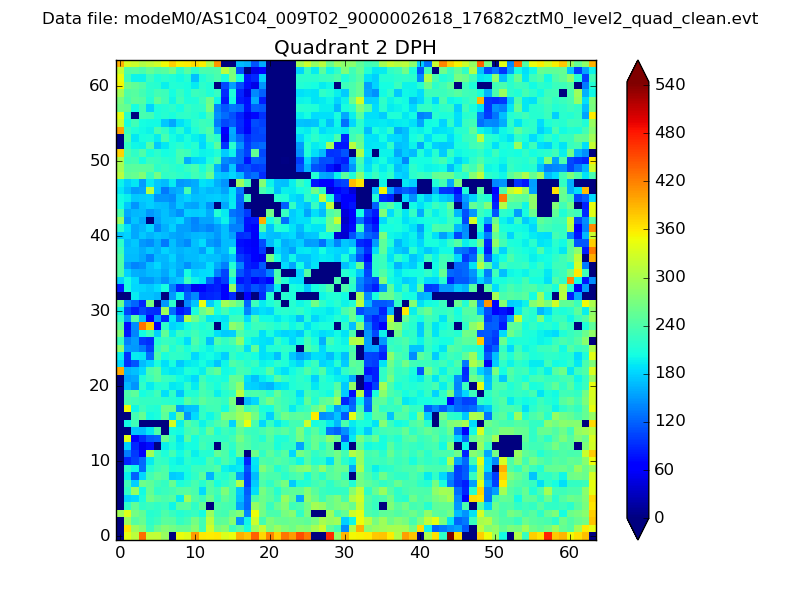 |
Quadrant C |
| Plot type | Count rate plots | Images |
|---|---|---|
| Comparison with Poisson distribution Blue bars denote a histogram of data divided into 1 sec bins. Red curve is a Poisson curve with rate = median count rate of data. |
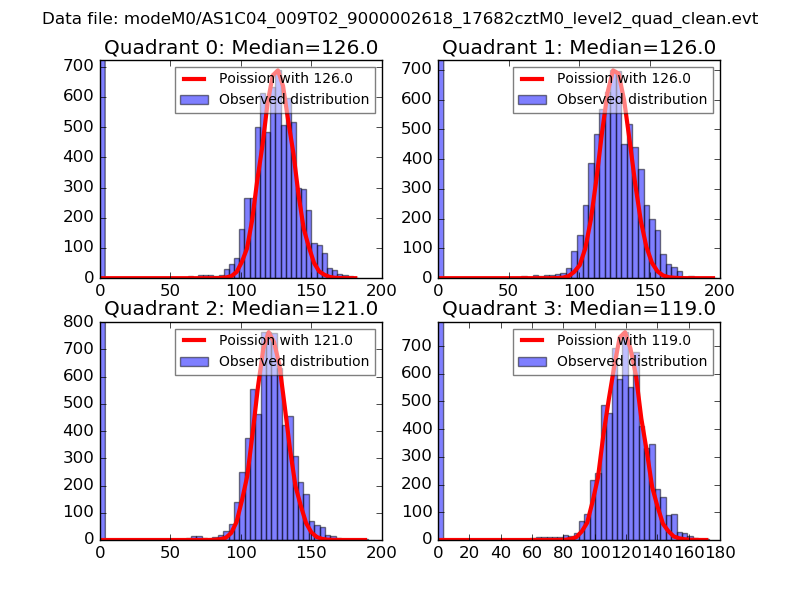 |
 |
| Quadrant-wise count rates Data is divided into 100 sec bins |
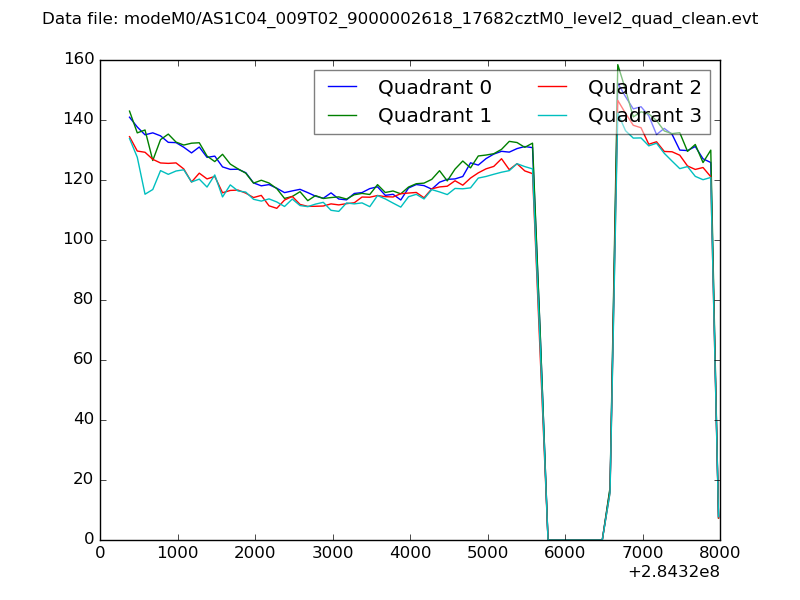 |
|
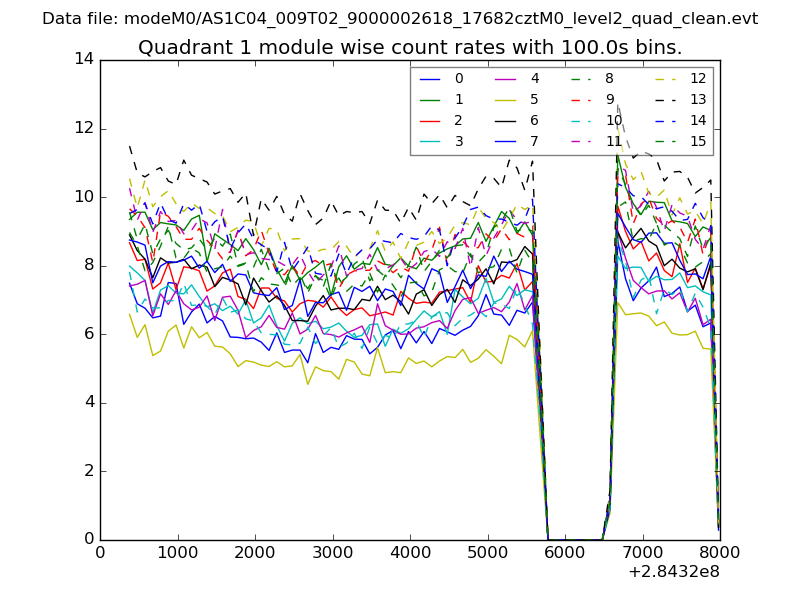
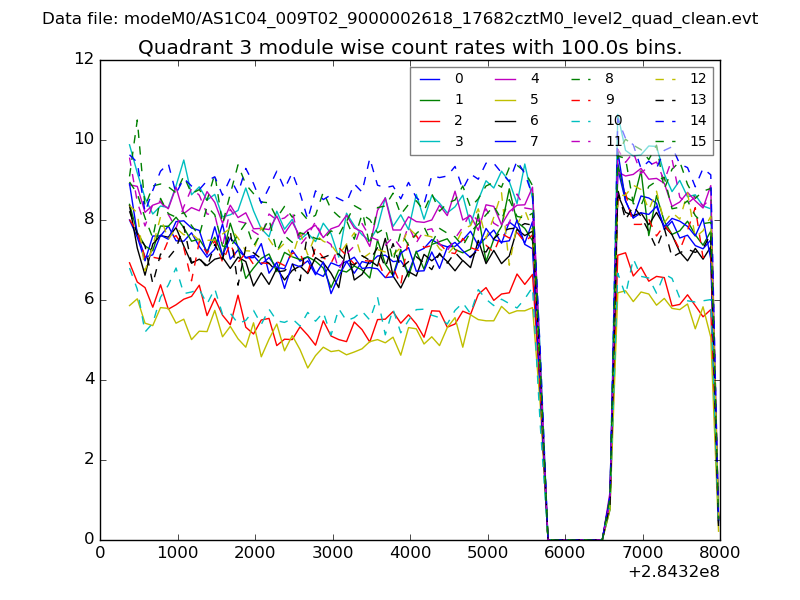
| Module-wise count rates for Quadrant A Data is divided into 100 sec bins |
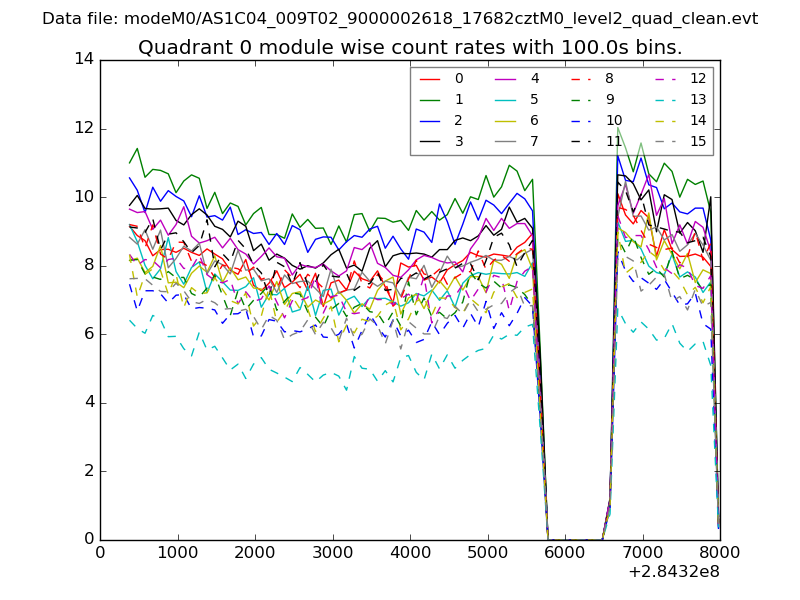 |
 |
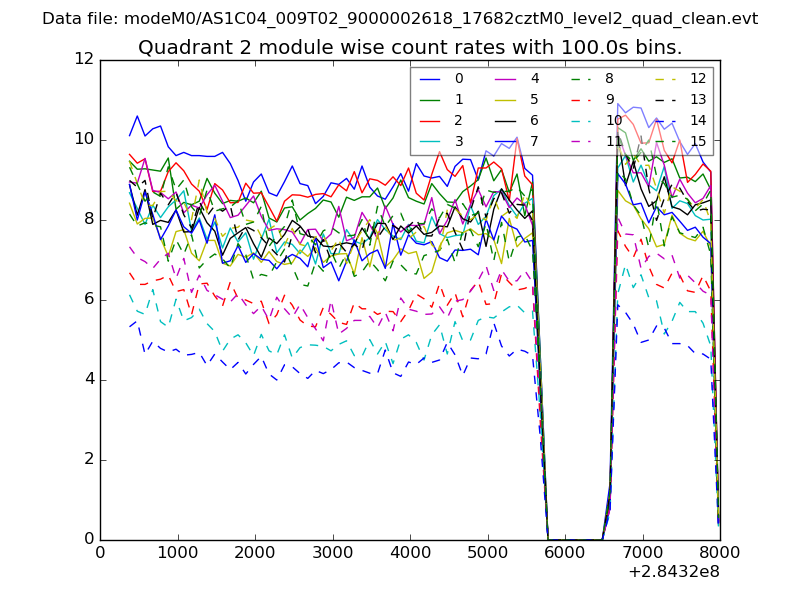
| Module-wise count rates for Quadrant B Data is divided into 100 sec bins |
 |
 |
| Module-wise count rates for Quadrant C Data is divided into 100 sec bins |
 |
 |
| Module-wise count rates for Quadrant D Data is divided into 100 sec bins |
 |
 |
| Parameter | Plot |
|---|---|
| CZT HV Monitor | 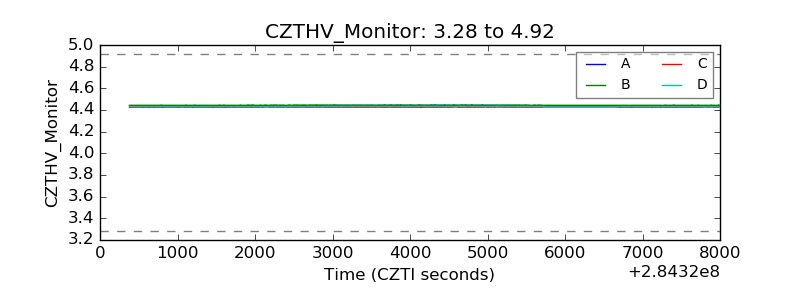 |
| D_VDD | 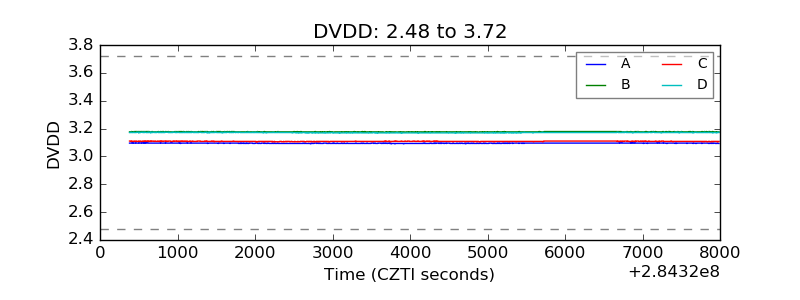 |
| Temperature 1 | 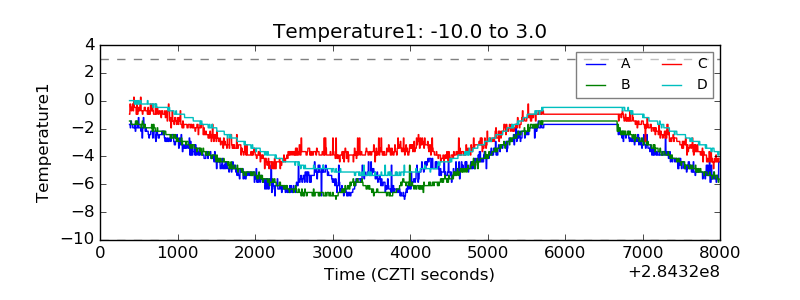 |
| Veto HV Monitor | 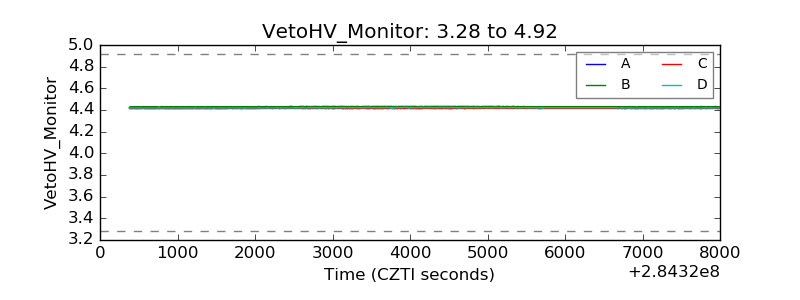 |
| Veto LLD | 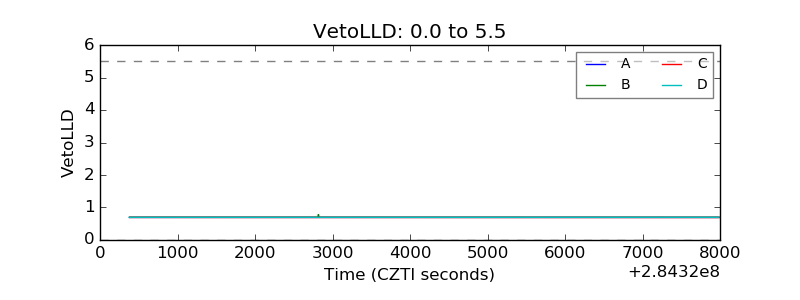 |
| Alpha Counter | 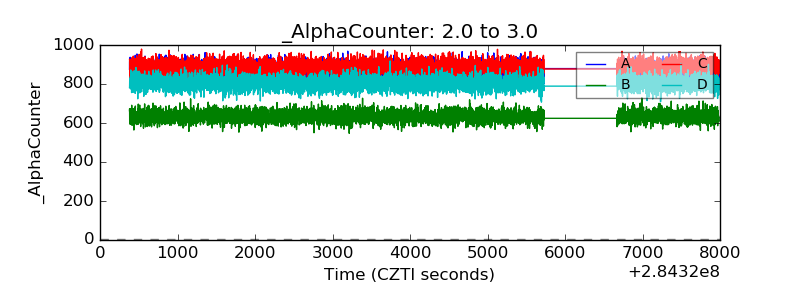 |
| _CPM_Rate | 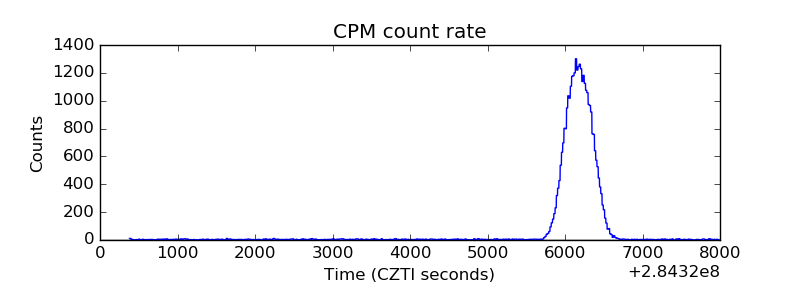 |
| CZT Counter | 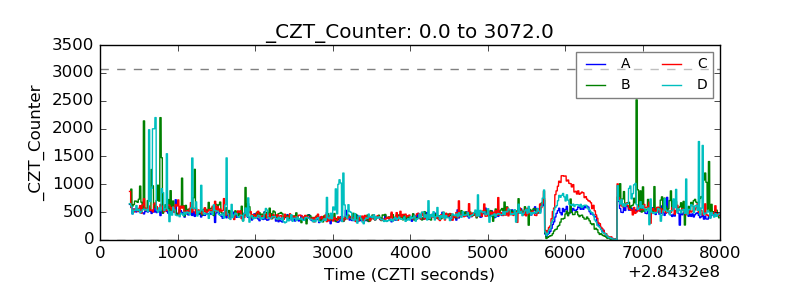 |
| +2.5 Volts monitor |  |
| +5 Volts monitor |  |
| _ROLL_ROT | 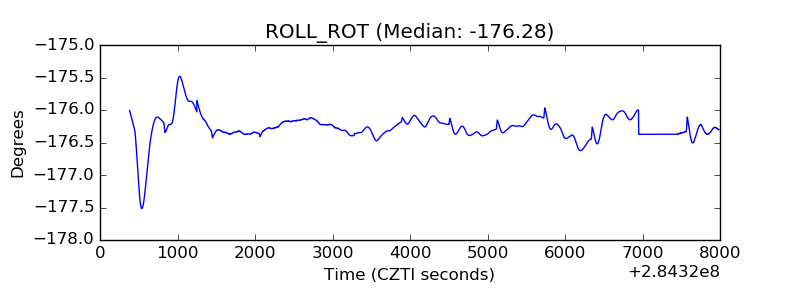 |
| _Roll_DEC | 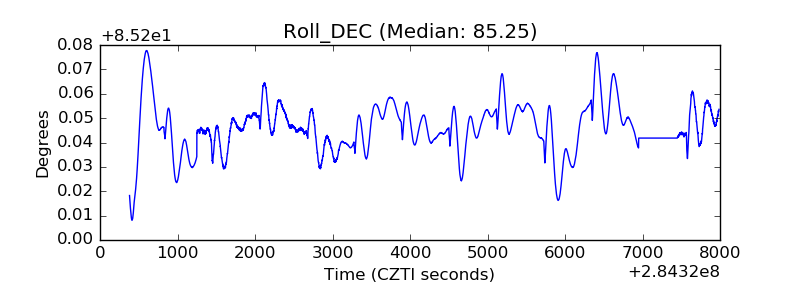 |
| _Roll_RA | 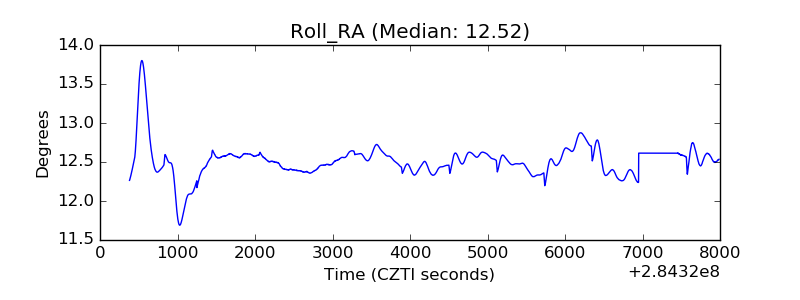 |
| Veto Counter | 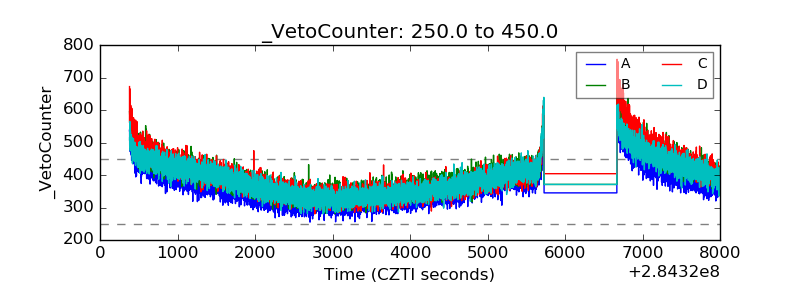 |