| Param | Original file | Final file |
|---|---|---|
| Filename | modeM0/AS1C04_009T02_9000002618_17683cztM0_level2.evt | modeM0/AS1C04_009T02_9000002618_17683cztM0_level2_quad_clean.evt |
| Size (bytes) | 338,388,480 | 96,719,040 |
| Size | 322.7 MB | 92.2 MB |
| Events in quadrant A | 2,301,083 | 648,201 |
| Events in quadrant B | 2,724,933 | 658,330 |
| Events in quadrant C | 2,446,154 | 632,253 |
| Events in quadrant D | 2,421,233 | 625,855 |
| Mode M0 | |||
|---|---|---|---|
| Quadrant | BADHDUFLAG | Total packets | Discarded packets |
| A | 0 | 10552 | 1 |
| B | 0 | 11858 | 7 |
| C | 0 | 10712 | 1 |
| D | 0 | 11050 | 1 |
| Mode M9 | |||
|---|---|---|---|
| Quadrant | BADHDUFLAG | Total packets | Discarded packets |
| A | 0 | 4 | 0 |
| B | 0 | 5 | 0 |
| C | 0 | 5 | 0 |
| D | 0 | 5 | 0 |
| Mode SS | |||
|---|---|---|---|
| Quadrant | BADHDUFLAG | Total packets | Discarded packets |
| A | 0 | 106 | 0 |
| B | 0 | 106 | 0 |
| C | 0 | 106 | 0 |
| D | 0 | 106 | 0 |
| Quadrant | Total seconds | Saturated seconds | Saturation percentage |
|---|---|---|---|
| A | 5205 | 12 | 0.230548% |
| B | 5202 | 34 | 0.653595% |
| C | 5205 | 45 | 0.864553% |
| D | 5205 | 16 | 0.307397% |
Noise dominated data is calculated using 1-second bins in cleaned event files. If a bin has >2000 counts, and if more than 50% of those come from <1% of pixels, then it is considered to be noise-dominated and hence unusable.
| Quadrant | # 1 sec bins | Bins with >0 counts | Bins with >2000 counts | High rate bins dominated by noise | Noise dominated (total time) | Noise dominated (detector-on time) | Marked lightcurve |
|---|---|---|---|---|---|---|---|
| A | 5205 | 5205 | 0 | 0 | 0.00% | 0.00% | 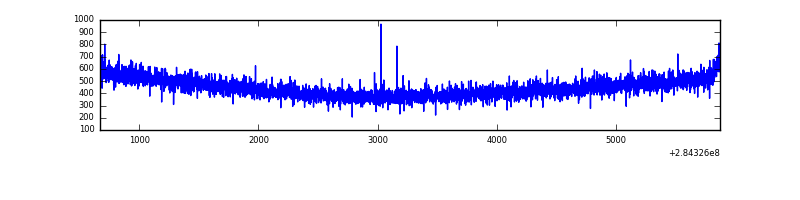 |
| B | 5205 | 5205 | 7 | 7 | 0.13% | 0.13% | 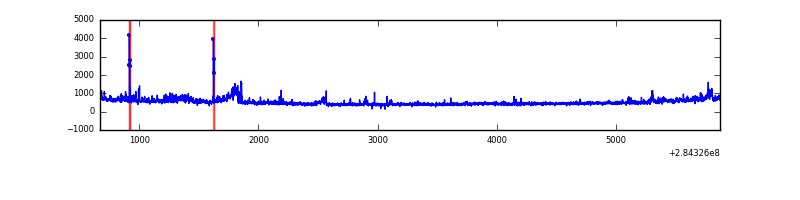 |
| C | 5205 | 5205 | 0 | 0 | 0.00% | 0.00% | 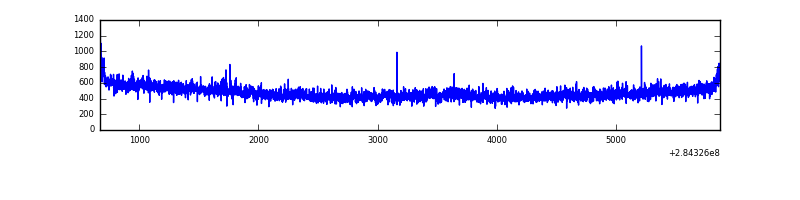 |
| D | 5205 | 5205 | 5 | 5 | 0.10% | 0.10% | 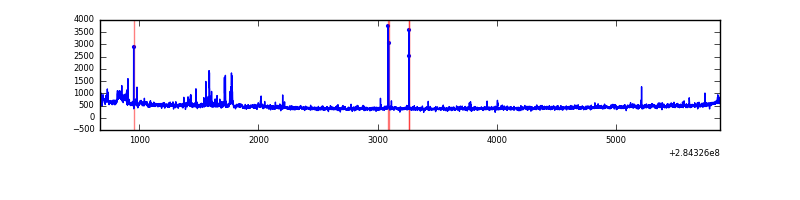 |
Top three noisy pixels from each quadrant. If the there are fewer than three noisy pixels in the level2.evt file, extra rows are filled as -1
| Pixel properties | Quadrant properties | ||||||
|---|---|---|---|---|---|---|---|
| Quadrant | DetID | PixID | Counts | Sigma | Mean | Median | Sigma |
| A | 0 | 226 | 5092 | 37.1 | 598 | 584 | 121.5 |
| A | 3 | 137 | 4429 | 31.64 | 598 | 584 | 121.5 |
| A | 12 | 194 | 4427 | 31.62 | 598 | 584 | 121.5 |
| B | 10 | 245 | 170492 | 1472.57 | 600 | 582 | 115.4 |
| B | 0 | 189 | 90281 | 777.4 | 600 | 582 | 115.4 |
| B | 7 | 220 | 39040 | 333.31 | 600 | 582 | 115.4 |
| C | 3 | 233 | 101131 | 747.96 | 577 | 580 | 134.4 |
| C | 14 | 238 | 89675 | 662.74 | 577 | 580 | 134.4 |
| C | 5 | 218 | 5059 | 33.32 | 577 | 580 | 134.4 |
| D | 1 | 52 | 90141 | 632.58 | 582 | 564 | 141.6 |
| D | 10 | 70 | 30386 | 210.6 | 582 | 564 | 141.6 |
| D | 11 | 241 | 27304 | 188.83 | 582 | 564 | 141.6 |
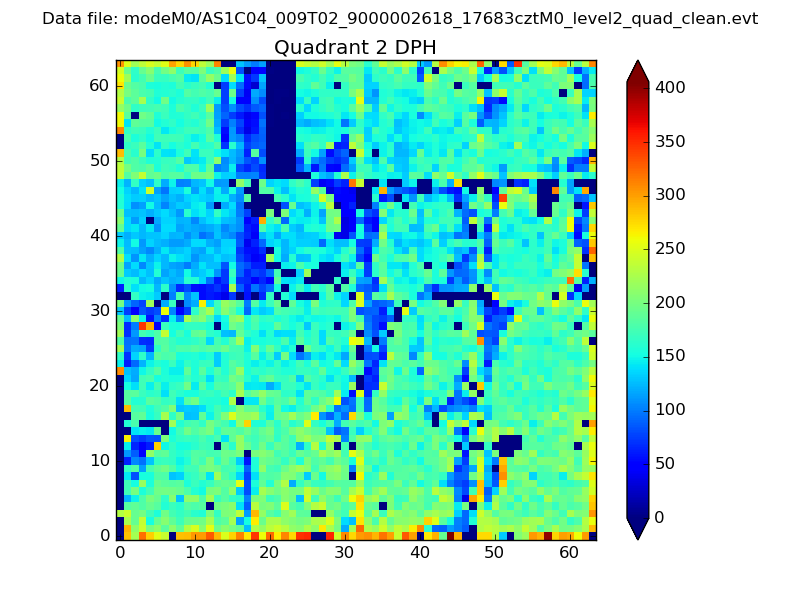
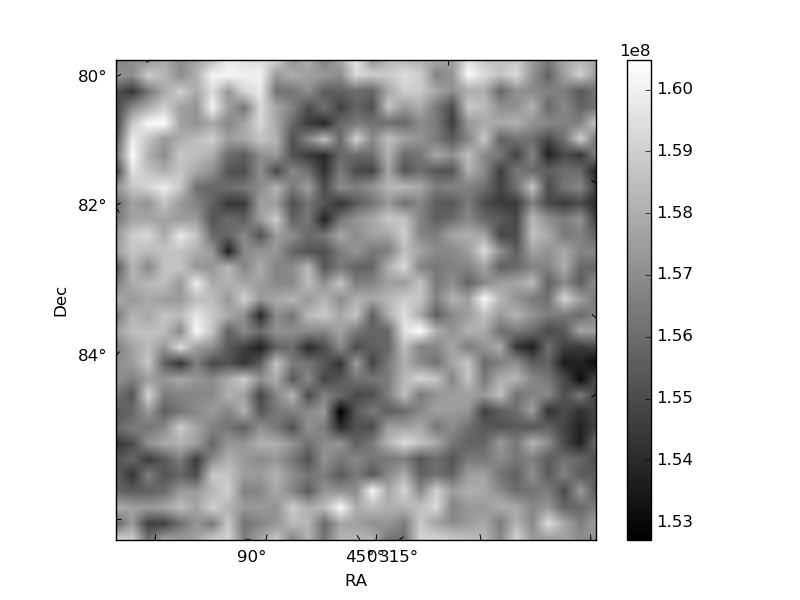
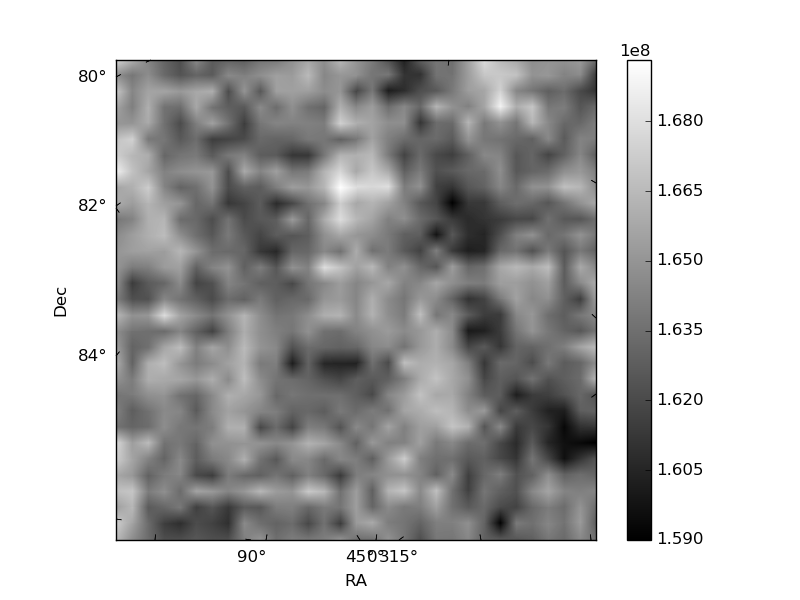
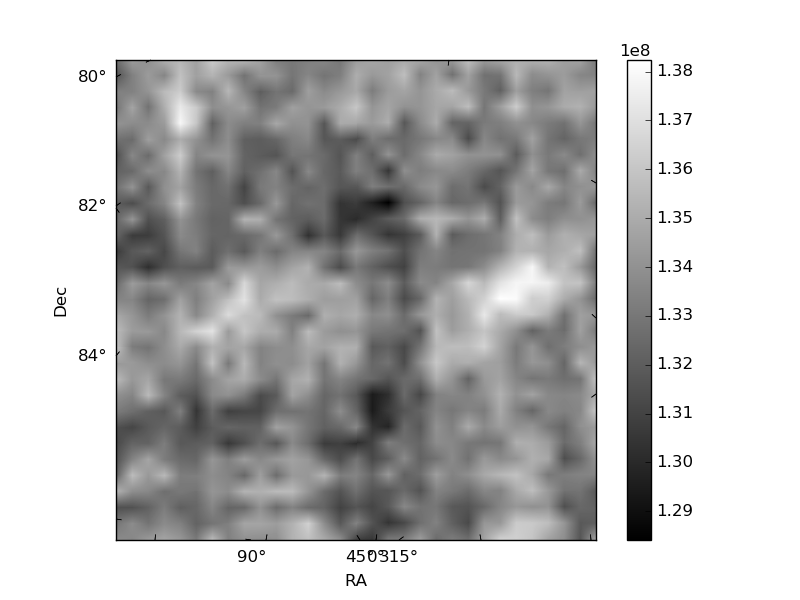
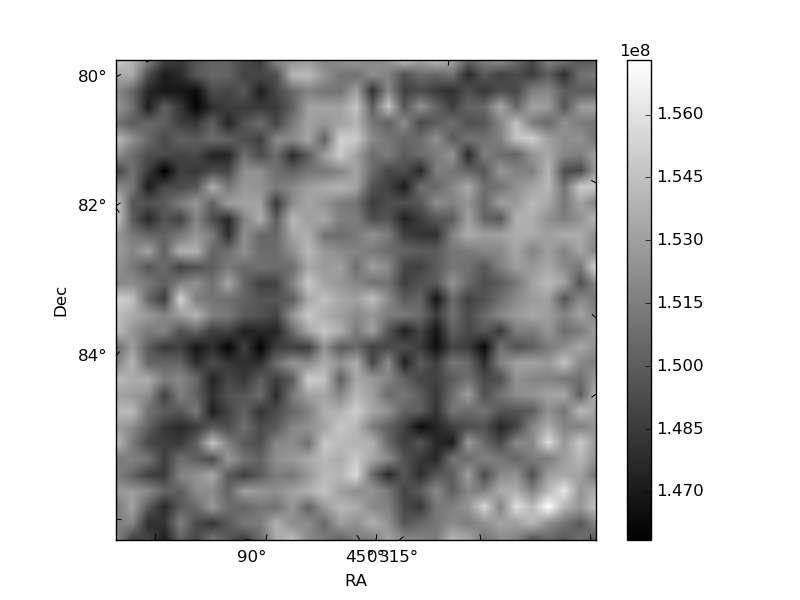
Histogram calculated using DETX and DETY for each event in the final _common_clean file
| Quadrant A | 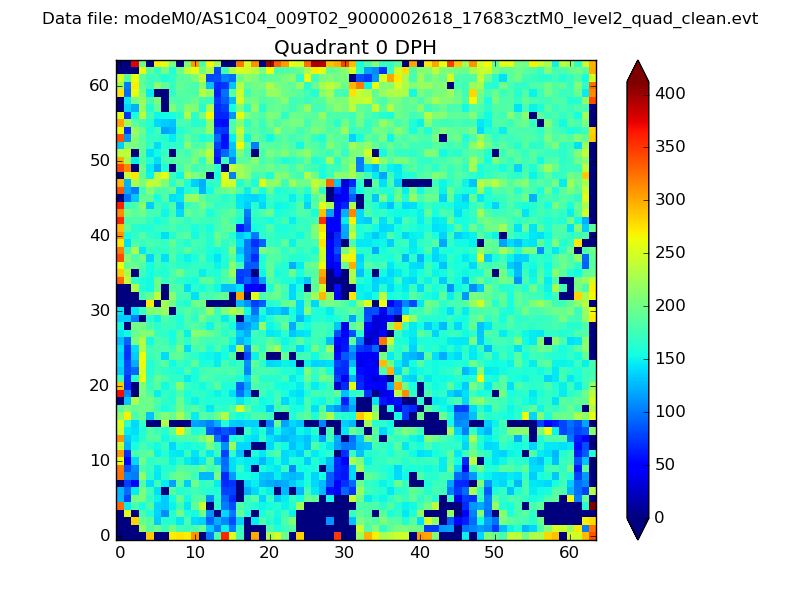 |
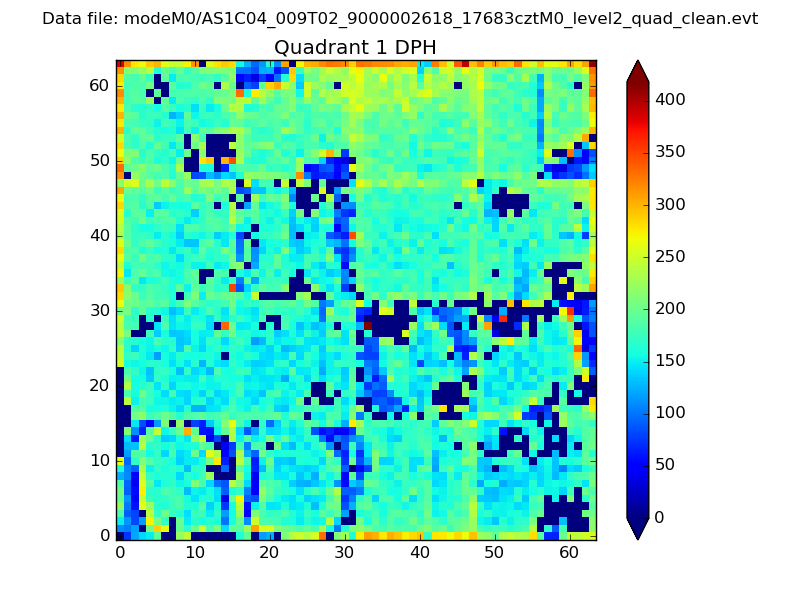 |
Quadrant B |
|---|---|---|---|
| Quadrant D | 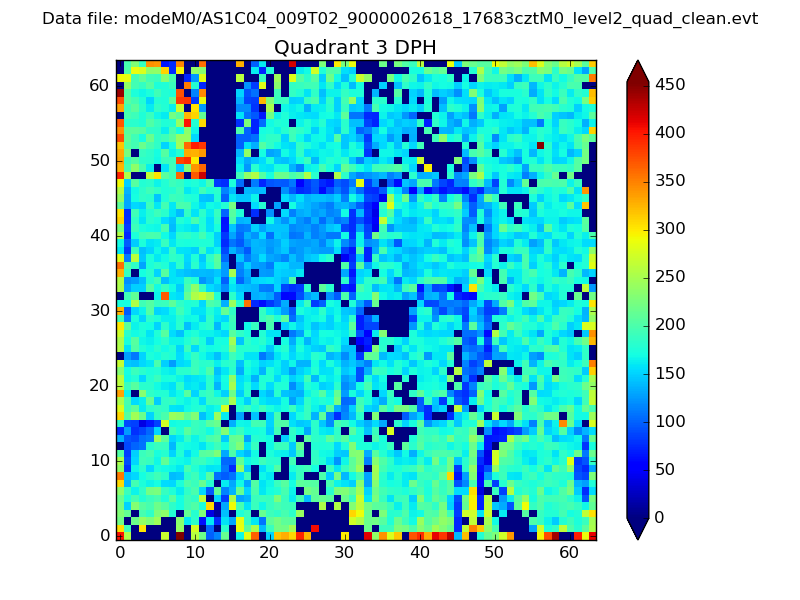 |
 |
Quadrant C |
| Plot type | Count rate plots | Images |
|---|---|---|
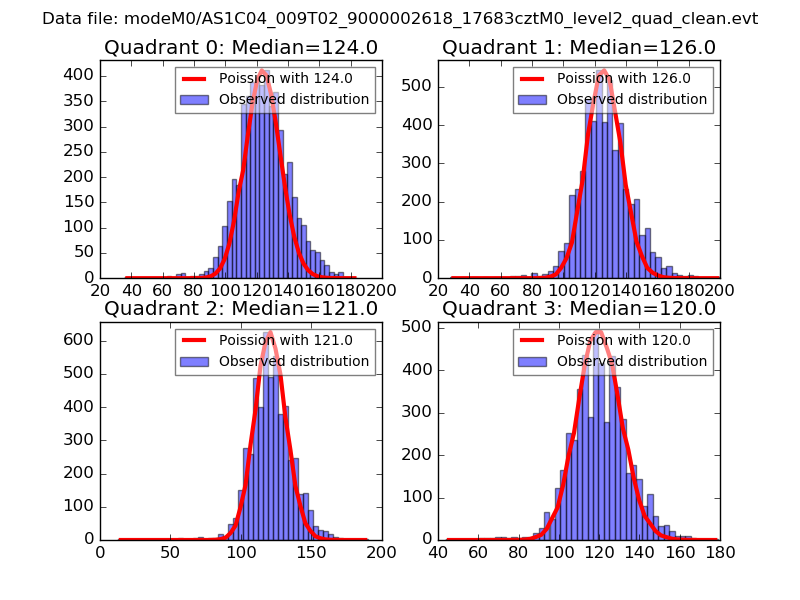
| Comparison with Poisson distribution Blue bars denote a histogram of data divided into 1 sec bins. Red curve is a Poisson curve with rate = median count rate of data. |
 |
 |
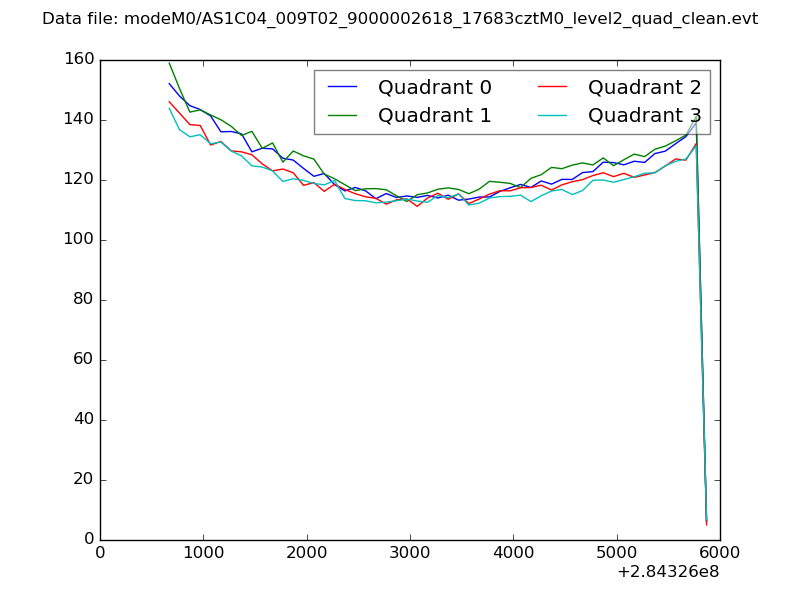
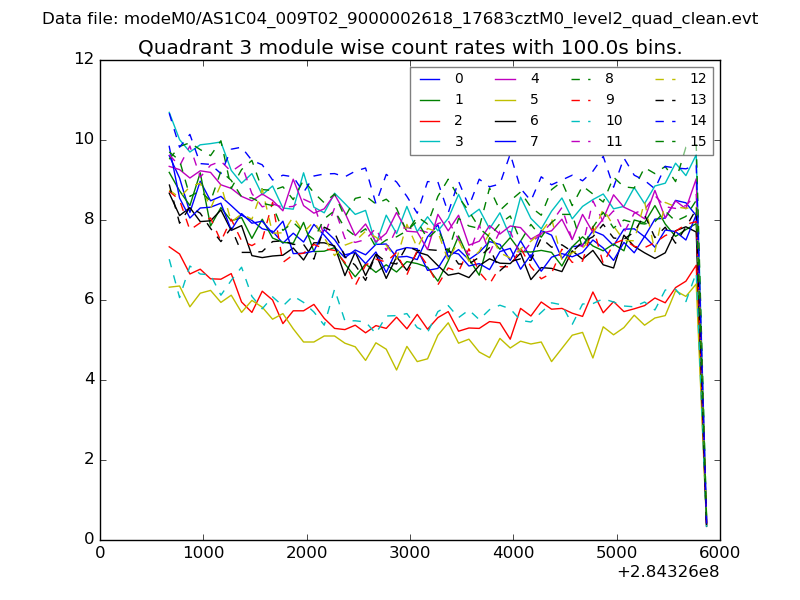
| Quadrant-wise count rates Data is divided into 100 sec bins |
 |
|
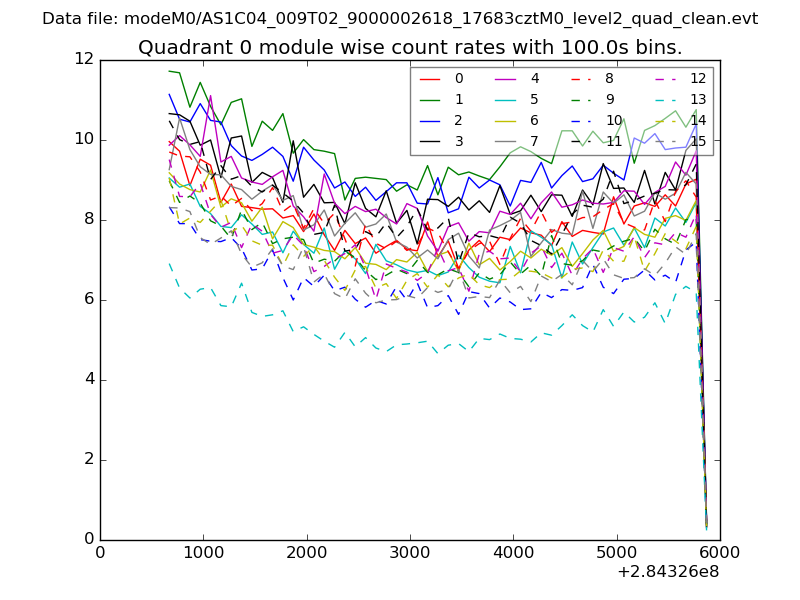
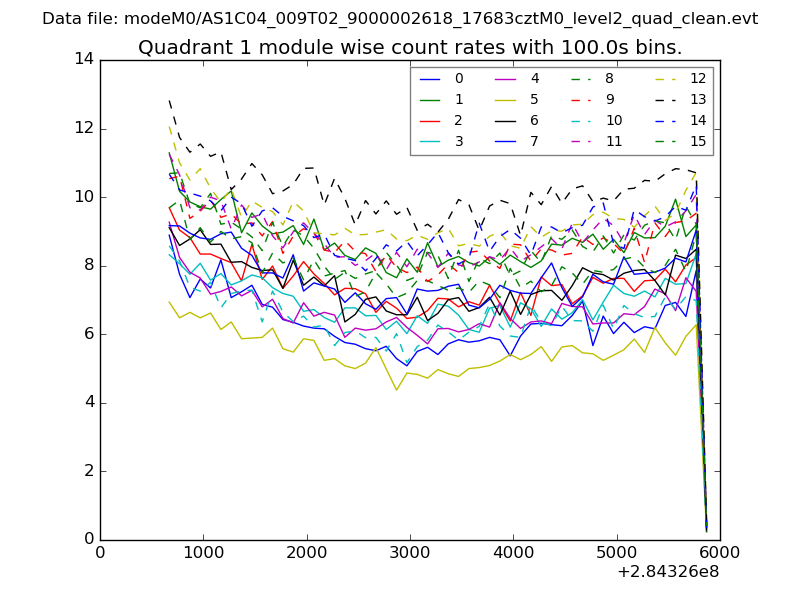
| Module-wise count rates for Quadrant A Data is divided into 100 sec bins |
 |
 |
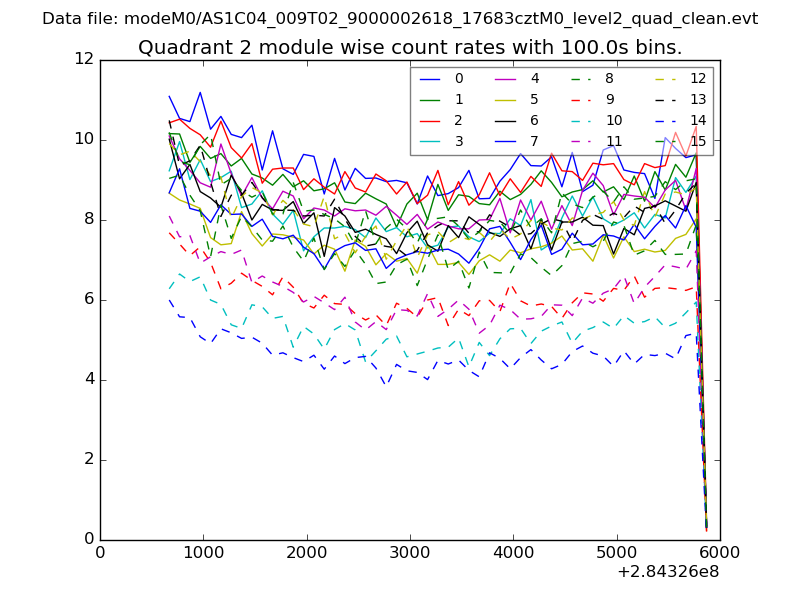
| Module-wise count rates for Quadrant B Data is divided into 100 sec bins |
 |
 |
| Module-wise count rates for Quadrant C Data is divided into 100 sec bins |
 |
 |
| Module-wise count rates for Quadrant D Data is divided into 100 sec bins |
 |
 |
| Parameter | Plot |
|---|---|
| CZT HV Monitor | 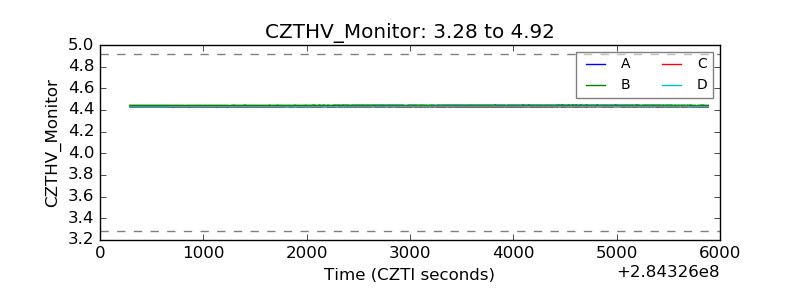 |
| D_VDD |  |
| Temperature 1 | 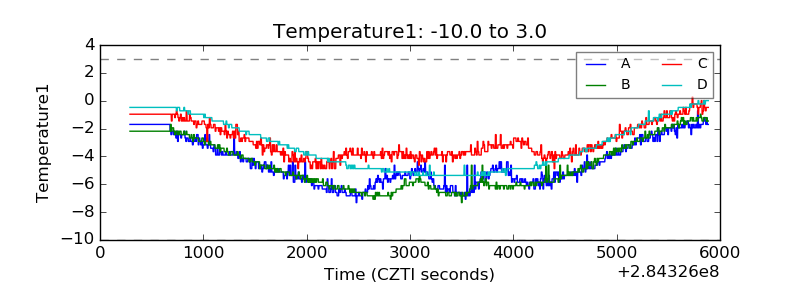 |
| Veto HV Monitor | 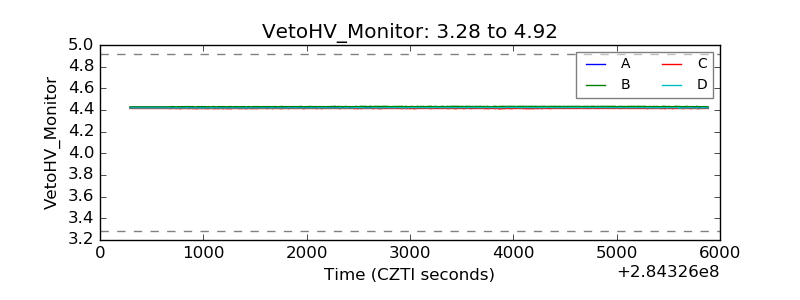 |
| Veto LLD | 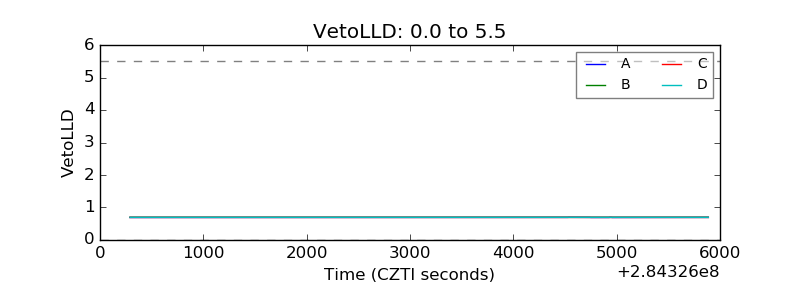 |
| Alpha Counter | 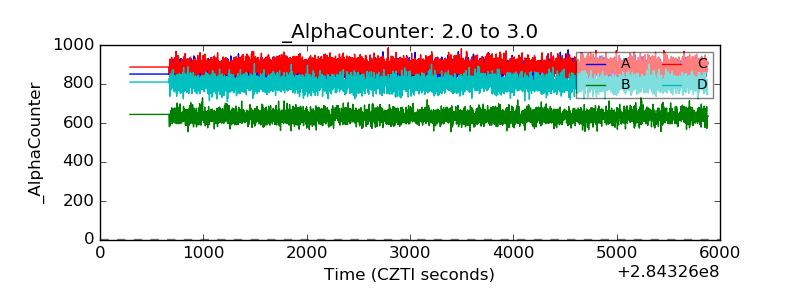 |
| _CPM_Rate | 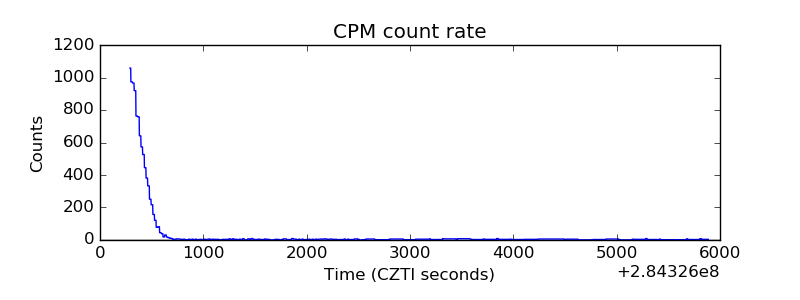 |
| CZT Counter | 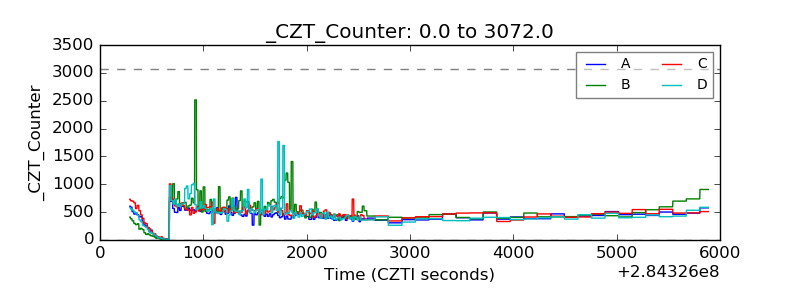 |
| +2.5 Volts monitor |  |
| +5 Volts monitor |  |
| _ROLL_ROT | 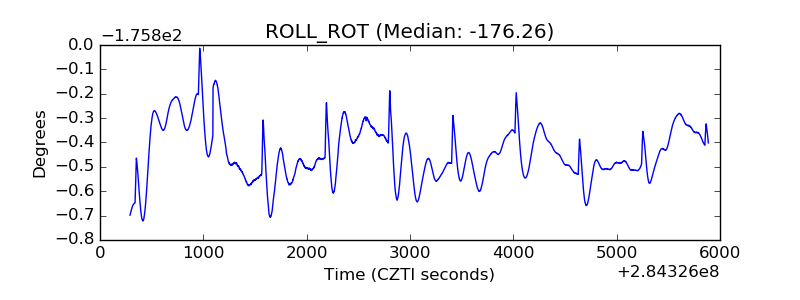 |
| _Roll_DEC | 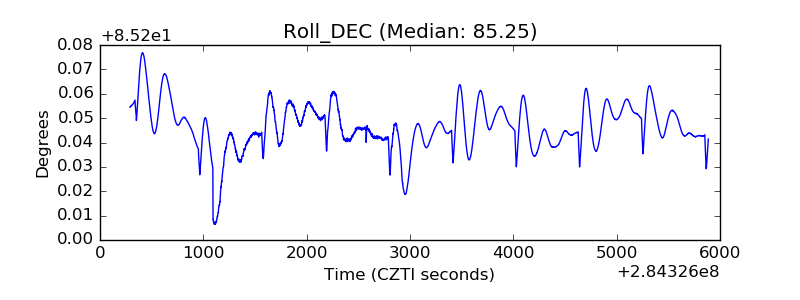 |
| _Roll_RA | 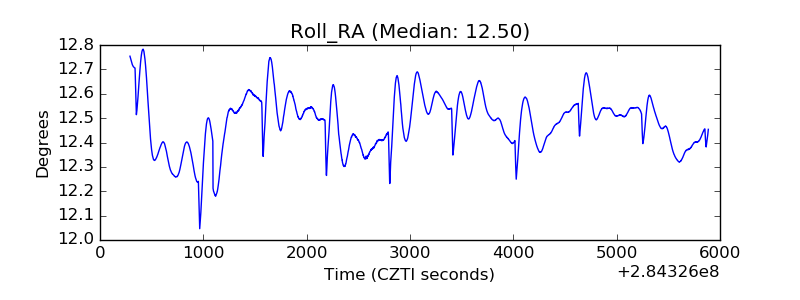 |
| Veto Counter | 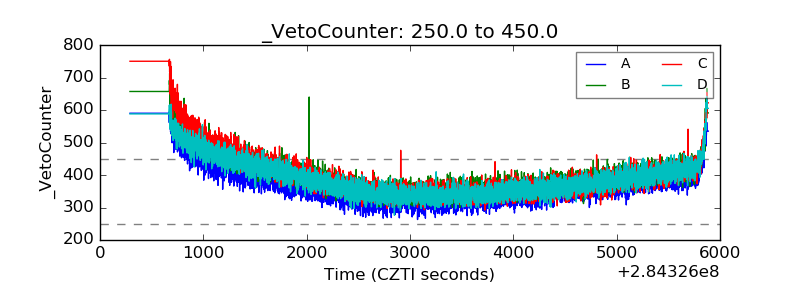 |