| Param | Original file | Final file |
|---|---|---|
| Filename | modeM0/AS1T03_050T01_9000002620_17683cztM0_level2.evt | modeM0/AS1T03_050T01_9000002620_17683cztM0_level2_quad_clean.evt |
| Size (bytes) | 115,496,640 | 27,080,640 |
| Size | 110.1 MB | 25.8 MB |
| Events in quadrant A | 647,610 | 185,253 |
| Events in quadrant B | 1,342,686 | 174,637 |
| Events in quadrant C | 687,180 | 181,925 |
| Events in quadrant D | 725,003 | 175,984 |
| Mode SS | |||
|---|---|---|---|
| Quadrant | BADHDUFLAG | Total packets | Discarded packets |
| A | 0 | 28 | 0 |
| B | 0 | 28 | 0 |
| C | 0 | 28 | 0 |
| D | 0 | 28 | 0 |
| Mode M0 | |||
|---|---|---|---|
| Quadrant | BADHDUFLAG | Total packets | Discarded packets |
| A | 0 | 2775 | 0 |
| B | 0 | 4929 | 0 |
| C | 0 | 2860 | 0 |
| D | 0 | 3045 | 0 |
| Quadrant | Total seconds | Saturated seconds | Saturation percentage |
|---|---|---|---|
| A | 1359 | 0 | 0.000000% |
| B | 1359 | 216 | 15.894040% |
| C | 1359 | 4 | 0.294334% |
| D | 1358 | 3 | 0.220913% |
Noise dominated data is calculated using 1-second bins in cleaned event files. If a bin has >2000 counts, and if more than 50% of those come from <1% of pixels, then it is considered to be noise-dominated and hence unusable.
| Quadrant | # 1 sec bins | Bins with >0 counts | Bins with >2000 counts | High rate bins dominated by noise | Noise dominated (total time) | Noise dominated (detector-on time) | Marked lightcurve |
|---|---|---|---|---|---|---|---|
| A | 1359 | 1359 | 0 | 0 | 0.00% | 0.00% | 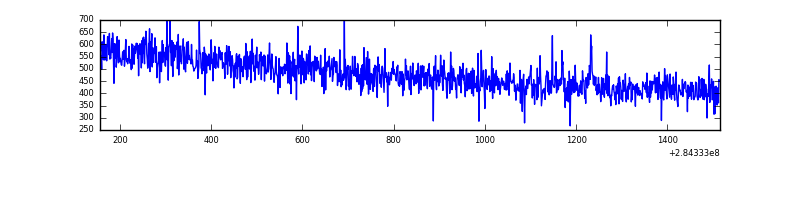 |
| B | 1359 | 1359 | 146 | 146 | 10.74% | 10.74% | 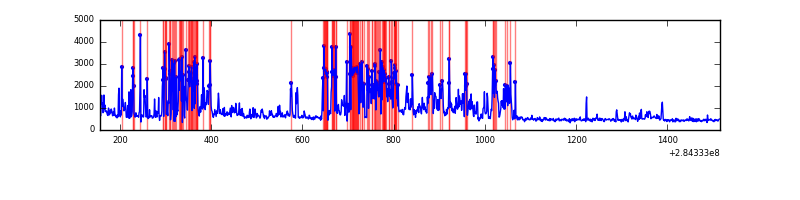 |
| C | 1359 | 1359 | 0 | 0 | 0.00% | 0.00% |  |
| D | 1358 | 1358 | 3 | 3 | 0.22% | 0.22% |  |
Top three noisy pixels from each quadrant. If the there are fewer than three noisy pixels in the level2.evt file, extra rows are filled as -1
| Pixel properties | Quadrant properties | ||||||
|---|---|---|---|---|---|---|---|
| Quadrant | DetID | PixID | Counts | Sigma | Mean | Median | Sigma |
| A | 14 | 237 | 7071 | 191.84 | 166 | 163 | 36.0 |
| A | 0 | 226 | 1462 | 36.07 | 166 | 163 | 36.0 |
| A | 3 | 15 | 1331 | 32.44 | 166 | 163 | 36.0 |
| B | 10 | 245 | 676671 | 20844.89 | 161 | 157 | 32.5 |
| B | 0 | 189 | 10864 | 329.91 | 161 | 157 | 32.5 |
| B | 4 | 80 | 8411 | 254.32 | 161 | 157 | 32.5 |
| C | 3 | 233 | 31622 | 797.08 | 161 | 162 | 39.5 |
| C | 14 | 238 | 25136 | 632.75 | 161 | 162 | 39.5 |
| C | 5 | 218 | 1578 | 35.88 | 161 | 162 | 39.5 |
| D | 1 | 52 | 93250 | 2247.65 | 158 | 153 | 41.4 |
| D | 15 | 0 | 10285 | 244.62 | 158 | 153 | 41.4 |
| D | 13 | 232 | 10235 | 243.41 | 158 | 153 | 41.4 |
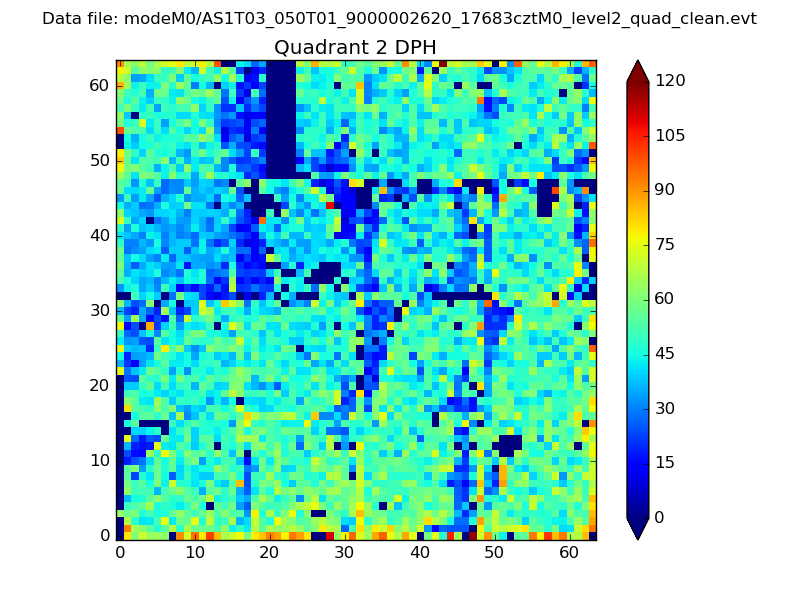
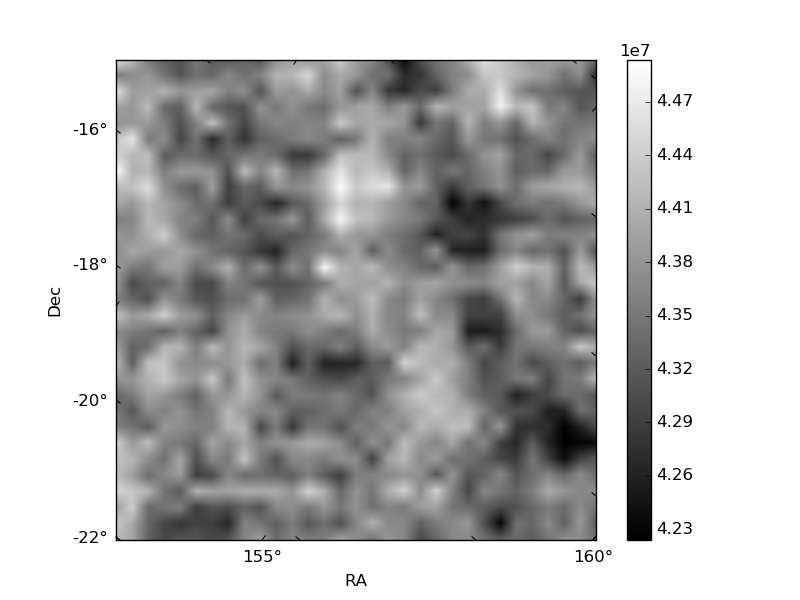
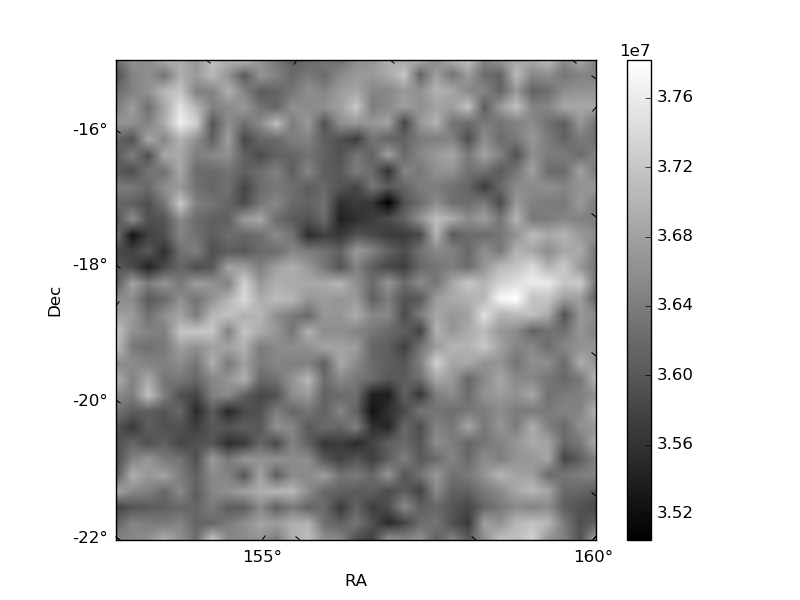
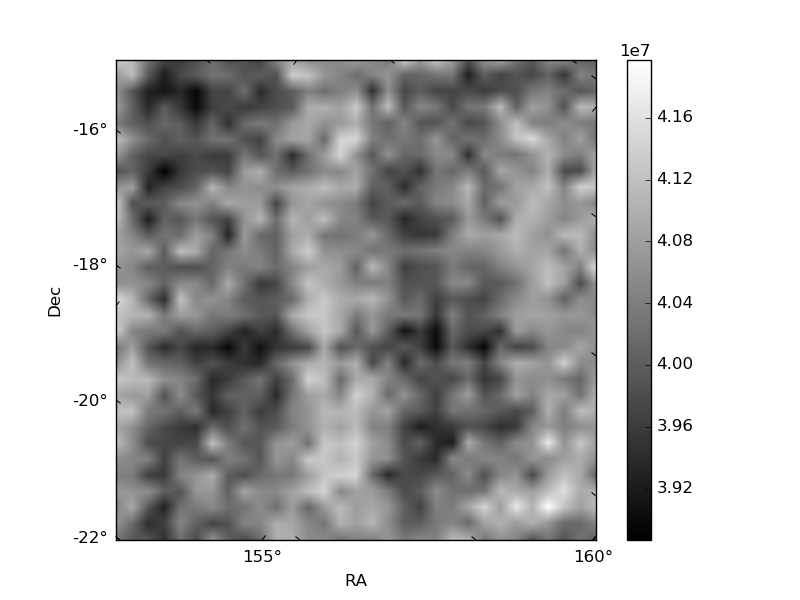
Histogram calculated using DETX and DETY for each event in the final _common_clean file
| Quadrant A | 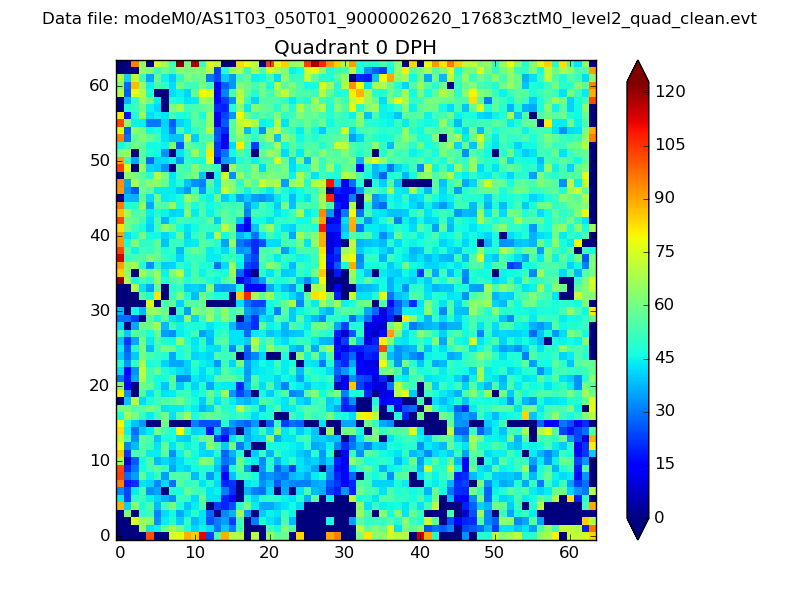 |
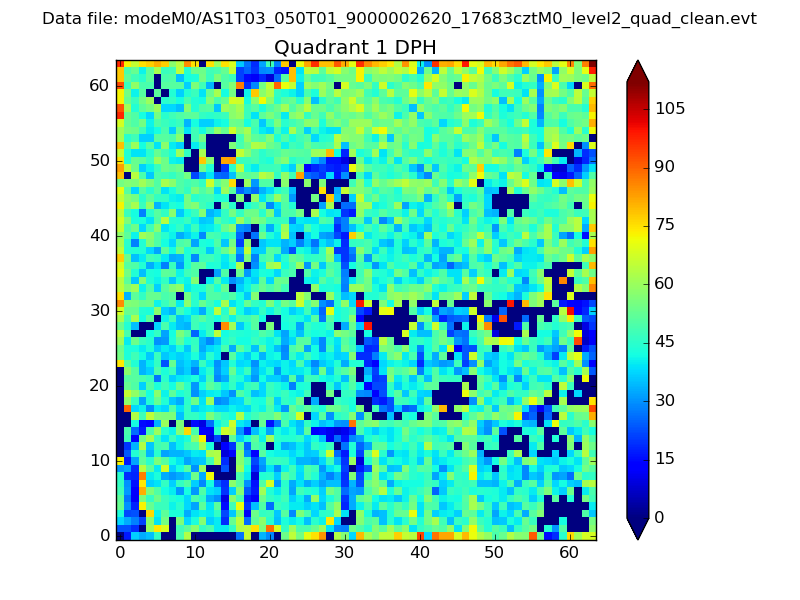 |
Quadrant B |
|---|---|---|---|
| Quadrant D | 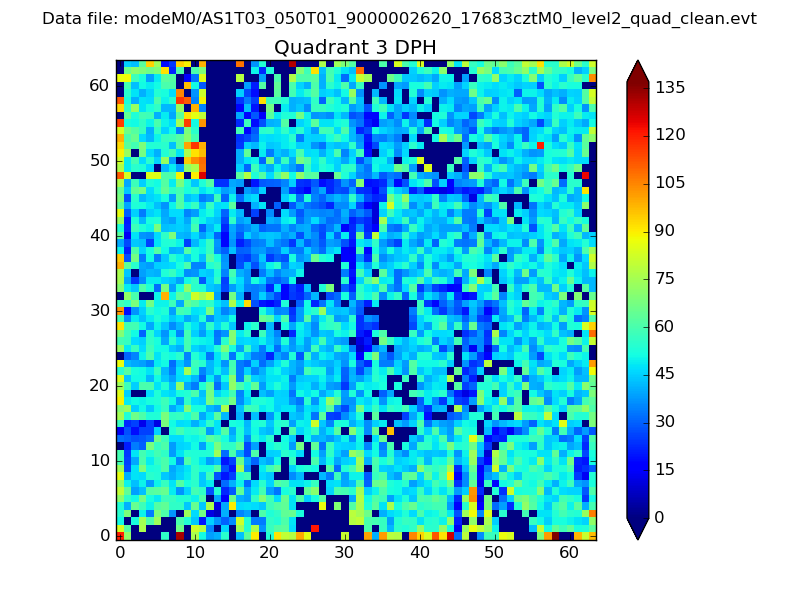 |
 |
Quadrant C |
| Plot type | Count rate plots | Images |
|---|---|---|
| Comparison with Poisson distribution Blue bars denote a histogram of data divided into 1 sec bins. Red curve is a Poisson curve with rate = median count rate of data. |
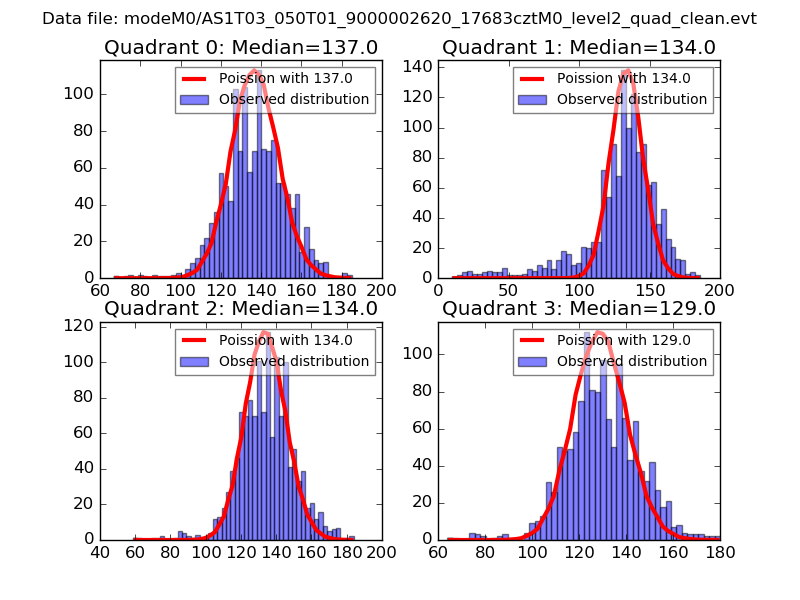 |
 |
| Quadrant-wise count rates Data is divided into 100 sec bins |
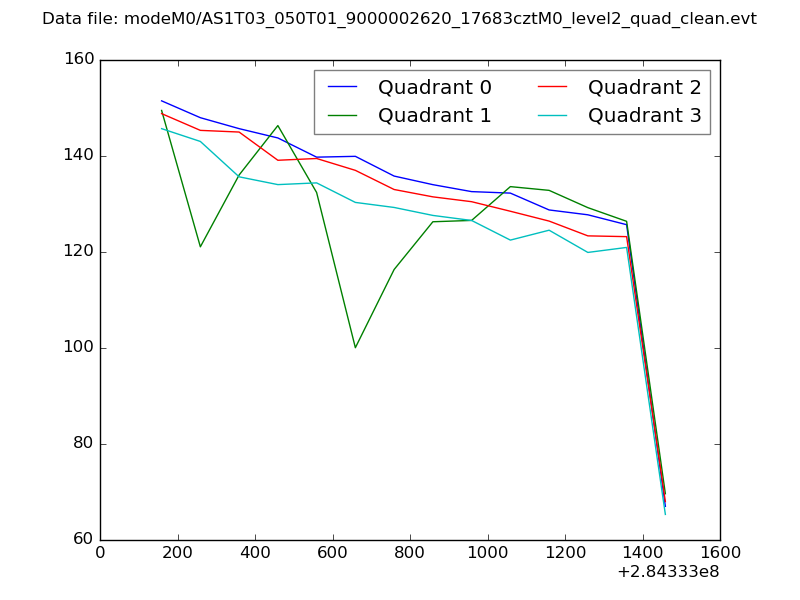 |
|
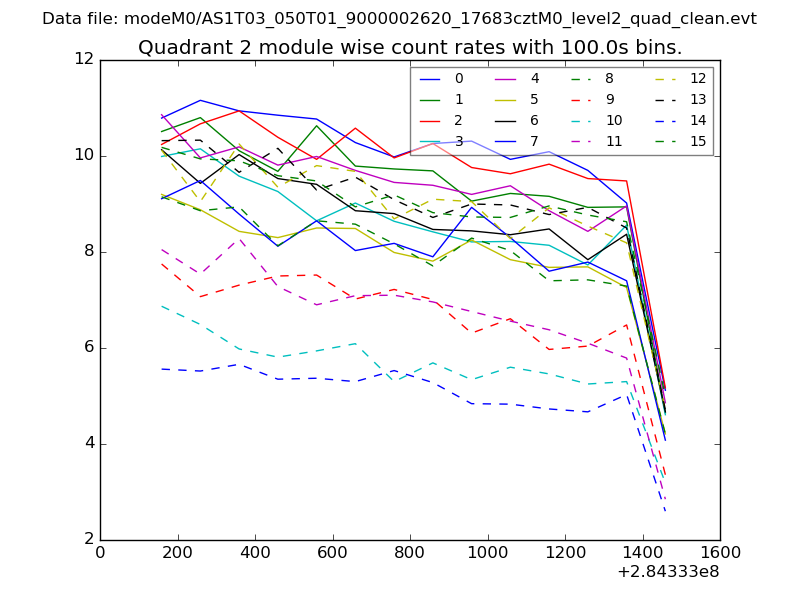
| Module-wise count rates for Quadrant A Data is divided into 100 sec bins |
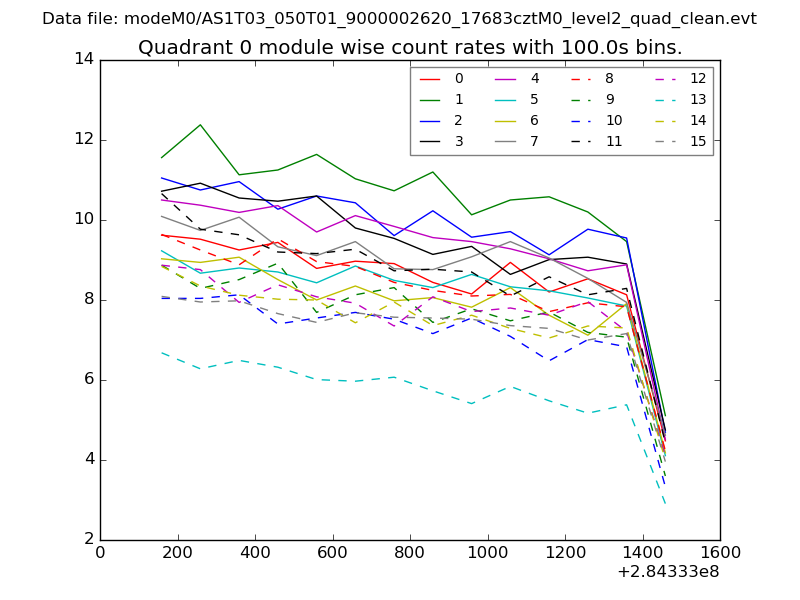 |
 |
| Module-wise count rates for Quadrant B Data is divided into 100 sec bins |
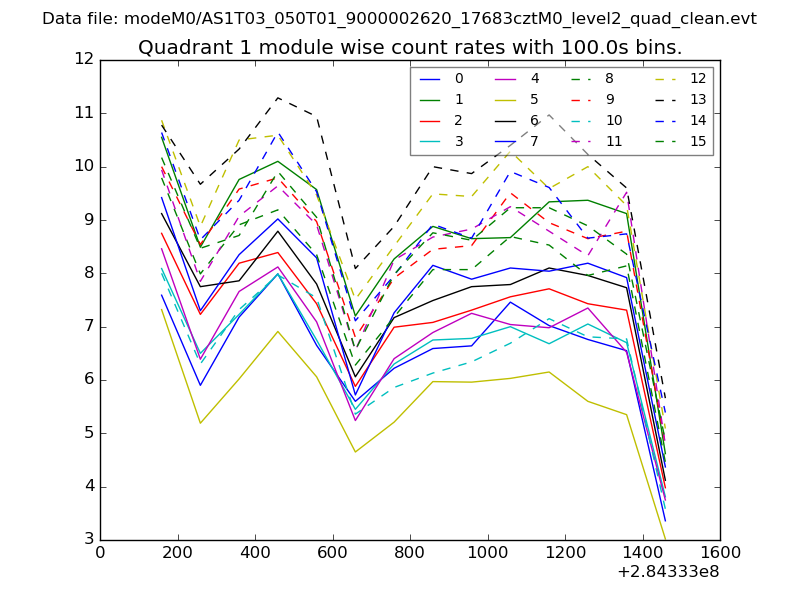 |
 |
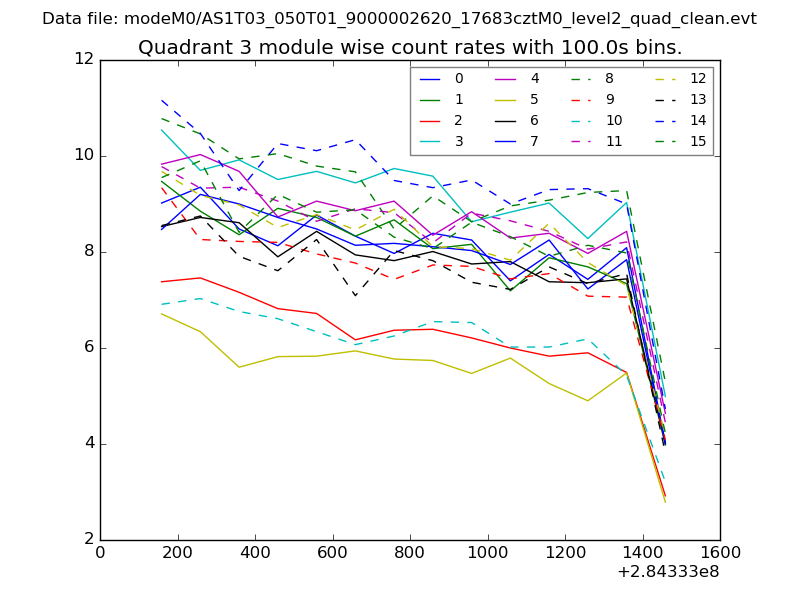
| Module-wise count rates for Quadrant C Data is divided into 100 sec bins |
 |
 |
| Module-wise count rates for Quadrant D Data is divided into 100 sec bins |
 |
 |
| Parameter | Plot |
|---|---|
| CZT HV Monitor |  |
| D_VDD | 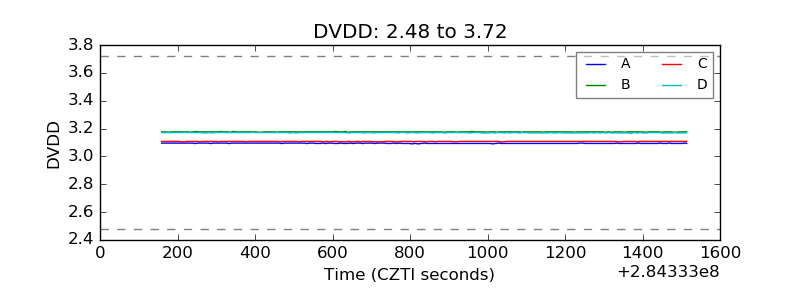 |
| Temperature 1 | 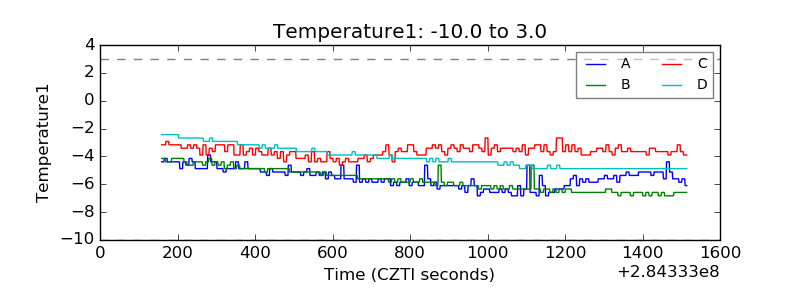 |
| Veto HV Monitor | 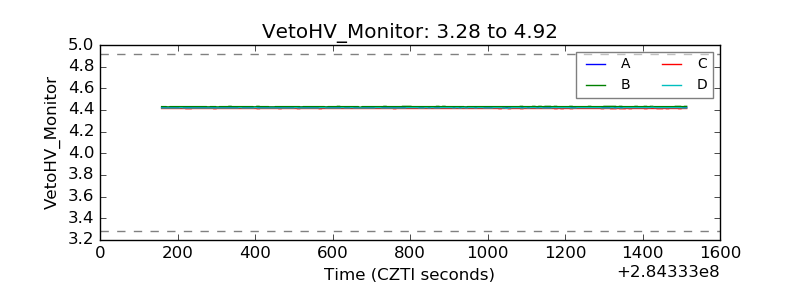 |
| Veto LLD | 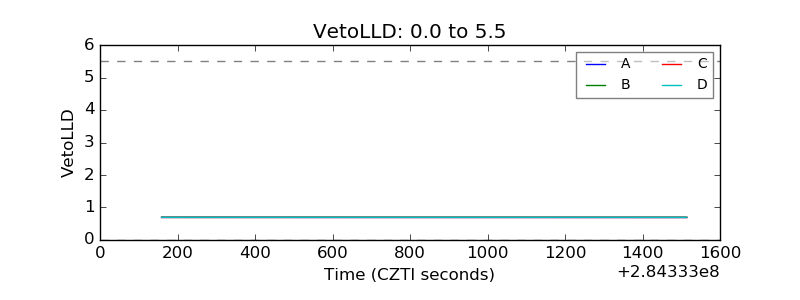 |
| Alpha Counter | 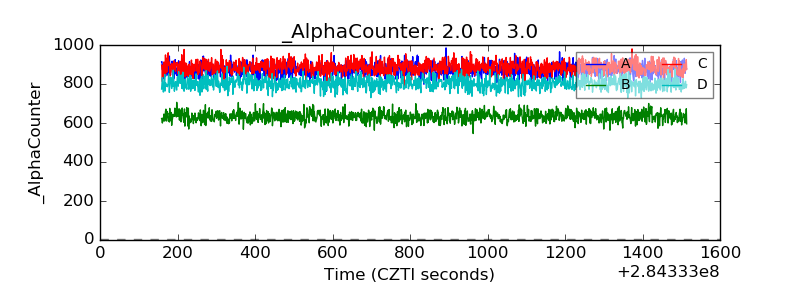 |
| _CPM_Rate | 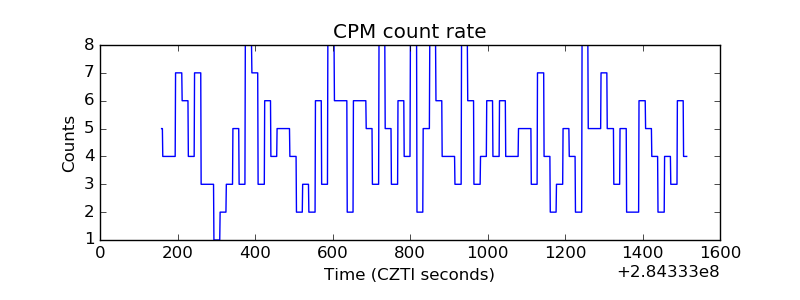 |
| CZT Counter | 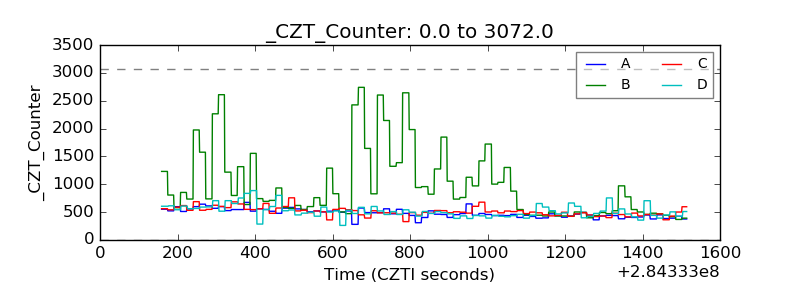 |
| +2.5 Volts monitor |  |
| +5 Volts monitor |  |
| _ROLL_ROT | 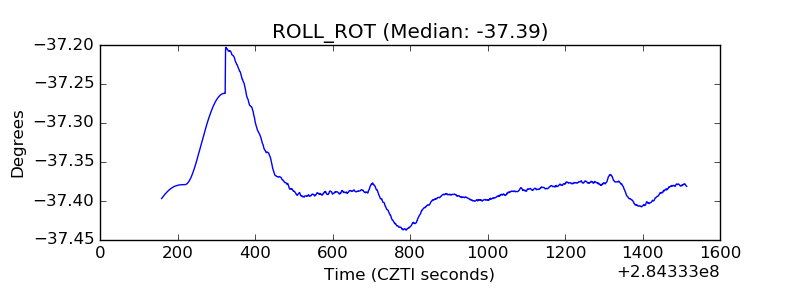 |
| _Roll_DEC | 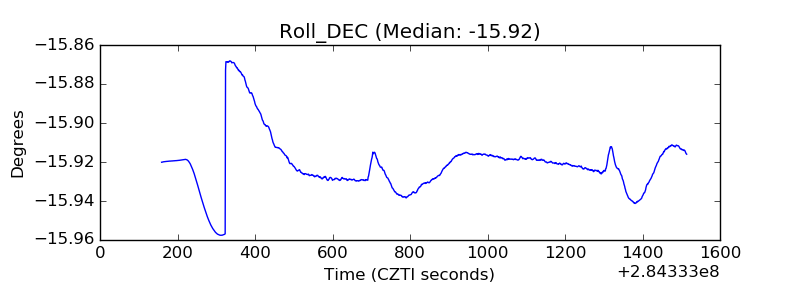 |
| _Roll_RA | 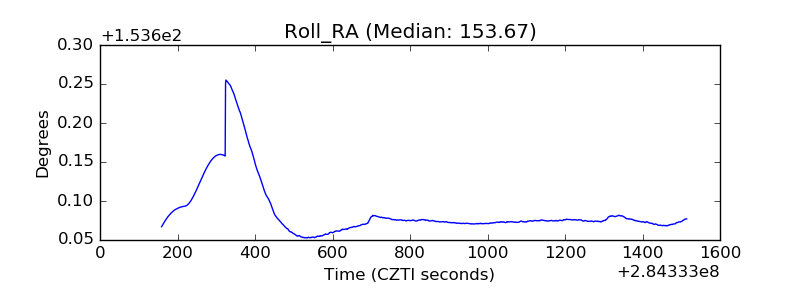 |
| Veto Counter | 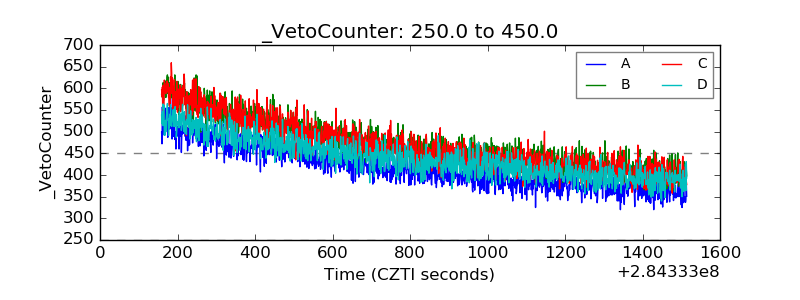 |