| Param | Original file | Final file |
|---|---|---|
| Filename | modeM0/AS1T03_052T01_9000002622cztM0_level2.fits | modeM0/AS1T03_052T01_9000002622cztM0_level2_quad_clean.evt |
| Size (bytes) | 89,233,920 | 48,242,880 |
| Size | 85.1 MB | 46.0 MB |
| Events in quadrant A | 556,218 | 221,935 |
| Events in quadrant B | 538,226 | 229,092 |
| Events in quadrant C | 542,308 | 215,876 |
| Events in quadrant D | 470,796 | 197,409 |
| Mode M0 | |||
|---|---|---|---|
| Quadrant | BADHDUFLAG | Total packets | Discarded packets |
| A | 0 | 18179 | 0 |
| B | 0 | 18602 | 0 |
| C | 0 | 18570 | 0 |
| D | 0 | 18483 | 0 |
| Mode SS | |||
|---|---|---|---|
| Quadrant | BADHDUFLAG | Total packets | Discarded packets |
| A | 0 | 174 | 0 |
| B | 0 | 174 | 0 |
| C | 0 | 174 | 0 |
| D | 0 | 174 | 0 |
| Mode M9 | |||
|---|---|---|---|
| Quadrant | BADHDUFLAG | Total packets | Discarded packets |
| A | 0 | 27 | 0 |
| B | 0 | 27 | 0 |
| C | 0 | 27 | 0 |
| D | 0 | 27 | 0 |
| Quadrant | Total seconds | Saturated seconds | Saturation percentage |
|---|---|---|---|
| A | 8579 | 37 | 0.431286% |
| B | 8579 | 81 | 0.944166% |
| C | 8579 | 122 | 1.422077% |
| D | 8579 | 50 | 0.582819% |
Noise dominated data is calculated using 1-second bins in cleaned event files. If a bin has >2000 counts, and if more than 50% of those come from <1% of pixels, then it is considered to be noise-dominated and hence unusable.
| Quadrant | # 1 sec bins | Bins with >0 counts | Bins with >2000 counts | High rate bins dominated by noise | Noise dominated (total time) | Noise dominated (detector-on time) | Marked lightcurve |
|---|---|---|---|---|---|---|---|
| A | 11179 | 8579 | 0 | 0 | 0.00% | 0.00% |  |
| B | 11179 | 8580 | 0 | 0 | 0.00% | 0.00% |  |
| C | 11179 | 8579 | 0 | 0 | 0.00% | 0.00% |  |
| D | 11179 | 8579 | 0 | 0 | 0.00% | 0.00% |  |
Top three noisy pixels from each quadrant. If the there are fewer than three noisy pixels in the level2.evt file, extra rows are filled as -1
| Pixel properties | Quadrant properties | ||||||
|---|---|---|---|---|---|---|---|
| Quadrant | DetID | PixID | Counts | Sigma | Mean | Median | Sigma |
| A | 0 | 29 | 531 | 10.5 | 144 | 136 | 37.6 |
| A | 7 | 110 | 448 | 8.29 | 144 | 136 | 37.6 |
| A | 0 | 30 | 439 | 8.05 | 144 | 136 | 37.6 |
| B | 2 | 9 | 417 | 9.3 | 142 | 136 | 30.2 |
| B | 5 | 128 | 399 | 8.7 | 142 | 136 | 30.2 |
| B | 3 | 17 | 366 | 7.61 | 142 | 136 | 30.2 |
| C | 12 | 241 | 379 | 6.37 | 143 | 135 | 38.3 |
| C | 2 | 191 | 378 | 6.35 | 143 | 135 | 38.3 |
| C | 9 | 233 | 370 | 6.14 | 143 | 135 | 38.3 |
| D | 6 | 231 | 367 | 6.64 | 134 | 122 | 36.9 |
| D | 6 | 67 | 366 | 6.62 | 134 | 122 | 36.9 |
| D | 3 | 14 | 366 | 6.62 | 134 | 122 | 36.9 |
Histogram calculated using DETX and DETY for each event in the final _common_clean file
| Quadrant A |  |
 |
Quadrant B |
|---|---|---|---|
| Quadrant D | 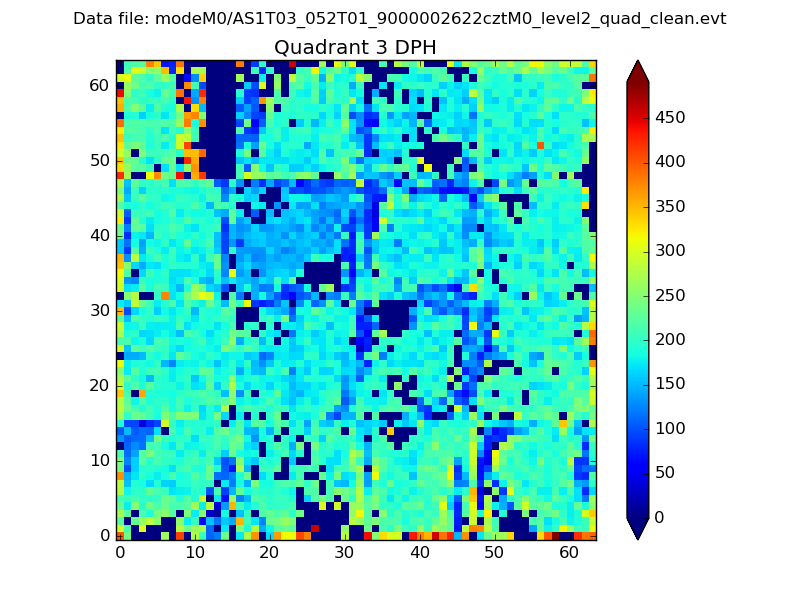 |
 |
Quadrant C |
| Plot type | Count rate plots | Images |
|---|---|---|
| Comparison with Poisson distribution Blue bars denote a histogram of data divided into 1 sec bins. Red curve is a Poisson curve with rate = median count rate of data. |
 |
 |
| Quadrant-wise count rates Data is divided into 100 sec bins |
 |
|
| Module-wise count rates for Quadrant A Data is divided into 100 sec bins |
 |
 |
| Module-wise count rates for Quadrant B Data is divided into 100 sec bins |
 |
 |
| Module-wise count rates for Quadrant C Data is divided into 100 sec bins |
 |
 |
| Module-wise count rates for Quadrant D Data is divided into 100 sec bins |
 |
 |
| Parameter | Plot |
|---|---|
| CZT HV Monitor |  |
| D_VDD |  |
| Temperature 1 |  |
| Veto HV Monitor |  |
| Veto LLD |  |
| Alpha Counter |  |
| _CPM_Rate |  |
| CZT Counter |  |
| +2.5 Volts monitor |  |
| +5 Volts monitor | 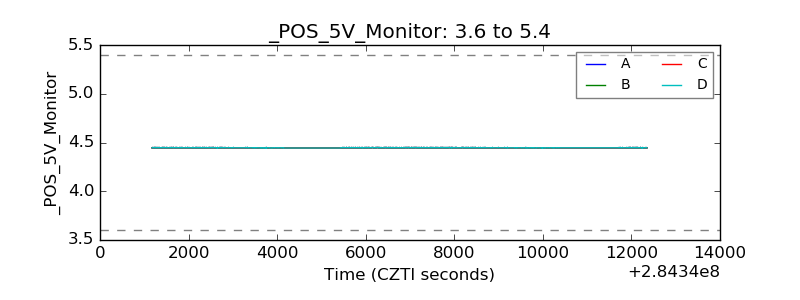 |
| _ROLL_ROT |  |
| _Roll_DEC |  |
| _Roll_RA |  |
| Veto Counter |  |