| Param | Original file | Final file |
|---|---|---|
| Filename | modeM0/AS1T03_053T01_9000002616_17682cztM0_level2.evt | modeM0/AS1T03_053T01_9000002616_17682cztM0_level2_quad_clean.evt |
| Size (bytes) | 464,993,280 | 107,228,160 |
| Size | 443.5 MB | 102.3 MB |
| Events in quadrant A | 3,260,412 | 699,934 |
| Events in quadrant B | 3,583,466 | 700,976 |
| Events in quadrant C | 3,444,763 | 677,577 |
| Events in quadrant D | 3,306,170 | 669,657 |
| Mode SS | |||
|---|---|---|---|
| Quadrant | BADHDUFLAG | Total packets | Discarded packets |
| A | 0 | 148 | 0 |
| B | 0 | 148 | 0 |
| C | 0 | 148 | 0 |
| D | 0 | 148 | 0 |
| Mode M9 | |||
|---|---|---|---|
| Quadrant | BADHDUFLAG | Total packets | Discarded packets |
| A | 0 | 7 | 0 |
| B | 0 | 7 | 0 |
| C | 0 | 7 | 0 |
| D | 0 | 7 | 0 |
| Mode M0 | |||
|---|---|---|---|
| Quadrant | BADHDUFLAG | Total packets | Discarded packets |
| A | 0 | 14562 | 1 |
| B | 0 | 15404 | 1 |
| C | 0 | 15011 | 1 |
| D | 0 | 15065 | 1 |
| Quadrant | Total seconds | Saturated seconds | Saturation percentage |
|---|---|---|---|
| A | 7168 | 78 | 1.088170% |
| B | 7168 | 93 | 1.297433% |
| C | 7168 | 120 | 1.674107% |
| D | 7168 | 97 | 1.353237% |
Noise dominated data is calculated using 1-second bins in cleaned event files. If a bin has >2000 counts, and if more than 50% of those come from <1% of pixels, then it is considered to be noise-dominated and hence unusable.
| Quadrant | # 1 sec bins | Bins with >0 counts | Bins with >2000 counts | High rate bins dominated by noise | Noise dominated (total time) | Noise dominated (detector-on time) | Marked lightcurve |
|---|---|---|---|---|---|---|---|
| A | 7757 | 7168 | 0 | 0 | 0.00% | 0.00% | 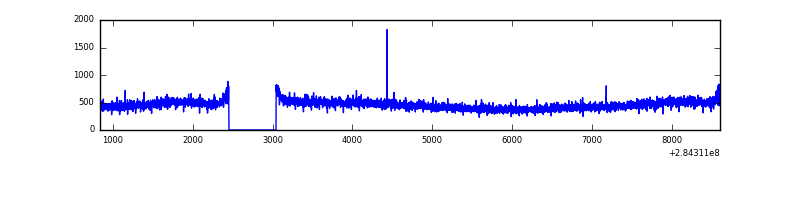 |
| B | 7758 | 7169 | 7 | 7 | 0.09% | 0.10% | 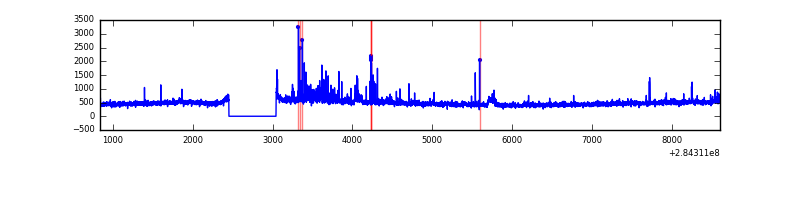 |
| C | 7758 | 7168 | 0 | 0 | 0.00% | 0.00% | 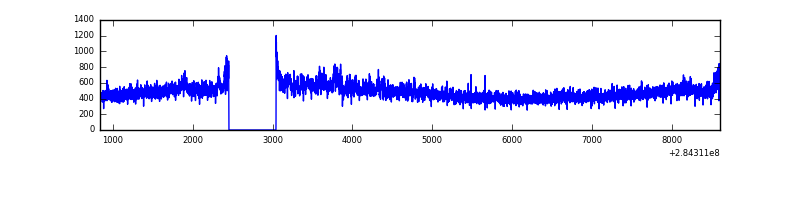 |
| D | 7758 | 7168 | 7 | 7 | 0.09% | 0.10% | 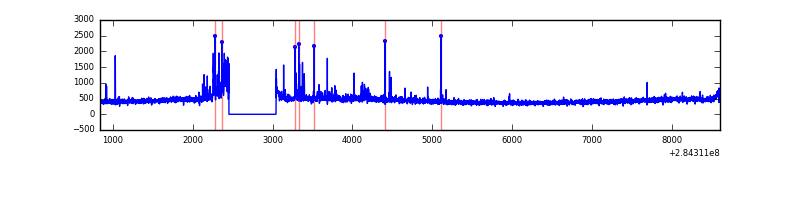 |
Top three noisy pixels from each quadrant. If the there are fewer than three noisy pixels in the level2.evt file, extra rows are filled as -1
| Pixel properties | Quadrant properties | ||||||
|---|---|---|---|---|---|---|---|
| Quadrant | DetID | PixID | Counts | Sigma | Mean | Median | Sigma |
| A | 0 | 226 | 7154 | 37.05 | 844 | 823 | 170.9 |
| A | 3 | 137 | 6534 | 33.42 | 844 | 823 | 170.9 |
| A | 15 | 174 | 6477 | 33.09 | 844 | 823 | 170.9 |
| B | 7 | 220 | 107446 | 657.88 | 840 | 818 | 162.1 |
| B | 10 | 245 | 83293 | 508.86 | 840 | 818 | 162.1 |
| B | 15 | 35 | 20458 | 121.17 | 840 | 818 | 162.1 |
| C | 3 | 233 | 158889 | 839.63 | 800 | 804 | 188.3 |
| C | 14 | 238 | 124487 | 656.91 | 800 | 804 | 188.3 |
| C | 5 | 218 | 36598 | 190.11 | 800 | 804 | 188.3 |
| D | 7 | 238 | 121553 | 605.99 | 813 | 788 | 199.3 |
| D | 10 | 70 | 40521 | 199.38 | 813 | 788 | 199.3 |
| D | 2 | 234 | 32233 | 157.79 | 813 | 788 | 199.3 |
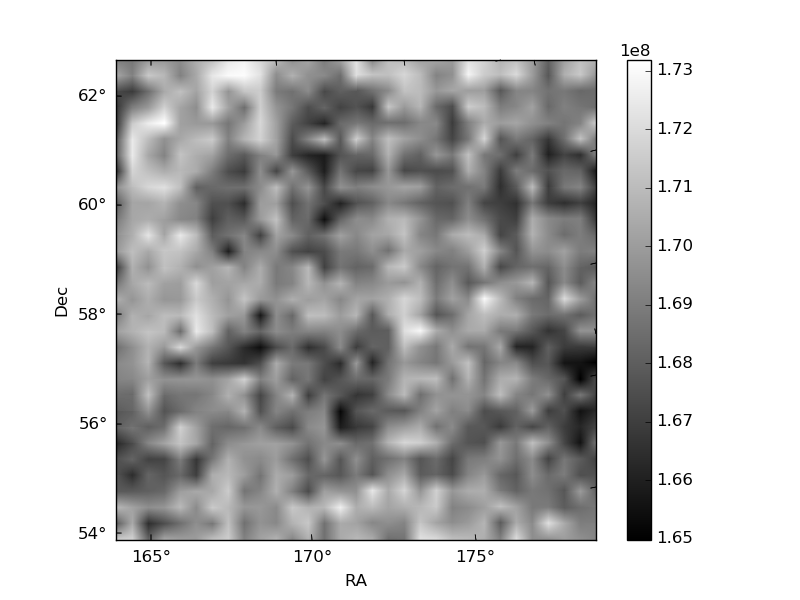
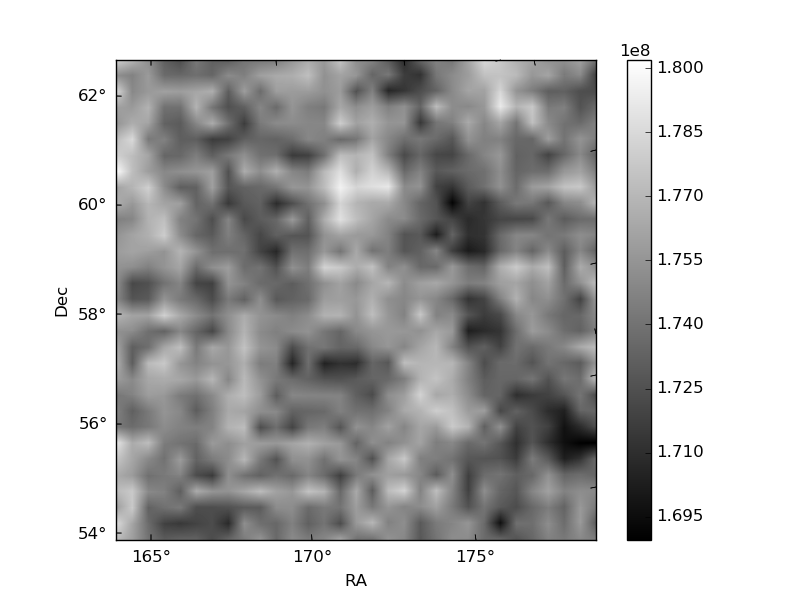
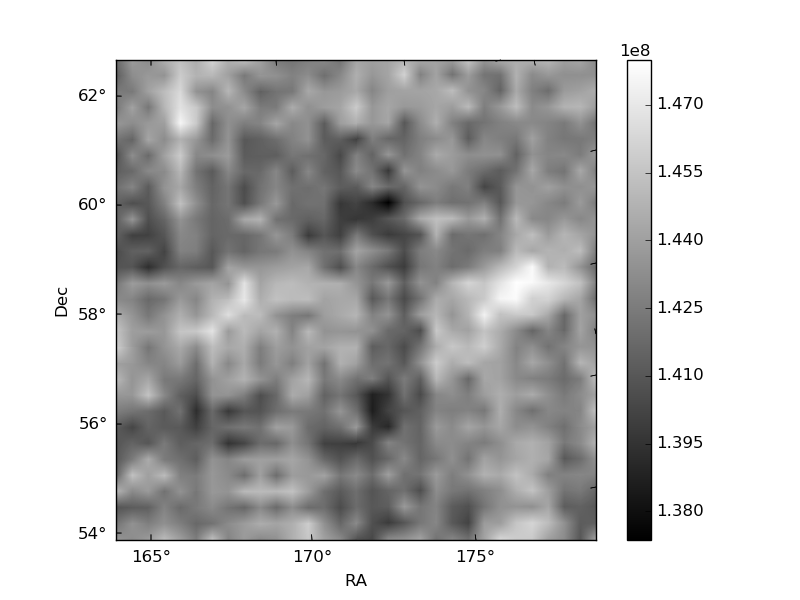
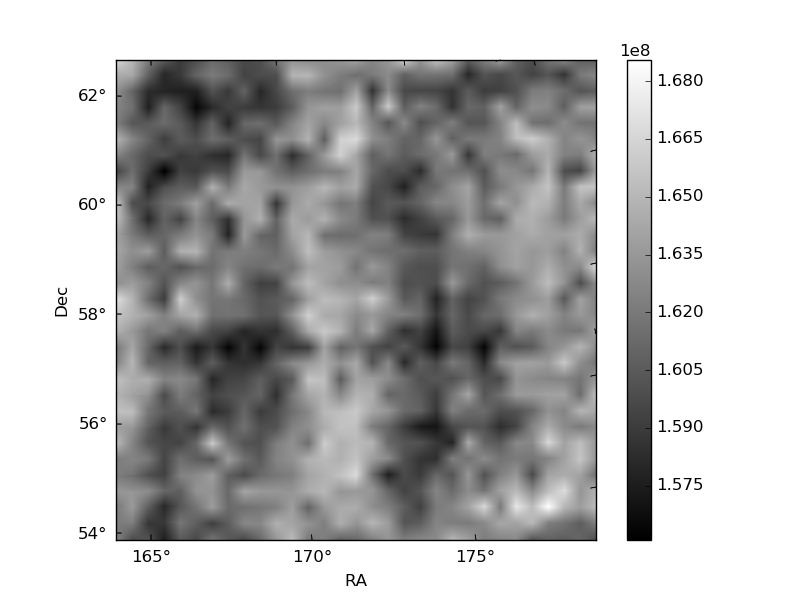
Histogram calculated using DETX and DETY for each event in the final _common_clean file
| Quadrant A | 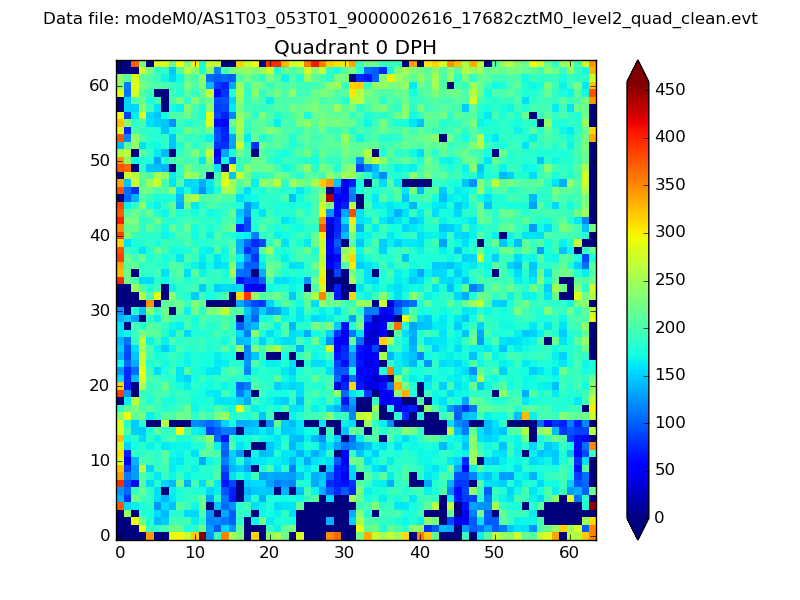 |
 |
Quadrant B |
|---|---|---|---|
| Quadrant D |  |
 |
Quadrant C |
| Plot type | Count rate plots | Images |
|---|---|---|
| Comparison with Poisson distribution Blue bars denote a histogram of data divided into 1 sec bins. Red curve is a Poisson curve with rate = median count rate of data. |
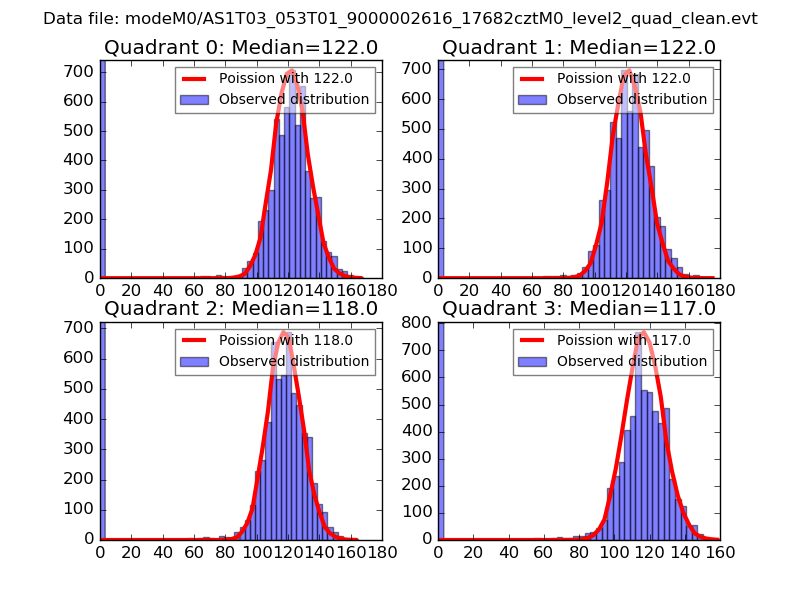 |
 |
| Quadrant-wise count rates Data is divided into 100 sec bins |
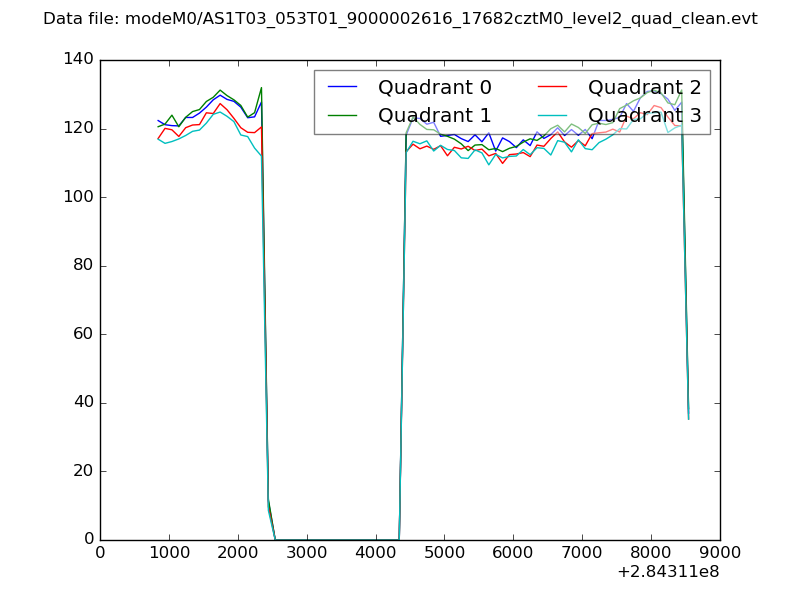 |
|
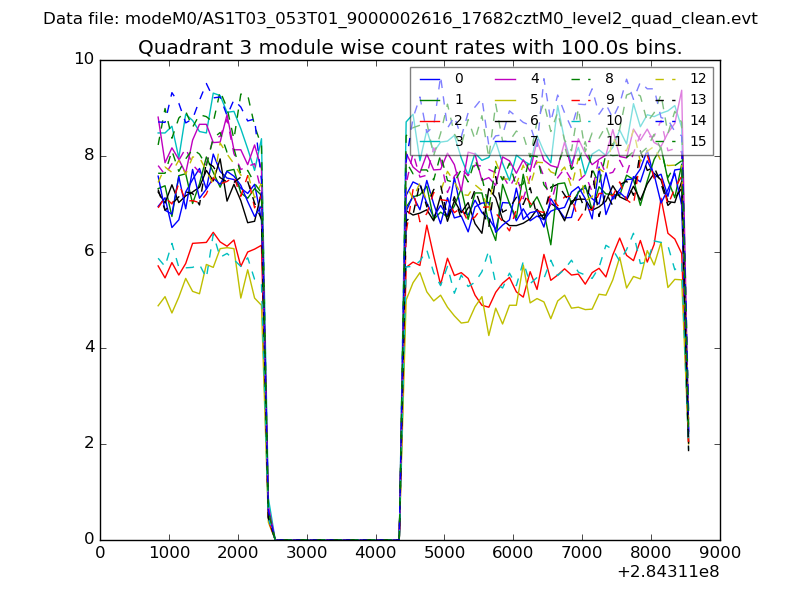
| Module-wise count rates for Quadrant A Data is divided into 100 sec bins |
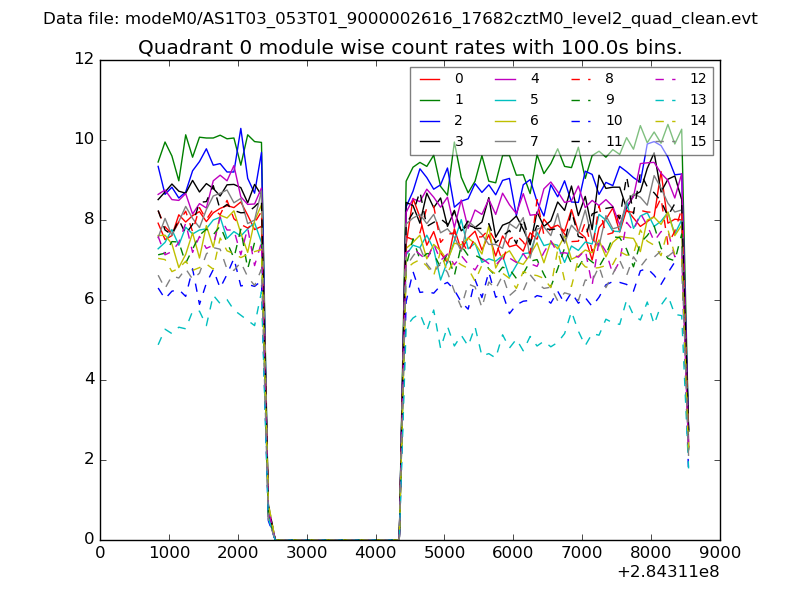 |
 |
| Module-wise count rates for Quadrant B Data is divided into 100 sec bins |
 |
 |
| Module-wise count rates for Quadrant C Data is divided into 100 sec bins |
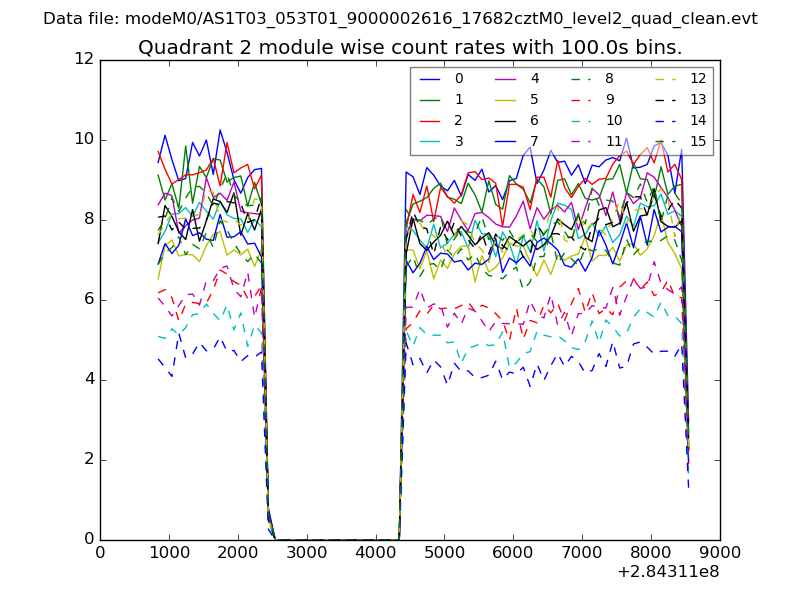 |
 |
| Module-wise count rates for Quadrant D Data is divided into 100 sec bins |
 |
 |
| Parameter | Plot |
|---|---|
| CZT HV Monitor |  |
| D_VDD | 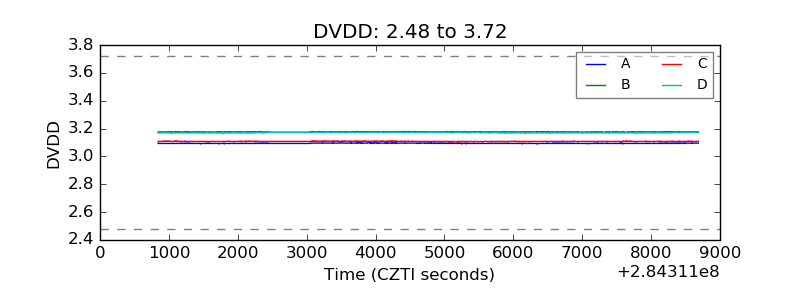 |
| Temperature 1 | 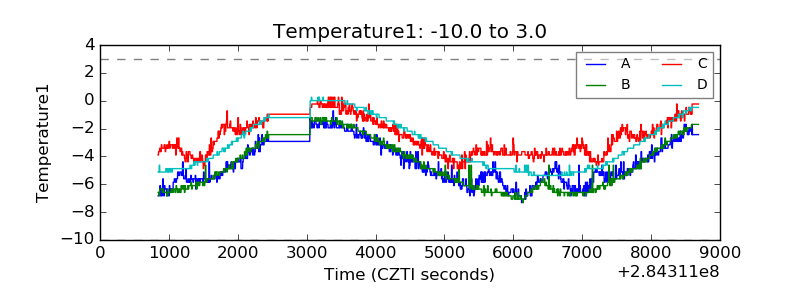 |
| Veto HV Monitor | 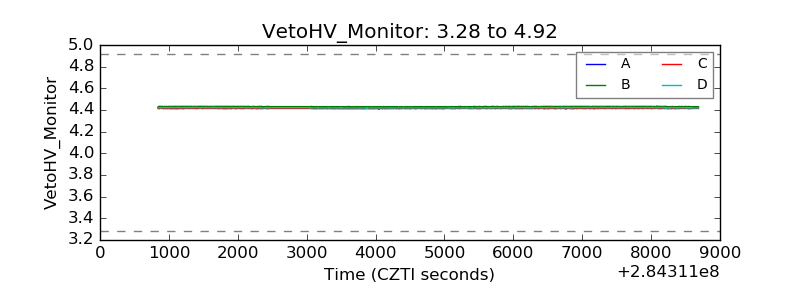 |
| Veto LLD | 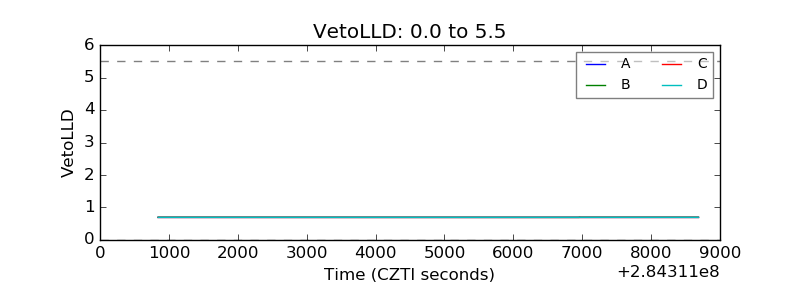 |
| Alpha Counter | 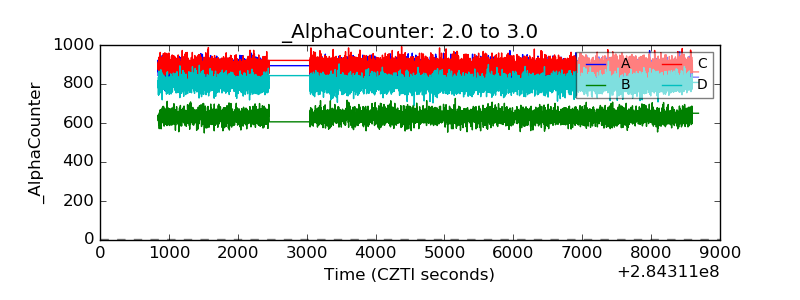 |
| _CPM_Rate | 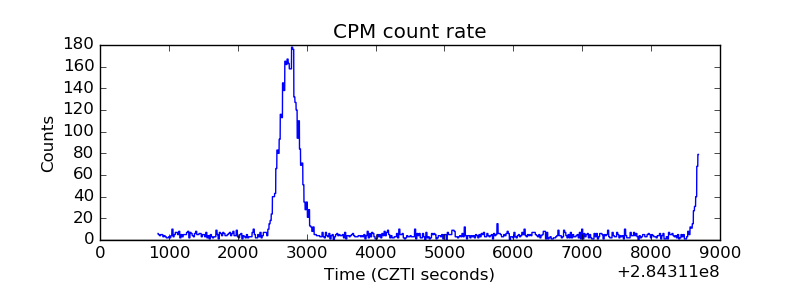 |
| CZT Counter | 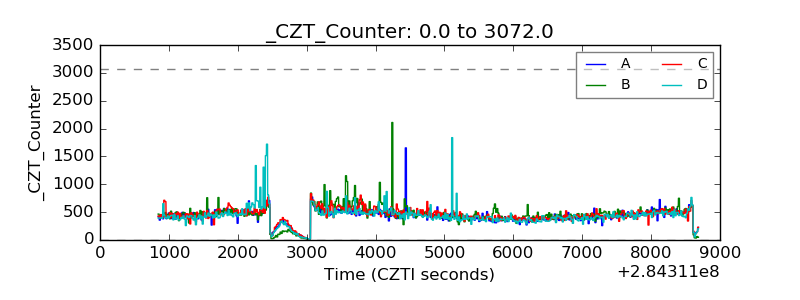 |
| +2.5 Volts monitor |  |
| +5 Volts monitor | 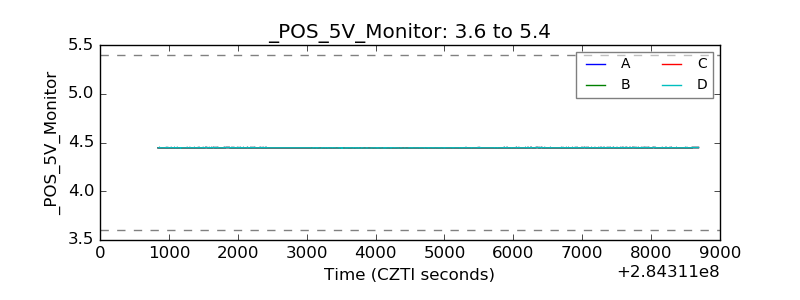 |
| _ROLL_ROT | 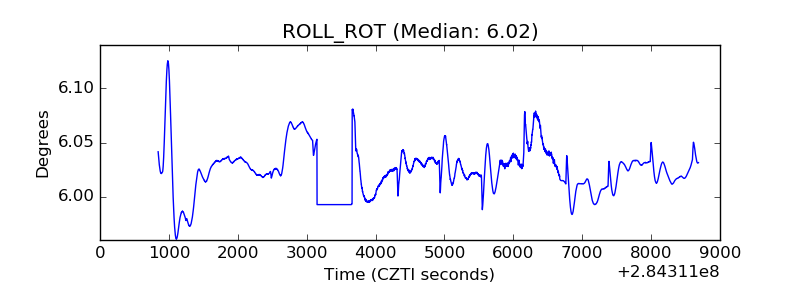 |
| _Roll_DEC | 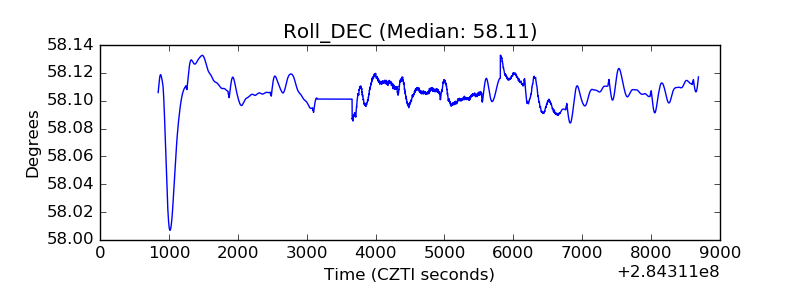 |
| _Roll_RA | 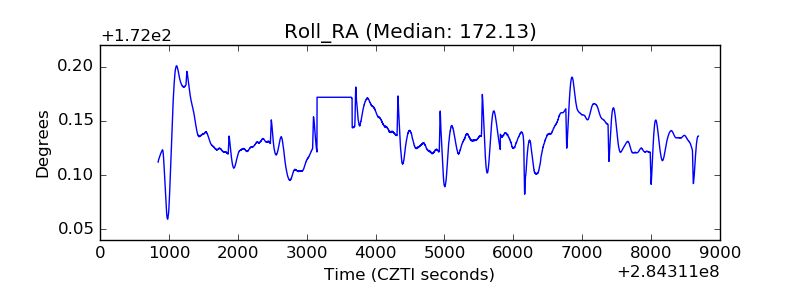 |
| Veto Counter | 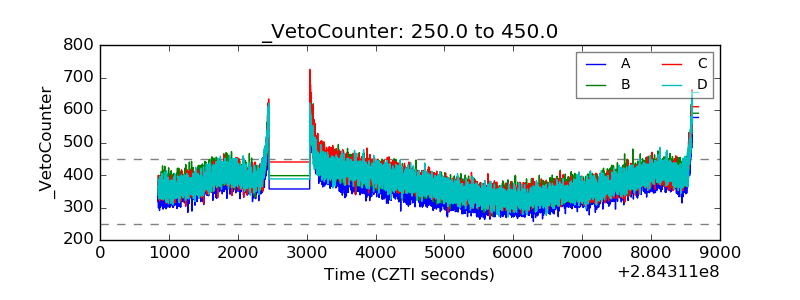 |