| Param | Original file | Final file |
|---|---|---|
| Filename | modeM0/AS1A05_084T06_9000002626_17696cztM0_level2.evt | modeM0/AS1A05_084T06_9000002626_17696cztM0_level2_quad_clean.evt |
| Size (bytes) | 264,176,640 | 37,111,680 |
| Size | 251.9 MB | 35.4 MB |
| Events in quadrant A | 2,067,221 | 218,153 |
| Events in quadrant B | 1,979,444 | 219,791 |
| Events in quadrant C | 1,866,627 | 211,519 |
| Events in quadrant D | 1,831,087 | 208,866 |
| Mode M9 | |||
|---|---|---|---|
| Quadrant | BADHDUFLAG | Total packets | Discarded packets |
| A | 0 | 8 | 0 |
| B | 0 | 8 | 0 |
| C | 0 | 8 | 0 |
| D | 0 | 8 | 0 |
| Mode M0 | |||
|---|---|---|---|
| Quadrant | BADHDUFLAG | Total packets | Discarded packets |
| A | 0 | 8548 | 1 |
| B | 0 | 8166 | 1 |
| C | 0 | 7756 | 1 |
| D | 0 | 7875 | 1 |
| Mode SS | |||
|---|---|---|---|
| Quadrant | BADHDUFLAG | Total packets | Discarded packets |
| A | 0 | 78 | 0 |
| B | 0 | 78 | 0 |
| C | 0 | 78 | 0 |
| D | 0 | 78 | 0 |
| Quadrant | Total seconds | Saturated seconds | Saturation percentage |
|---|---|---|---|
| A | 3742 | 133 | 3.554249% |
| B | 3742 | 40 | 1.068947% |
| C | 3742 | 38 | 1.015500% |
| D | 3742 | 12 | 0.320684% |
Noise dominated data is calculated using 1-second bins in cleaned event files. If a bin has >2000 counts, and if more than 50% of those come from <1% of pixels, then it is considered to be noise-dominated and hence unusable.
| Quadrant | # 1 sec bins | Bins with >0 counts | Bins with >2000 counts | High rate bins dominated by noise | Noise dominated (total time) | Noise dominated (detector-on time) | Marked lightcurve |
|---|---|---|---|---|---|---|---|
| A | 4582 | 3743 | 82 | 82 | 1.79% | 2.19% | 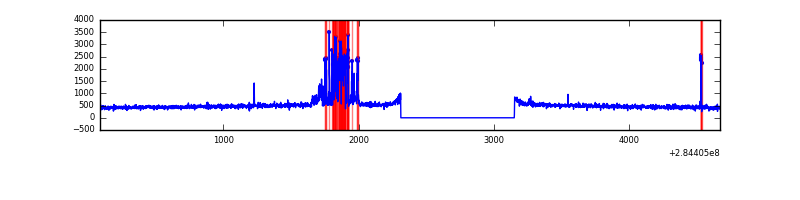 |
| B | 4582 | 3743 | 4 | 4 | 0.09% | 0.11% | 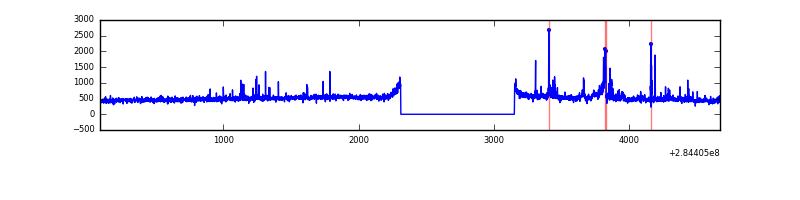 |
| C | 4582 | 3743 | 0 | 0 | 0.00% | 0.00% | 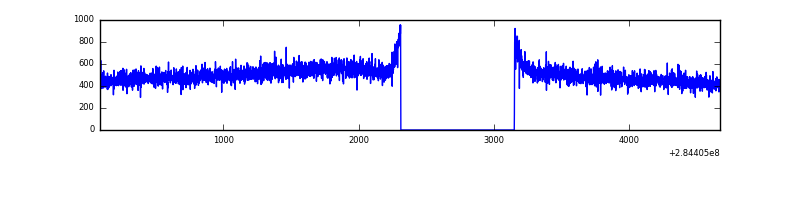 |
| D | 4582 | 3743 | 7 | 7 | 0.15% | 0.19% | 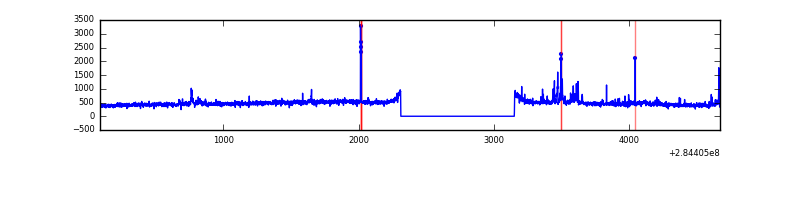 |
Top three noisy pixels from each quadrant. If the there are fewer than three noisy pixels in the level2.evt file, extra rows are filled as -1
| Pixel properties | Quadrant properties | ||||||
|---|---|---|---|---|---|---|---|
| Quadrant | DetID | PixID | Counts | Sigma | Mean | Median | Sigma |
| A | 15 | 174 | 292977 | 3080.71 | 461 | 452 | 95.0 |
| A | 0 | 226 | 4009 | 37.46 | 461 | 452 | 95.0 |
| A | 3 | 137 | 3568 | 32.82 | 461 | 452 | 95.0 |
| B | 0 | 229 | 88821 | 952.14 | 468 | 456 | 92.8 |
| B | 10 | 245 | 42694 | 455.12 | 468 | 456 | 92.8 |
| B | 0 | 189 | 20178 | 212.51 | 468 | 456 | 92.8 |
| C | 14 | 238 | 69190 | 642.06 | 447 | 449 | 107.1 |
| C | 3 | 233 | 37972 | 350.48 | 447 | 449 | 107.1 |
| C | 5 | 218 | 12625 | 113.73 | 447 | 449 | 107.1 |
| D | 7 | 238 | 44687 | 363.84 | 451 | 440 | 121.6 |
| D | 10 | 70 | 33141 | 268.9 | 451 | 440 | 121.6 |
| D | 1 | 52 | 16473 | 131.84 | 451 | 440 | 121.6 |
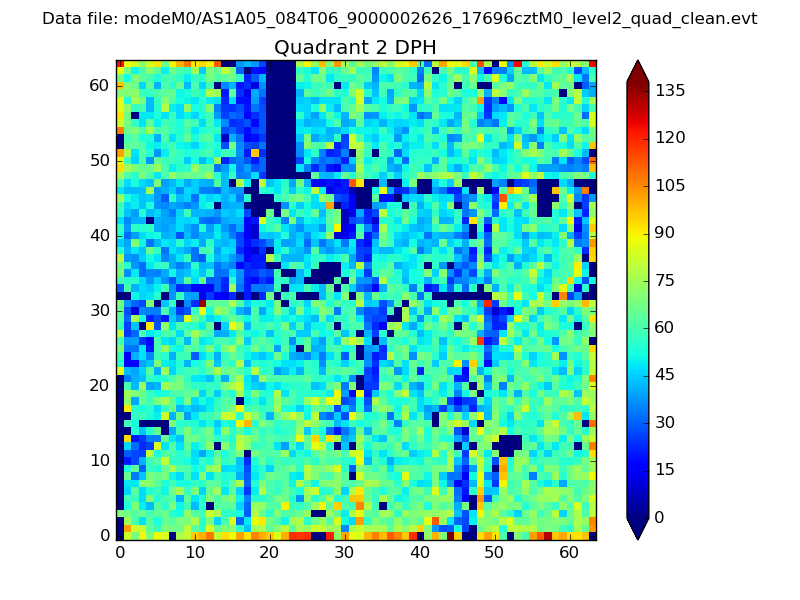
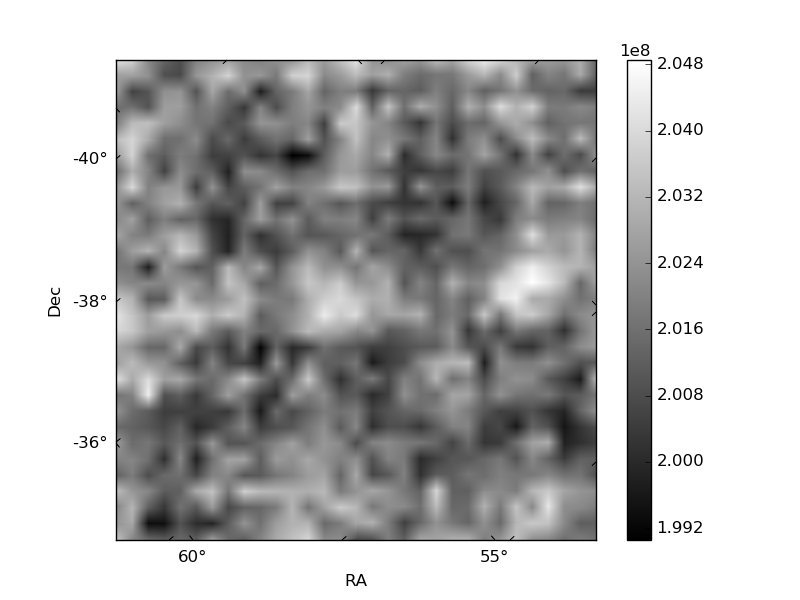
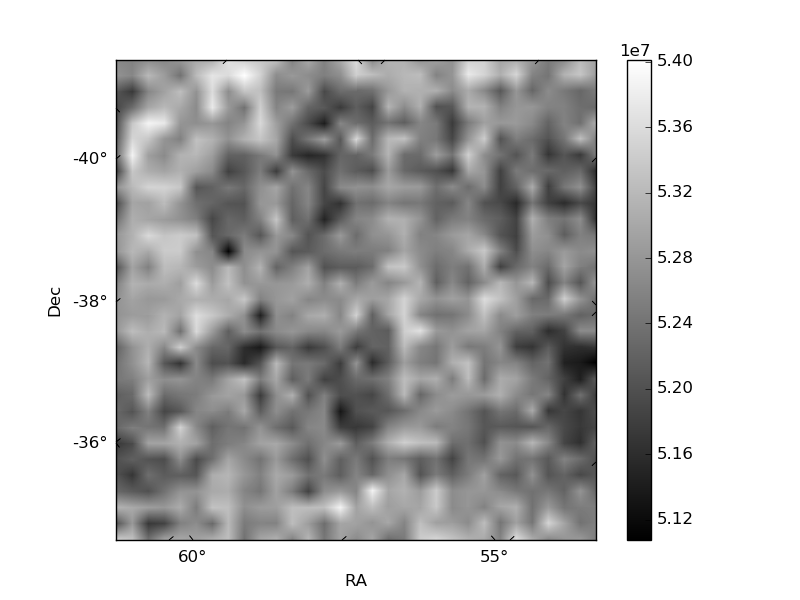
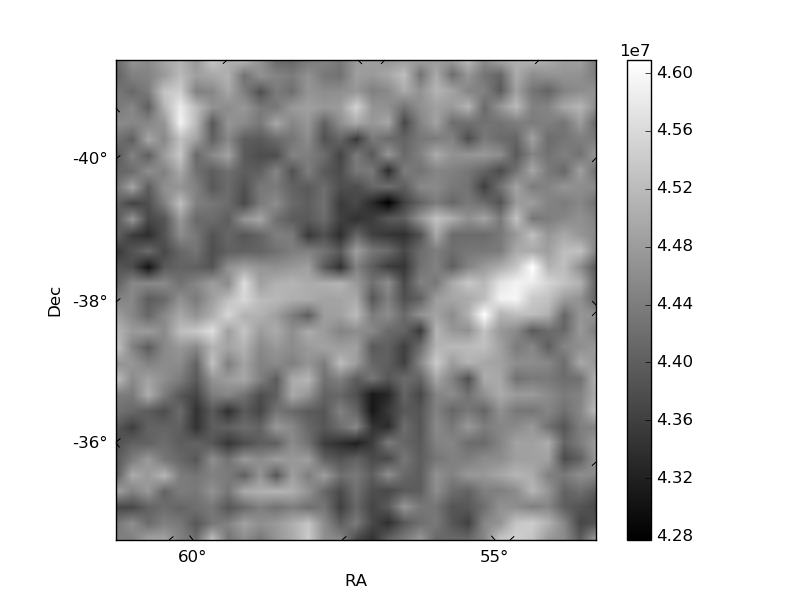
Histogram calculated using DETX and DETY for each event in the final _common_clean file
| Quadrant A | 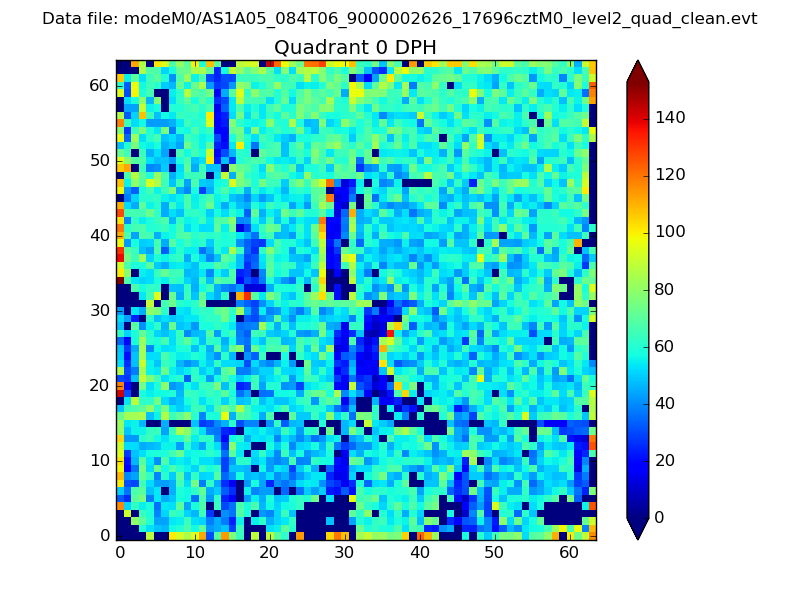 |
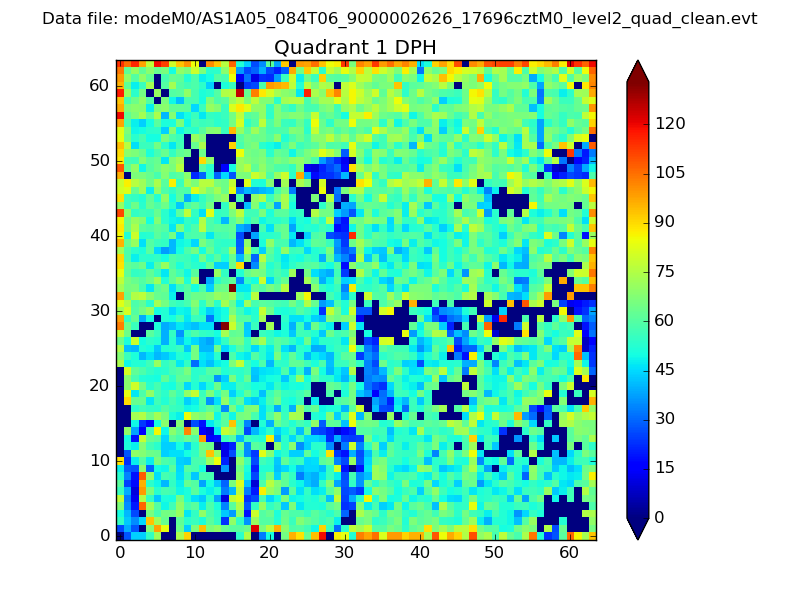 |
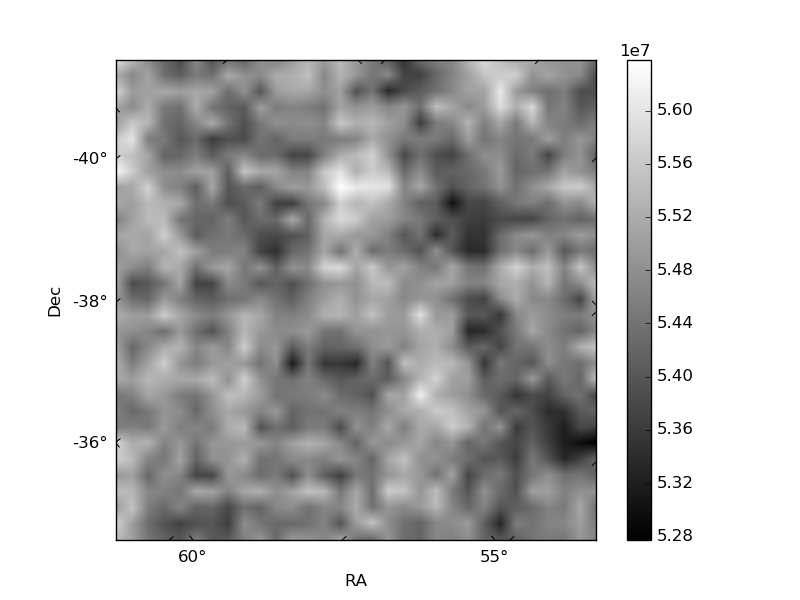
Quadrant B |
|---|---|---|---|
| Quadrant D | 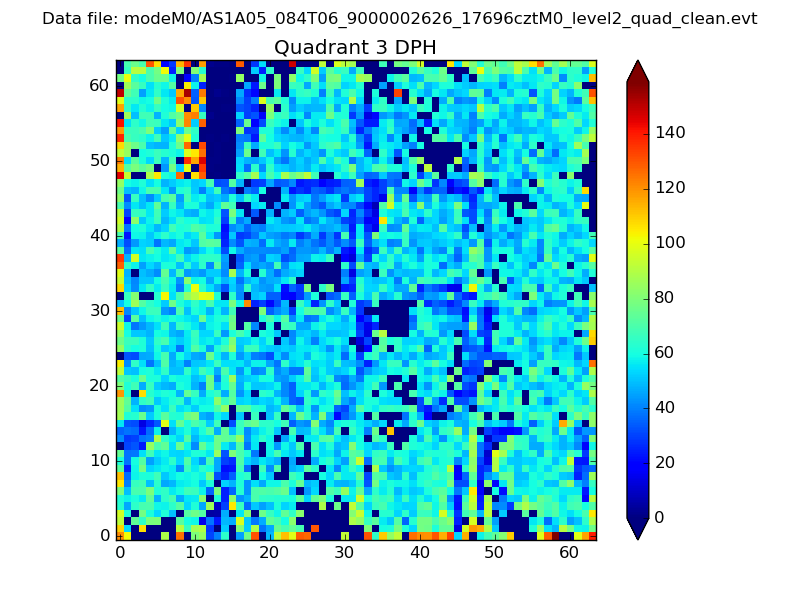 |
 |
Quadrant C |
| Plot type | Count rate plots | Images |
|---|---|---|
| Comparison with Poisson distribution Blue bars denote a histogram of data divided into 1 sec bins. Red curve is a Poisson curve with rate = median count rate of data. |
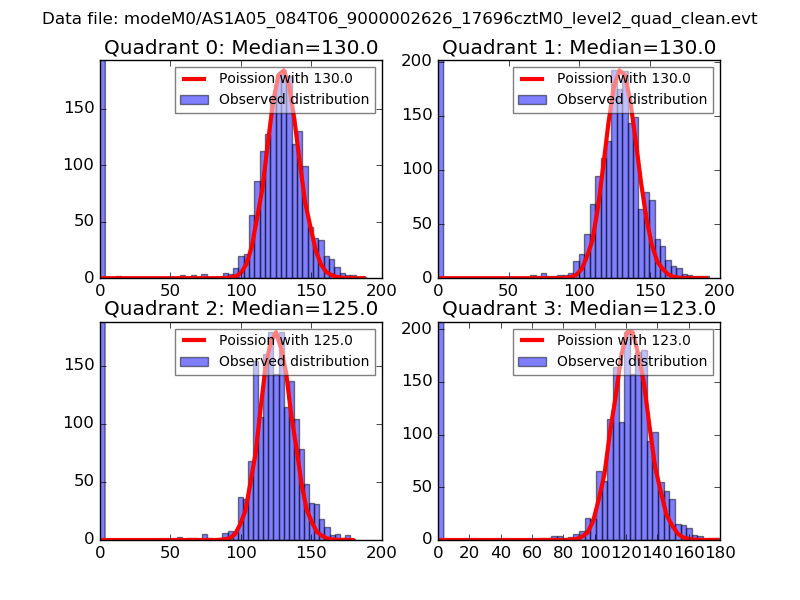 |
 |
| Quadrant-wise count rates Data is divided into 100 sec bins |
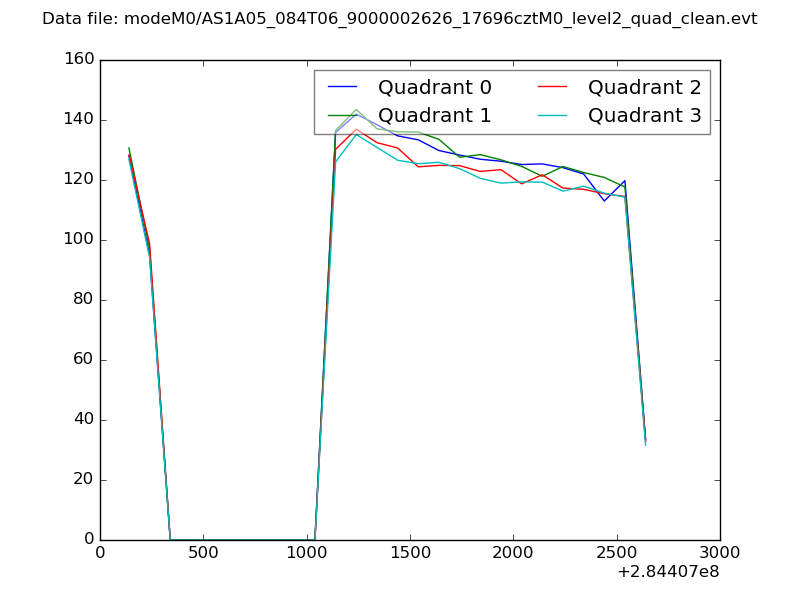 |
|
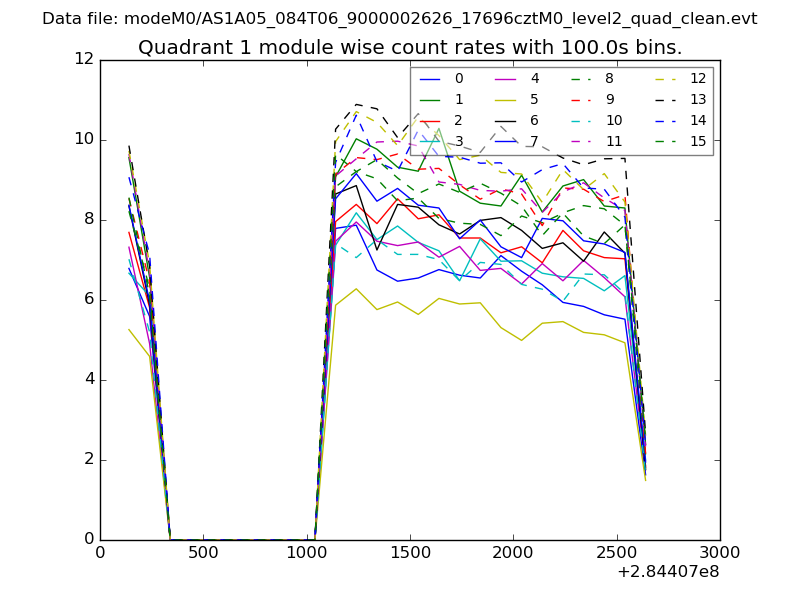
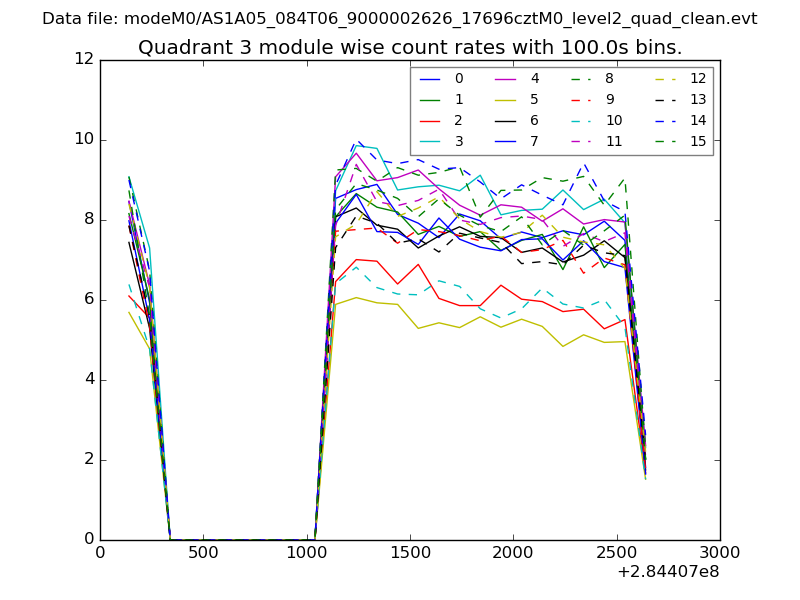
| Module-wise count rates for Quadrant A Data is divided into 100 sec bins |
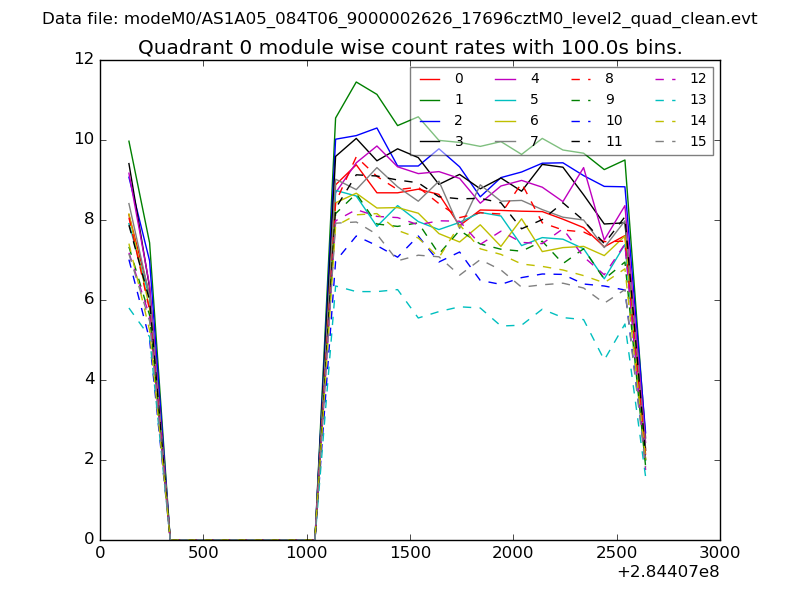 |
 |
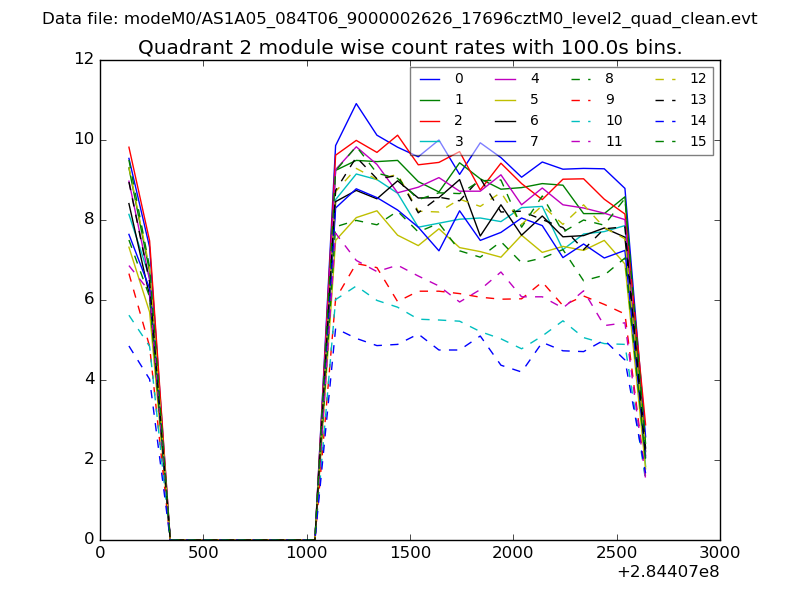
| Module-wise count rates for Quadrant B Data is divided into 100 sec bins |
 |
 |
| Module-wise count rates for Quadrant C Data is divided into 100 sec bins |
 |
 |
| Module-wise count rates for Quadrant D Data is divided into 100 sec bins |
 |
 |
| Parameter | Plot |
|---|---|
| CZT HV Monitor | 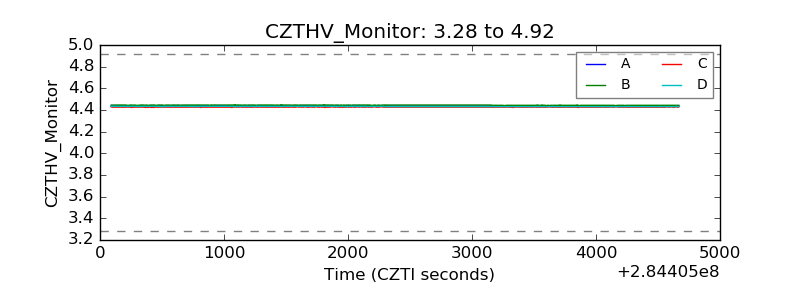 |
| D_VDD | 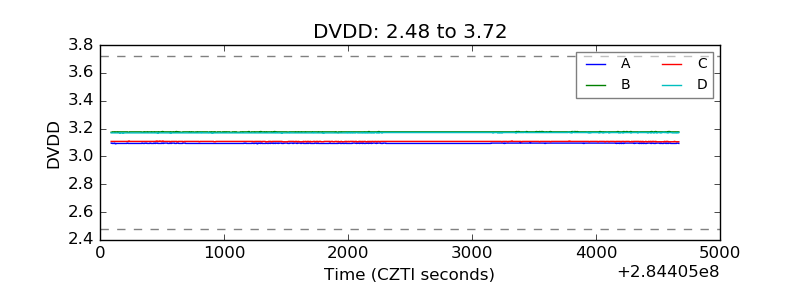 |
| Temperature 1 | 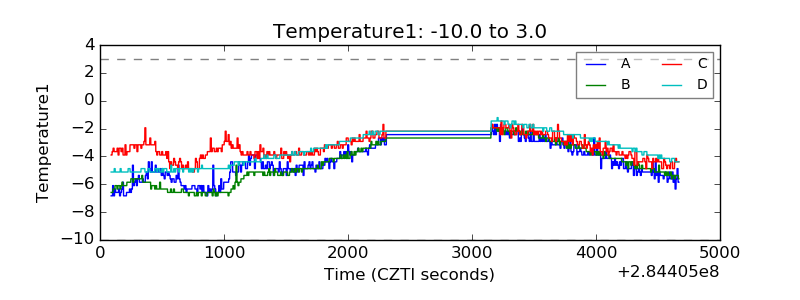 |
| Veto HV Monitor | 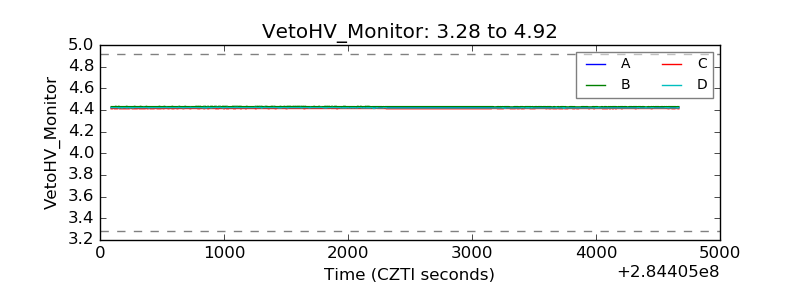 |
| Veto LLD | 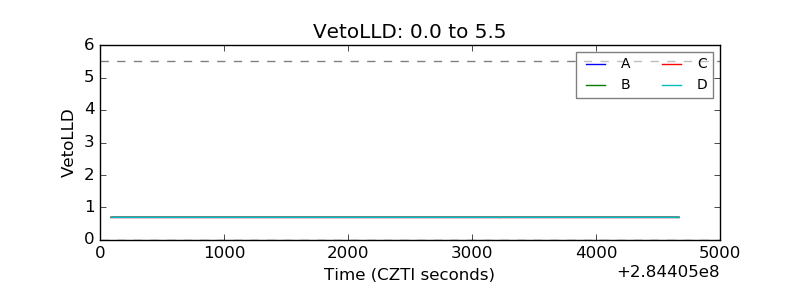 |
| Alpha Counter | 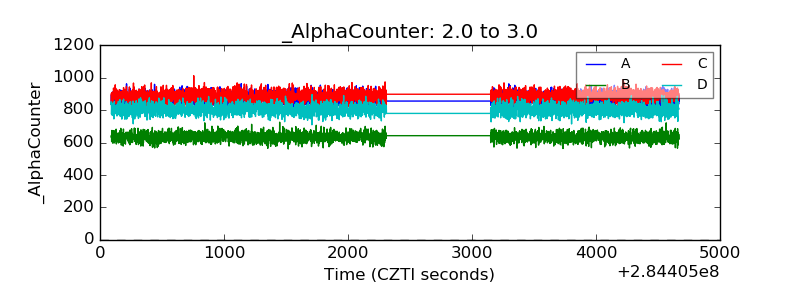 |
| _CPM_Rate | 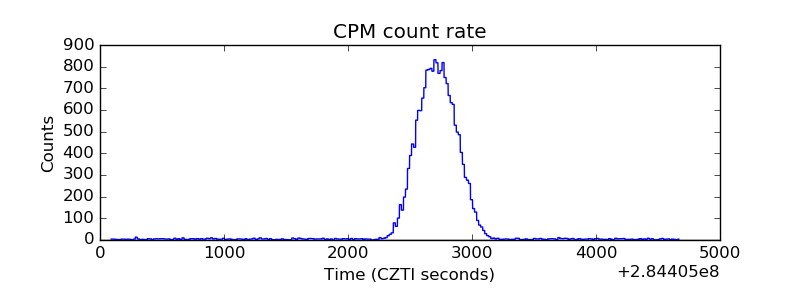 |
| CZT Counter | 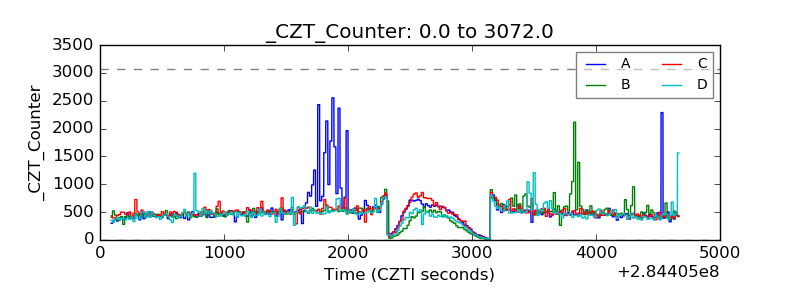 |
| +2.5 Volts monitor |  |
| +5 Volts monitor | 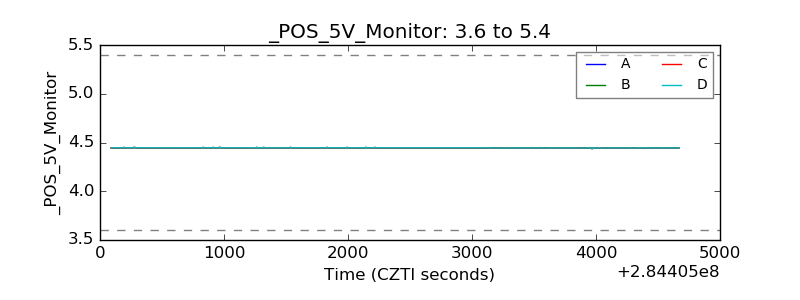 |
| _ROLL_ROT | 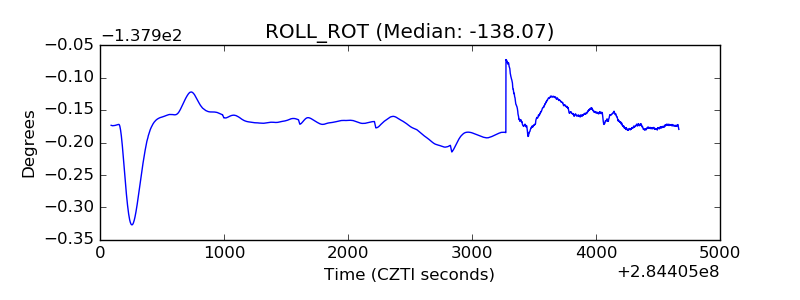 |
| _Roll_DEC |  |
| _Roll_RA | 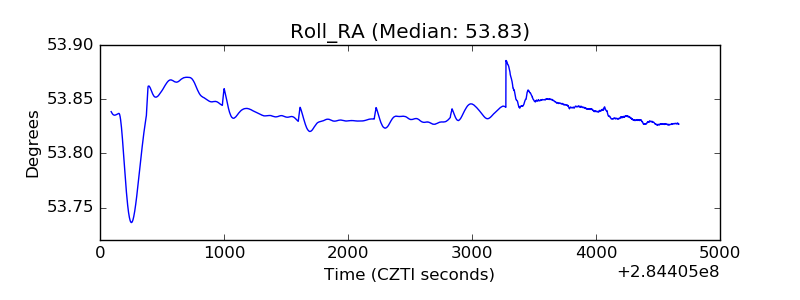 |
| Veto Counter | 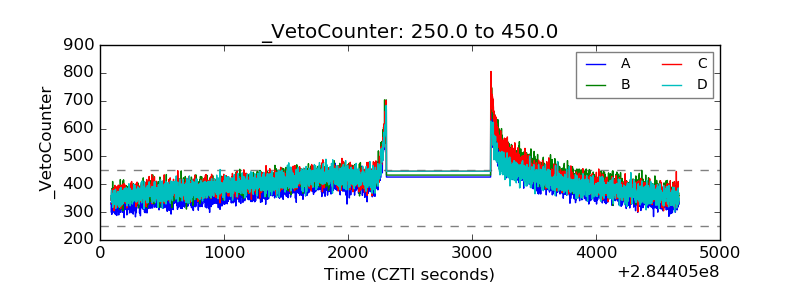 |