| Param | Original file | Final file |
|---|---|---|
| Filename | modeM0/AS1A05_084T06_9000002626_17697cztM0_level2.evt | modeM0/AS1A05_084T06_9000002626_17697cztM0_level2_quad_clean.evt |
| Size (bytes) | 622,059,840 | 99,751,680 |
| Size | 593.2 MB | 95.1 MB |
| Events in quadrant A | 4,996,148 | 611,020 |
| Events in quadrant B | 4,618,502 | 615,397 |
| Events in quadrant C | 4,425,265 | 590,043 |
| Events in quadrant D | 4,189,092 | 580,122 |
| Mode M9 | |||
|---|---|---|---|
| Quadrant | BADHDUFLAG | Total packets | Discarded packets |
| A | 0 | 18 | 0 |
| B | 0 | 18 | 0 |
| C | 0 | 18 | 0 |
| D | 0 | 18 | 0 |
| Mode M0 | |||
|---|---|---|---|
| Quadrant | BADHDUFLAG | Total packets | Discarded packets |
| A | 0 | 20945 | 3 |
| B | 0 | 19401 | 2 |
| C | 0 | 18631 | 2 |
| D | 0 | 18687 | 2 |
| Mode SS | |||
|---|---|---|---|
| Quadrant | BADHDUFLAG | Total packets | Discarded packets |
| A | 0 | 186 | 0 |
| B | 0 | 186 | 0 |
| C | 0 | 186 | 0 |
| D | 0 | 186 | 0 |
| Quadrant | Total seconds | Saturated seconds | Saturation percentage |
|---|---|---|---|
| A | 8987 | 241 | 2.681651% |
| B | 8987 | 92 | 1.023701% |
| C | 8987 | 93 | 1.034828% |
| D | 8987 | 40 | 0.445087% |
Noise dominated data is calculated using 1-second bins in cleaned event files. If a bin has >2000 counts, and if more than 50% of those come from <1% of pixels, then it is considered to be noise-dominated and hence unusable.
| Quadrant | # 1 sec bins | Bins with >0 counts | Bins with >2000 counts | High rate bins dominated by noise | Noise dominated (total time) | Noise dominated (detector-on time) | Marked lightcurve |
|---|---|---|---|---|---|---|---|
| A | 10812 | 8989 | 122 | 122 | 1.13% | 1.36% | 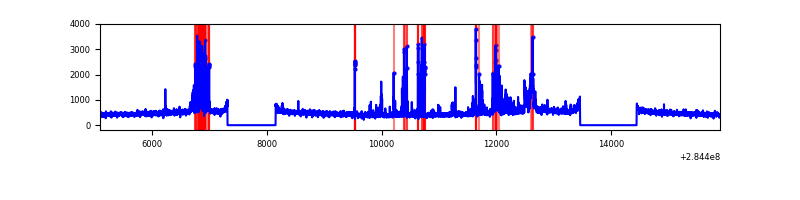 |
| B | 10812 | 8989 | 6 | 6 | 0.06% | 0.07% | 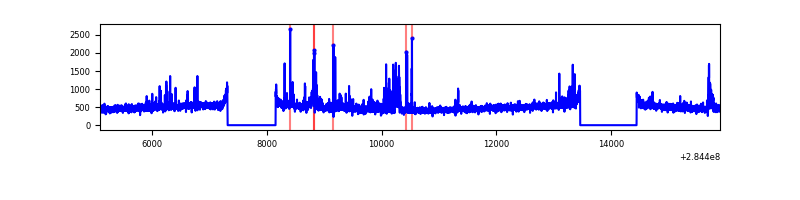 |
| C | 10812 | 8989 | 0 | 0 | 0.00% | 0.00% | 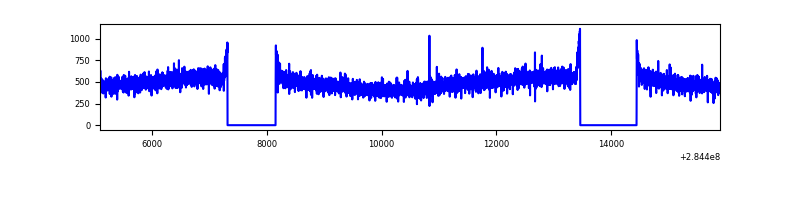 |
| D | 10812 | 8989 | 11 | 11 | 0.10% | 0.12% | 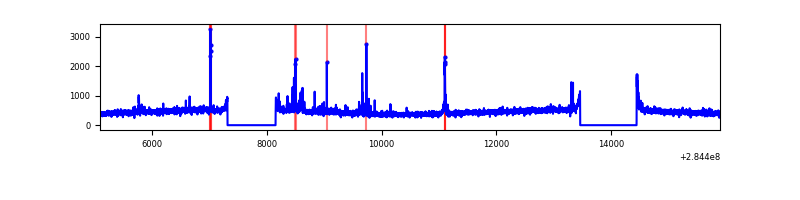 |
Top three noisy pixels from each quadrant. If the there are fewer than three noisy pixels in the level2.evt file, extra rows are filled as -1
| Pixel properties | Quadrant properties | ||||||
|---|---|---|---|---|---|---|---|
| Quadrant | DetID | PixID | Counts | Sigma | Mean | Median | Sigma |
| A | 15 | 174 | 844227 | 3847.98 | 1080 | 1056 | 219.1 |
| A | 0 | 226 | 9295 | 37.6 | 1080 | 1056 | 219.1 |
| A | 3 | 137 | 8303 | 33.07 | 1080 | 1056 | 219.1 |
| B | 0 | 229 | 196818 | 928.11 | 1094 | 1066 | 210.9 |
| B | 10 | 245 | 92968 | 435.73 | 1094 | 1066 | 210.9 |
| B | 0 | 189 | 41669 | 192.51 | 1094 | 1066 | 210.9 |
| C | 14 | 238 | 161101 | 651.3 | 1045 | 1053 | 245.7 |
| C | 3 | 233 | 131619 | 531.33 | 1045 | 1053 | 245.7 |
| C | 5 | 218 | 42927 | 170.4 | 1045 | 1053 | 245.7 |
| D | 7 | 238 | 46939 | 173.07 | 1051 | 1023 | 265.3 |
| D | 2 | 234 | 34746 | 127.11 | 1051 | 1023 | 265.3 |
| D | 10 | 70 | 34102 | 124.68 | 1051 | 1023 | 265.3 |
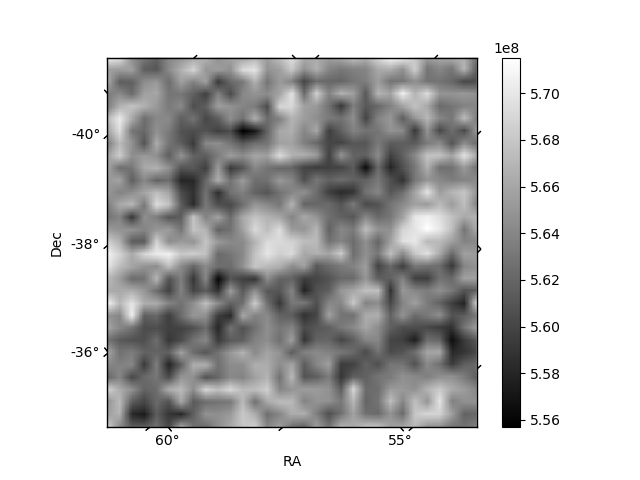
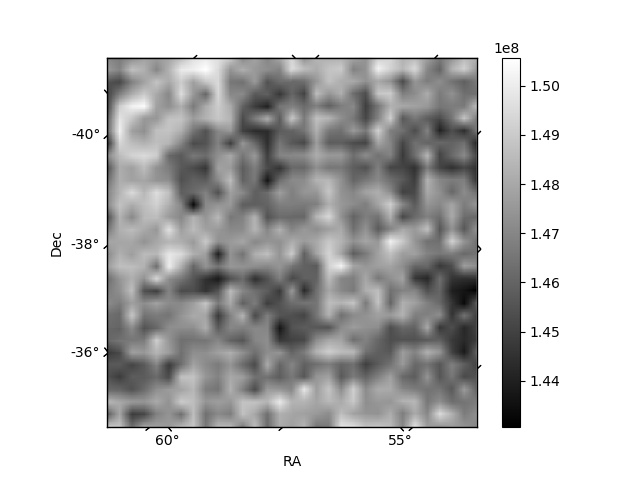
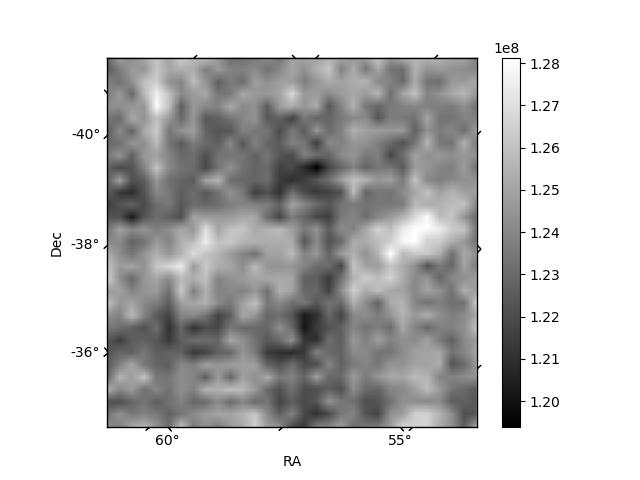
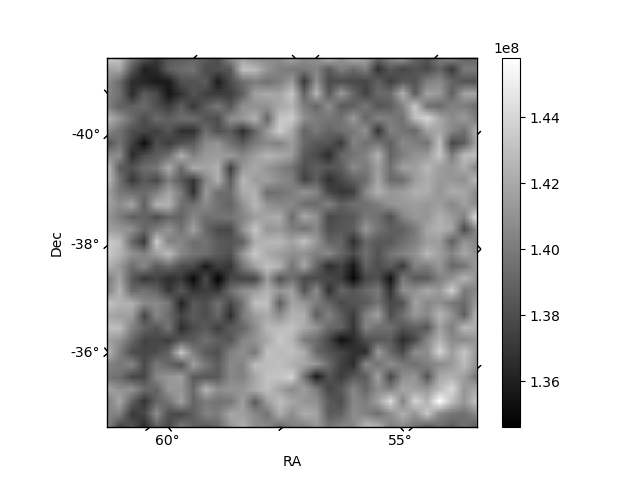
Histogram calculated using DETX and DETY for each event in the final _common_clean file
| Quadrant A | 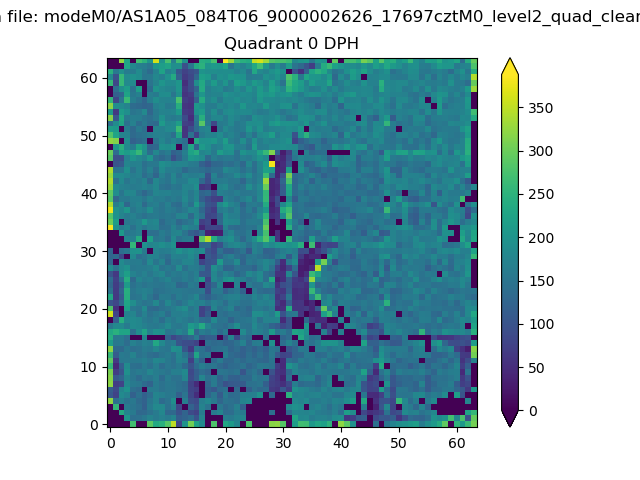 |
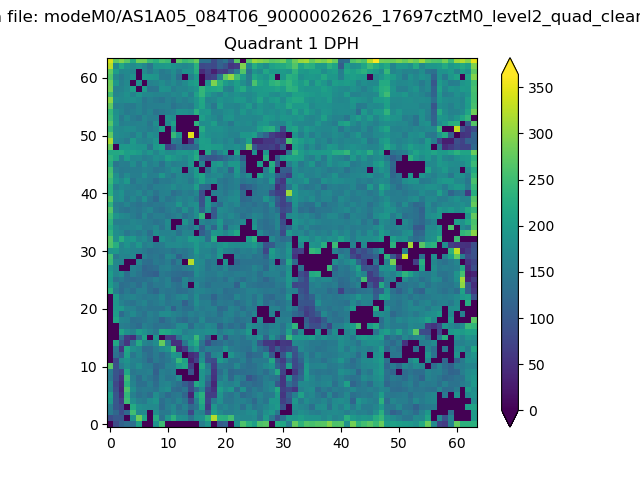 |
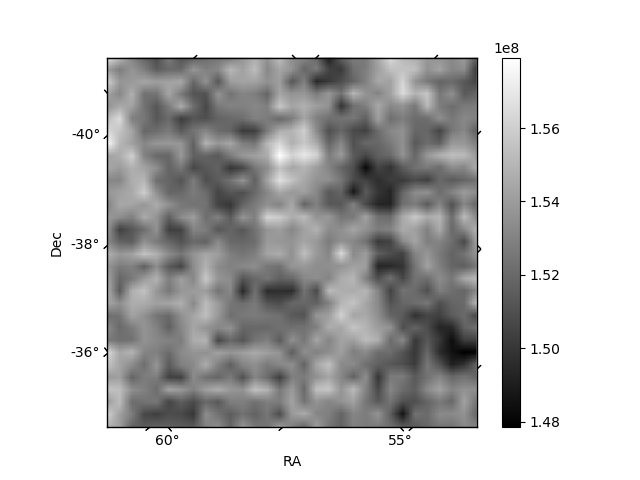
Quadrant B |
|---|---|---|---|
| Quadrant D | 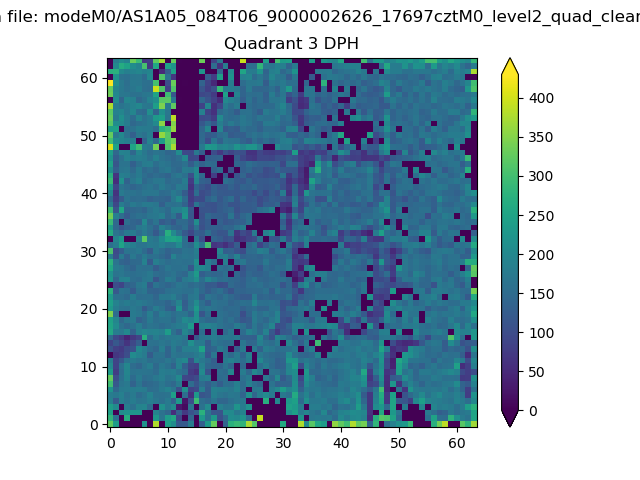 |
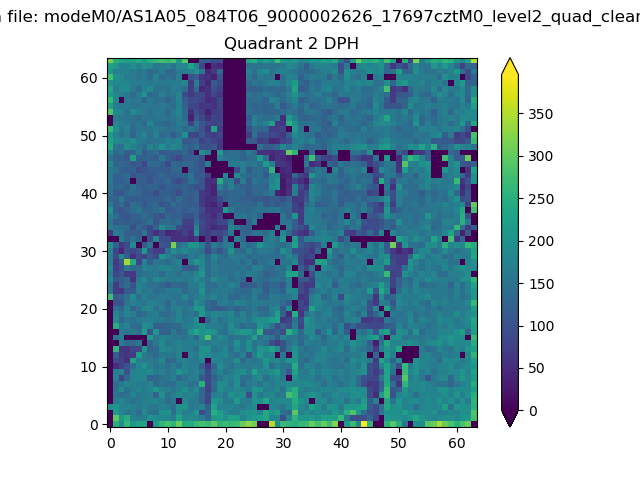 |
Quadrant C |
| Plot type | Count rate plots | Images |
|---|---|---|
| Comparison with Poisson distribution Blue bars denote a histogram of data divided into 1 sec bins. Red curve is a Poisson curve with rate = median count rate of data. |
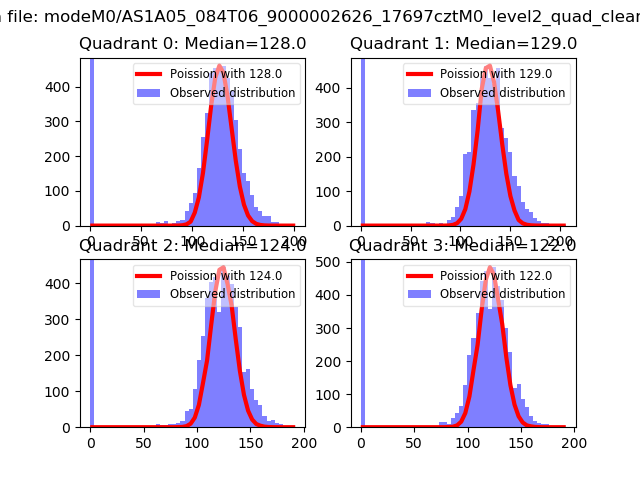 |
 |
| Quadrant-wise count rates Data is divided into 100 sec bins |
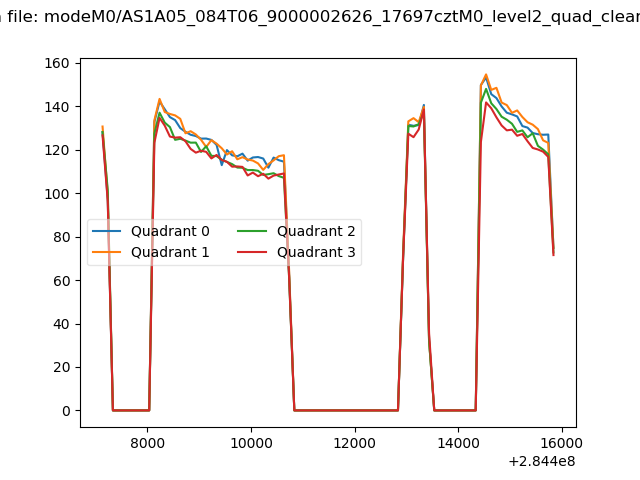 |
|
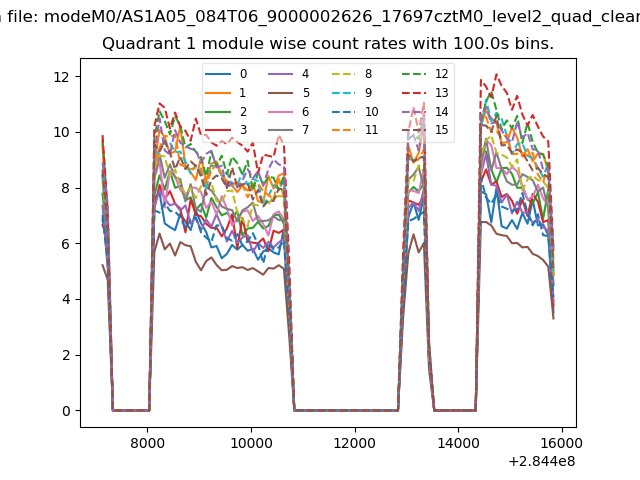
| Module-wise count rates for Quadrant A Data is divided into 100 sec bins |
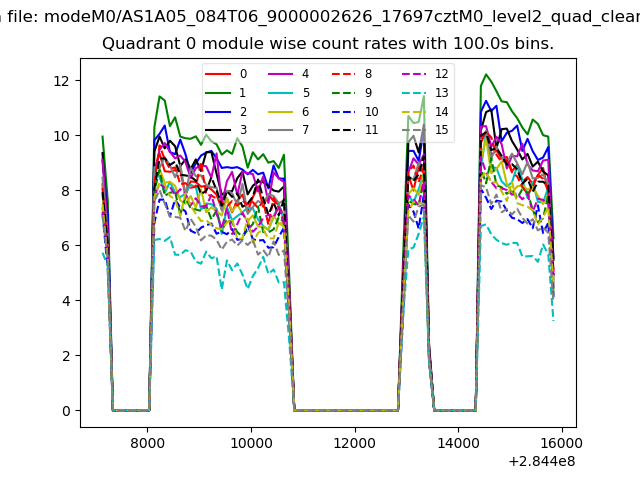 |
 |
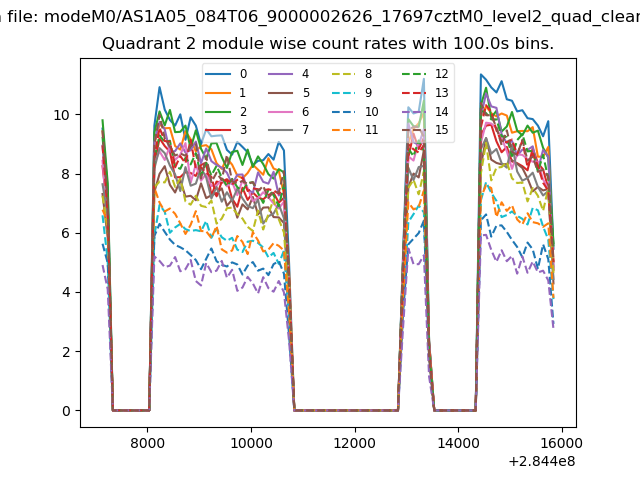
| Module-wise count rates for Quadrant B Data is divided into 100 sec bins |
 |
 |
| Module-wise count rates for Quadrant C Data is divided into 100 sec bins |
 |
 |
| Module-wise count rates for Quadrant D Data is divided into 100 sec bins |
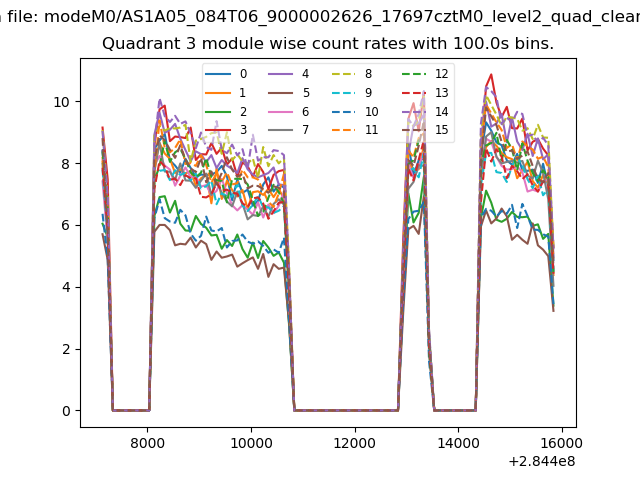 |
 |
| Parameter | Plot |
|---|---|
| CZT HV Monitor | 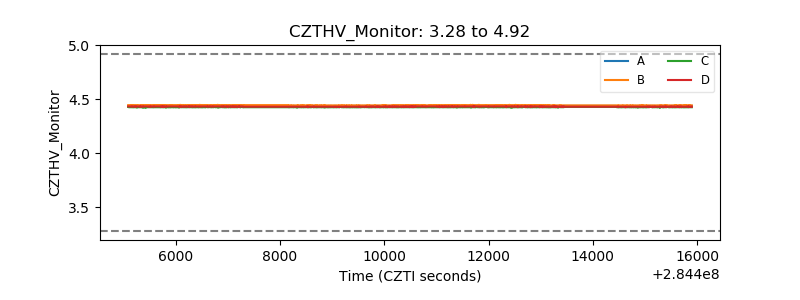 |
| D_VDD | 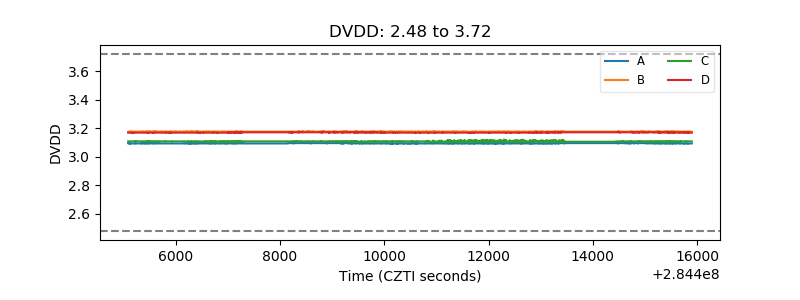 |
| Temperature 1 | 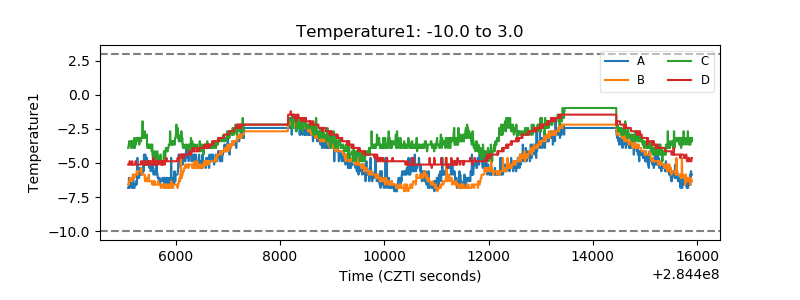 |
| Veto HV Monitor | 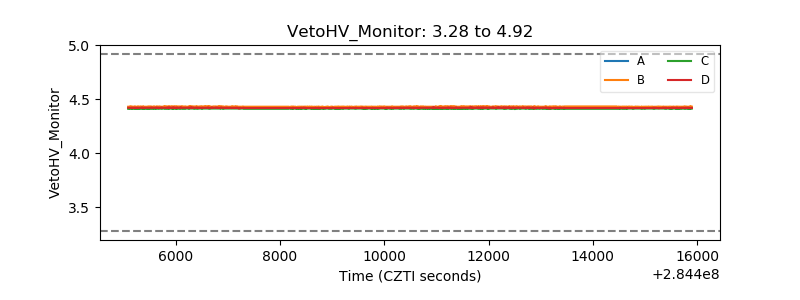 |
| Veto LLD | 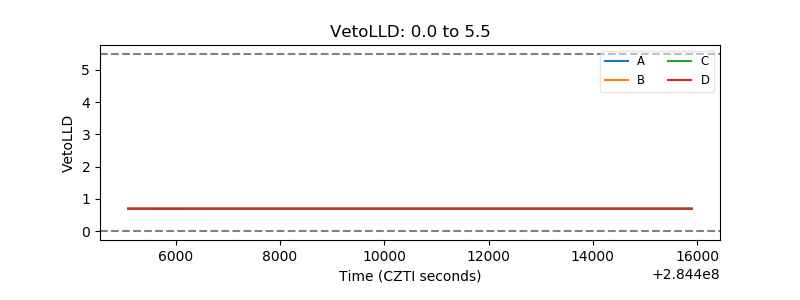 |
| Alpha Counter | 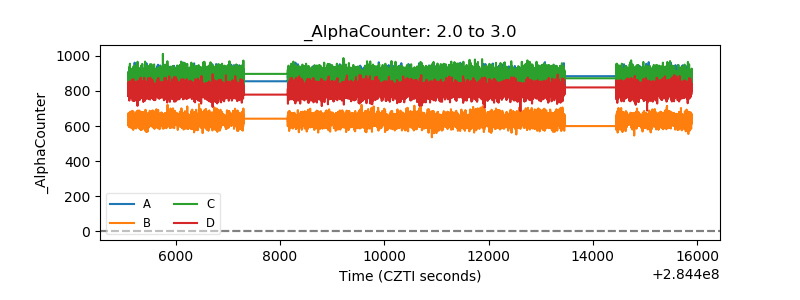 |
| _CPM_Rate | 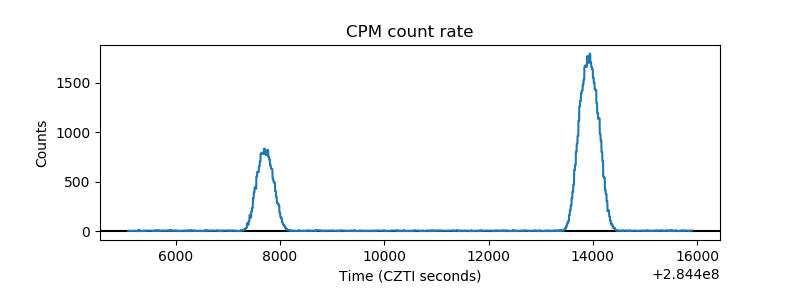 |
| CZT Counter | 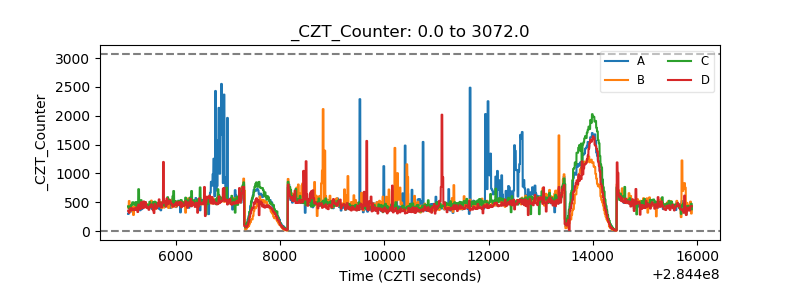 |
| +2.5 Volts monitor |  |
| +5 Volts monitor |  |
| _ROLL_ROT | 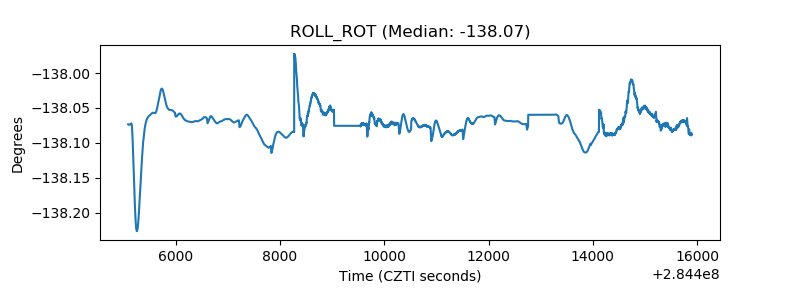 |
| _Roll_DEC | 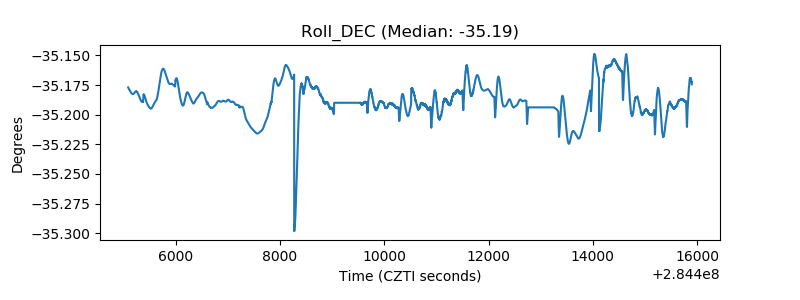 |
| _Roll_RA | 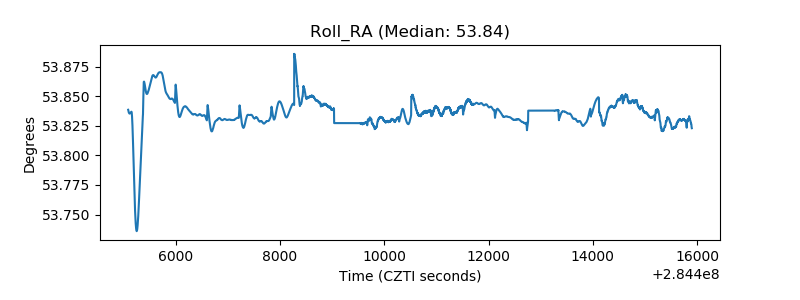 |
| Veto Counter | 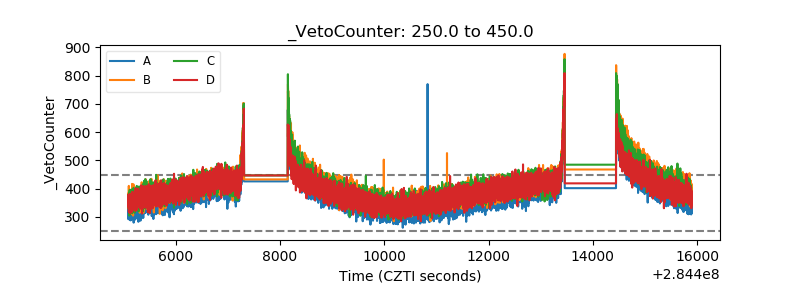 |