| Param | Original file | Final file |
|---|---|---|
| Filename | modeM0/AS1A05_084T06_9000002626_17699cztM0_level2.evt | modeM0/AS1A05_084T06_9000002626_17699cztM0_level2_quad_clean.evt |
| Size (bytes) | 132,307,200 | 38,813,760 |
| Size | 126.2 MB | 37.0 MB |
| Events in quadrant A | 949,678 | 263,537 |
| Events in quadrant B | 1,031,462 | 266,403 |
| Events in quadrant C | 974,082 | 254,165 |
| Events in quadrant D | 915,400 | 247,937 |
| Mode M9 | |||
|---|---|---|---|
| Quadrant | BADHDUFLAG | Total packets | Discarded packets |
| A | 0 | 10 | 0 |
| B | 0 | 10 | 0 |
| C | 0 | 10 | 0 |
| D | 0 | 10 | 0 |
| Mode M0 | |||
|---|---|---|---|
| Quadrant | BADHDUFLAG | Total packets | Discarded packets |
| A | 0 | 4153 | 1 |
| B | 0 | 4331 | 1 |
| C | 0 | 4134 | 1 |
| D | 0 | 4130 | 1 |
| Mode SS | |||
|---|---|---|---|
| Quadrant | BADHDUFLAG | Total packets | Discarded packets |
| A | 0 | 42 | 0 |
| B | 0 | 42 | 0 |
| C | 0 | 42 | 0 |
| D | 0 | 42 | 0 |
| Quadrant | Total seconds | Saturated seconds | Saturation percentage |
|---|---|---|---|
| A | 1964 | 29 | 1.476578% |
| B | 1964 | 37 | 1.883910% |
| C | 1964 | 33 | 1.680244% |
| D | 1964 | 28 | 1.425662% |
Noise dominated data is calculated using 1-second bins in cleaned event files. If a bin has >2000 counts, and if more than 50% of those come from <1% of pixels, then it is considered to be noise-dominated and hence unusable.
| Quadrant | # 1 sec bins | Bins with >0 counts | Bins with >2000 counts | High rate bins dominated by noise | Noise dominated (total time) | Noise dominated (detector-on time) | Marked lightcurve |
|---|---|---|---|---|---|---|---|
| A | 2949 | 1965 | 0 | 0 | 0.00% | 0.00% | 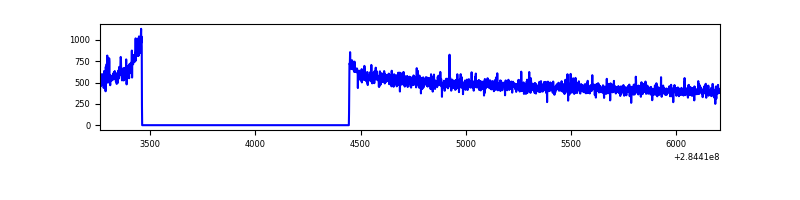 |
| B | 2949 | 1965 | 0 | 0 | 0.00% | 0.00% | 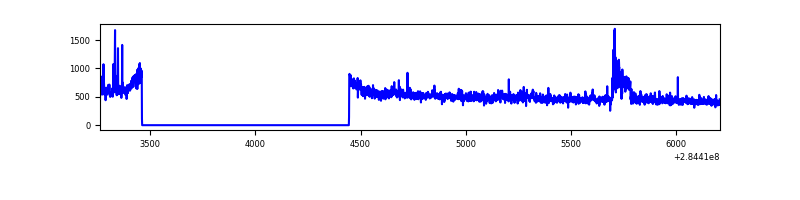 |
| C | 2949 | 1965 | 0 | 0 | 0.00% | 0.00% | 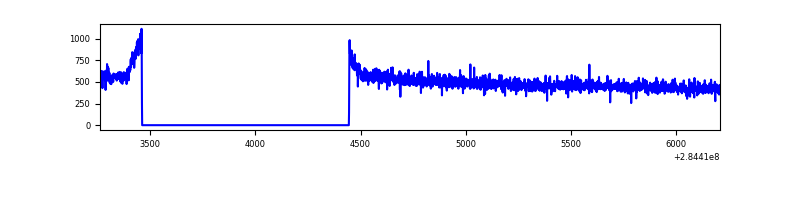 |
| D | 2949 | 1965 | 0 | 0 | 0.00% | 0.00% | 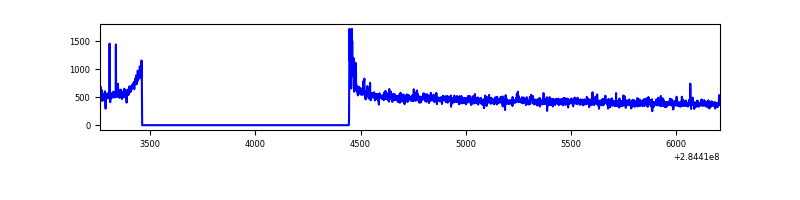 |
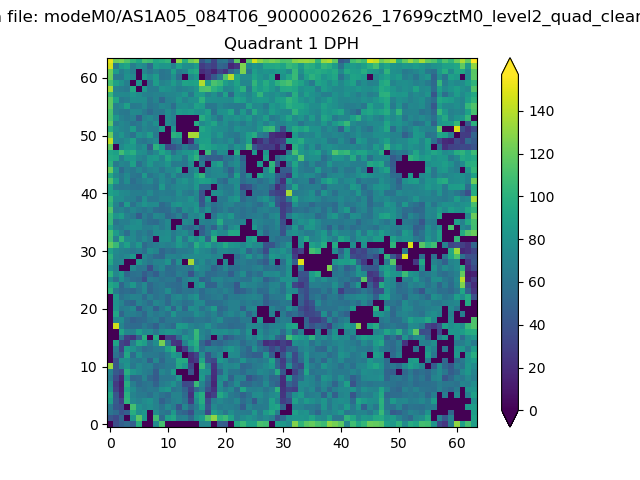
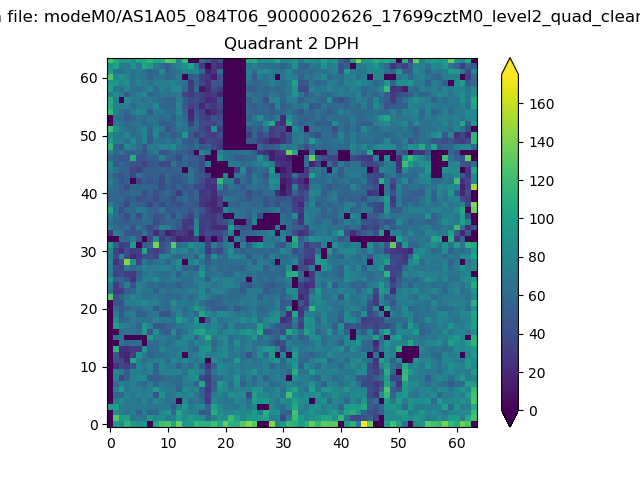
Top three noisy pixels from each quadrant. If the there are fewer than three noisy pixels in the level2.evt file, extra rows are filled as -1
| Pixel properties | Quadrant properties | ||||||
|---|---|---|---|---|---|---|---|
| Quadrant | DetID | PixID | Counts | Sigma | Mean | Median | Sigma |
| A | 15 | 174 | 7835 | 150.0 | 245 | 240 | 50.6 |
| A | 0 | 226 | 2159 | 37.9 | 245 | 240 | 50.6 |
| A | 3 | 137 | 1881 | 32.41 | 245 | 240 | 50.6 |
| B | 10 | 245 | 40571 | 837.78 | 245 | 240 | 48.1 |
| B | 0 | 189 | 9485 | 192.04 | 245 | 240 | 48.1 |
| B | 0 | 244 | 7477 | 150.33 | 245 | 240 | 48.1 |
| C | 14 | 238 | 35809 | 634.1 | 230 | 232 | 56.1 |
| C | 3 | 233 | 27155 | 479.85 | 230 | 232 | 56.1 |
| C | 5 | 218 | 9269 | 161.07 | 230 | 232 | 56.1 |
| D | 7 | 38 | 21190 | 365.01 | 232 | 225 | 57.4 |
| D | 2 | 234 | 7533 | 127.23 | 232 | 225 | 57.4 |
| D | 11 | 241 | 5216 | 86.9 | 232 | 225 | 57.4 |
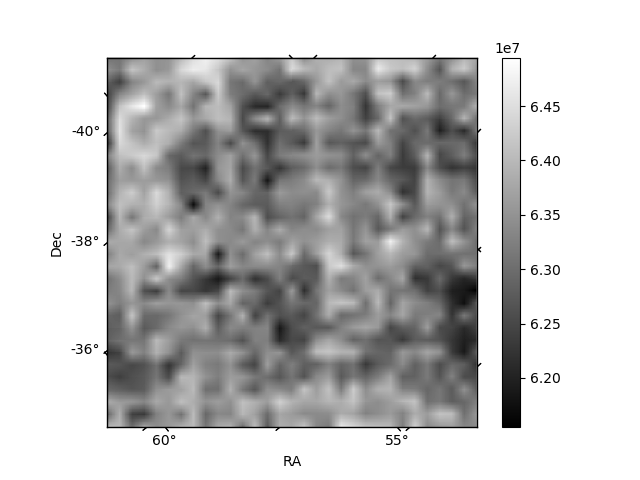
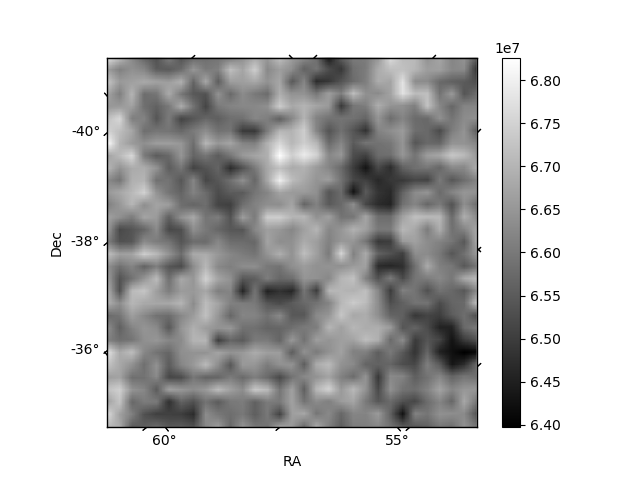
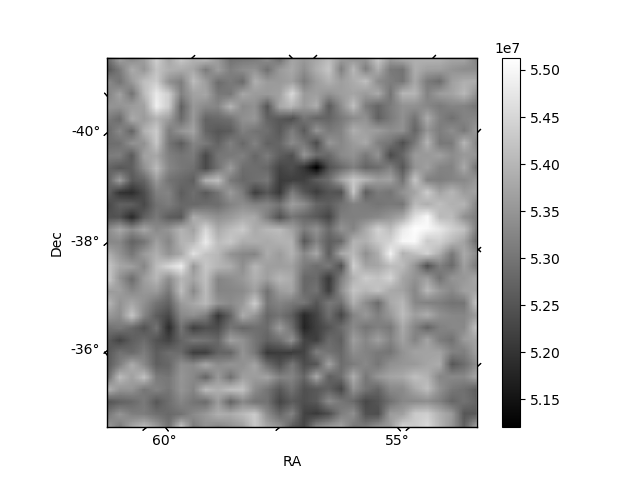
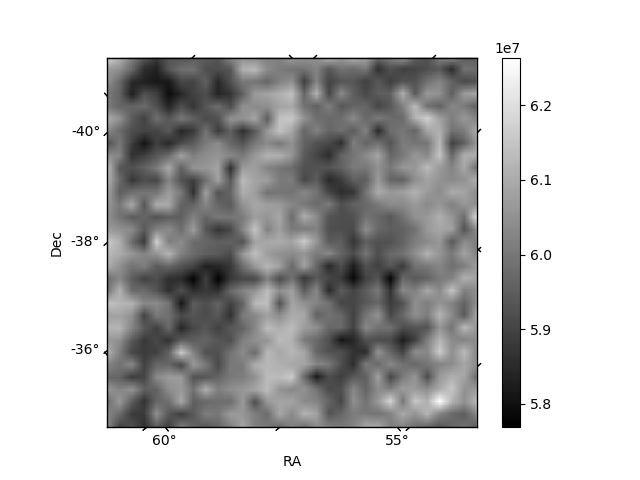
Histogram calculated using DETX and DETY for each event in the final _common_clean file
| Quadrant A | 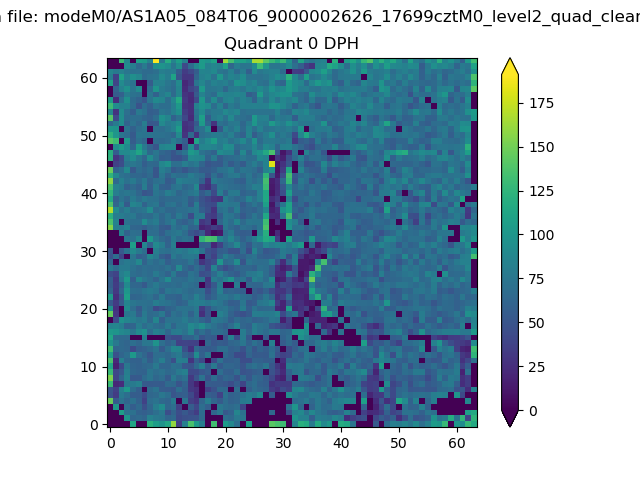 |
 |
Quadrant B |
|---|---|---|---|
| Quadrant D | 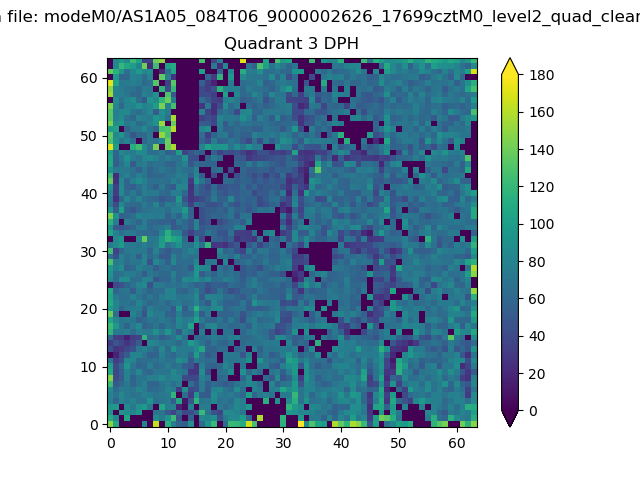 |
 |
Quadrant C |
| Plot type | Count rate plots | Images |
|---|---|---|
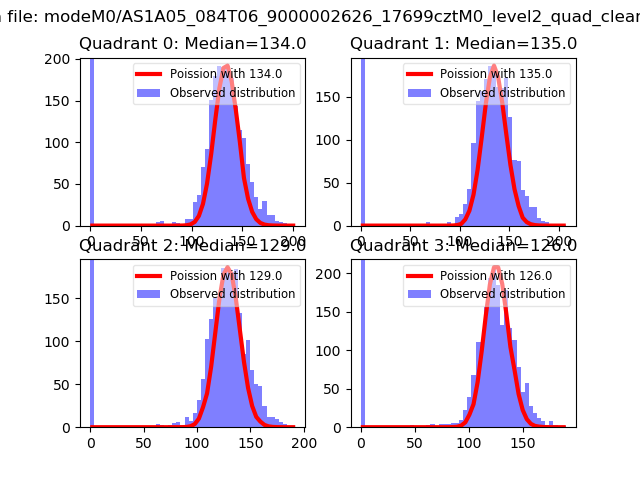
| Comparison with Poisson distribution Blue bars denote a histogram of data divided into 1 sec bins. Red curve is a Poisson curve with rate = median count rate of data. |
 |
 |
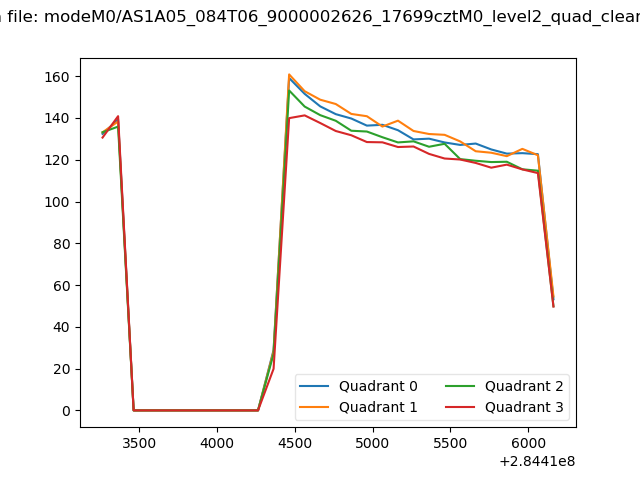
| Quadrant-wise count rates Data is divided into 100 sec bins |
 |
|
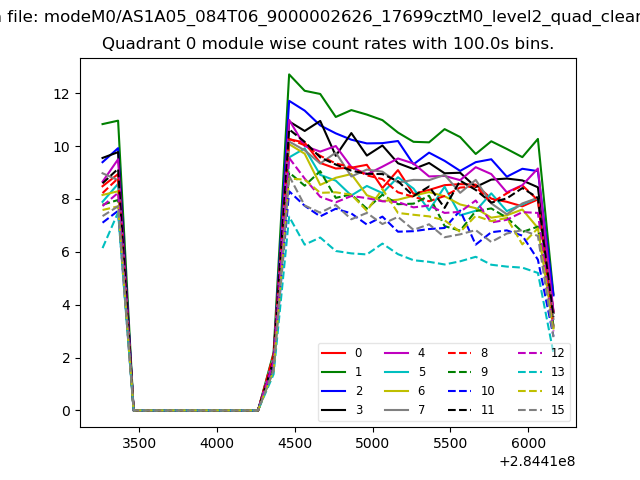
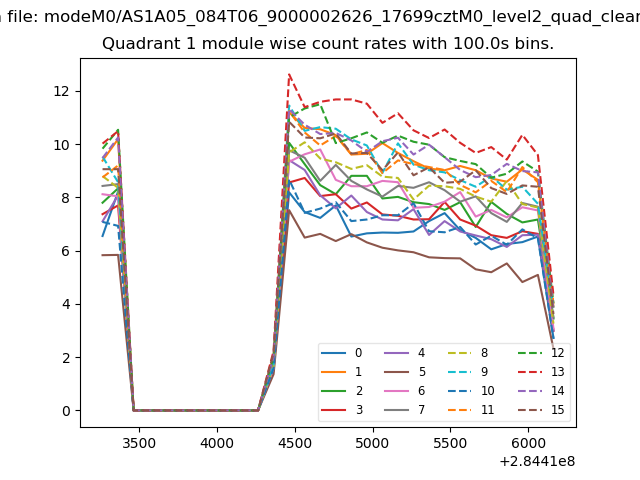
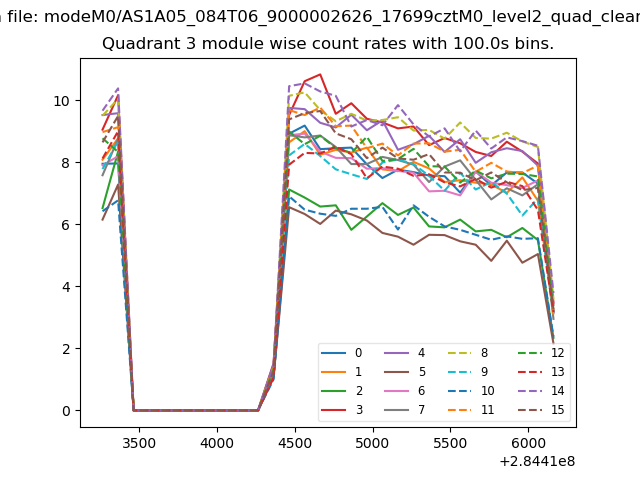
| Module-wise count rates for Quadrant A Data is divided into 100 sec bins |
 |
 |
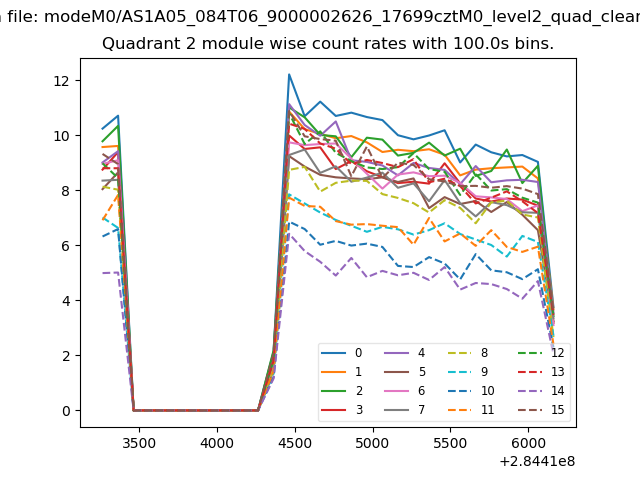
| Module-wise count rates for Quadrant B Data is divided into 100 sec bins |
 |
 |
| Module-wise count rates for Quadrant C Data is divided into 100 sec bins |
 |
 |
| Module-wise count rates for Quadrant D Data is divided into 100 sec bins |
 |
 |
| Parameter | Plot |
|---|---|
| CZT HV Monitor | 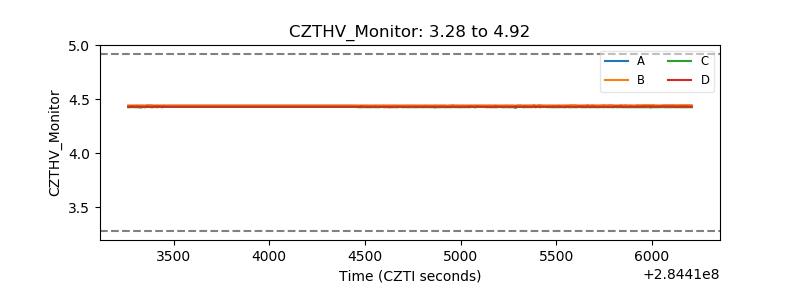 |
| D_VDD | 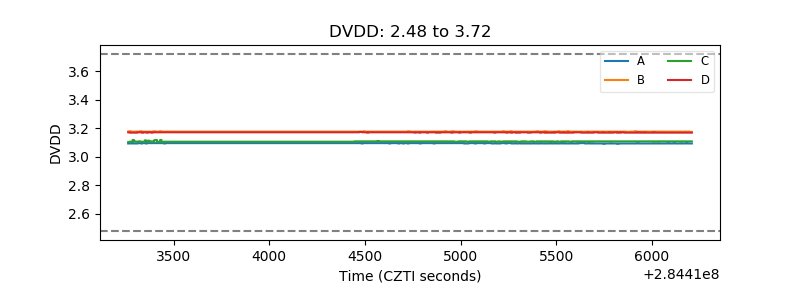 |
| Temperature 1 | 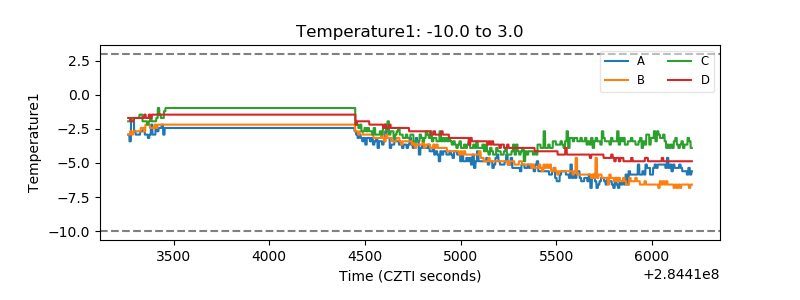 |
| Veto HV Monitor | 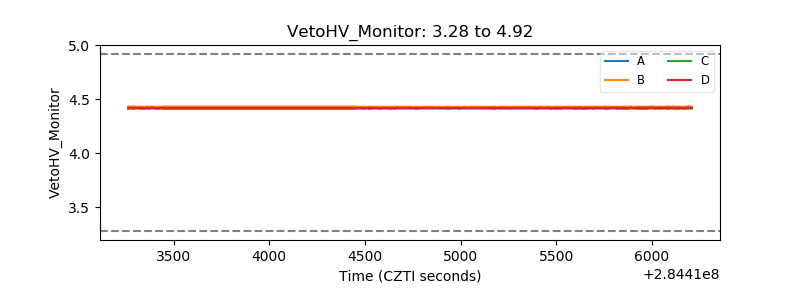 |
| Veto LLD | 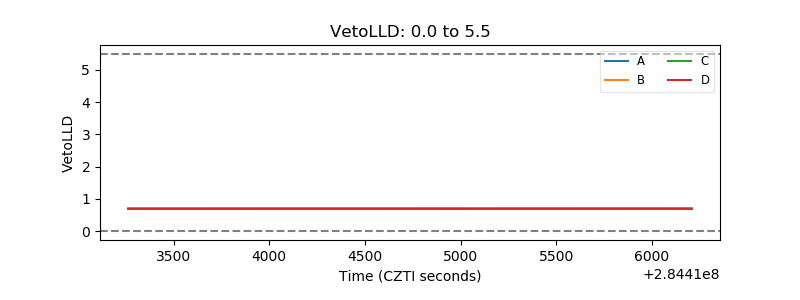 |
| Alpha Counter | 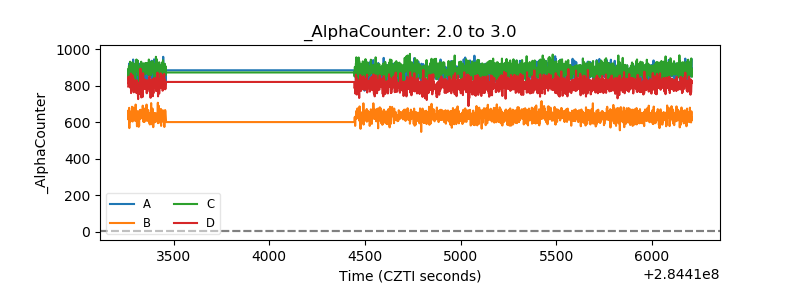 |
| _CPM_Rate | 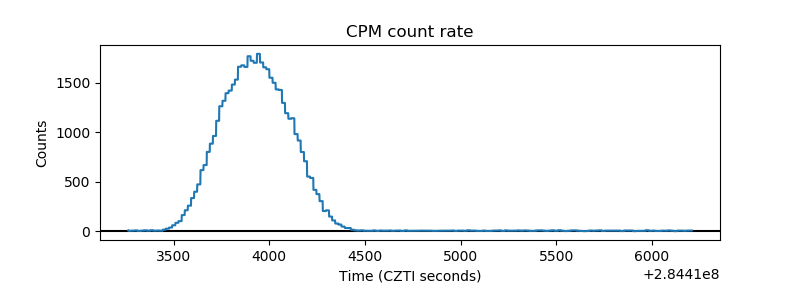 |
| CZT Counter | 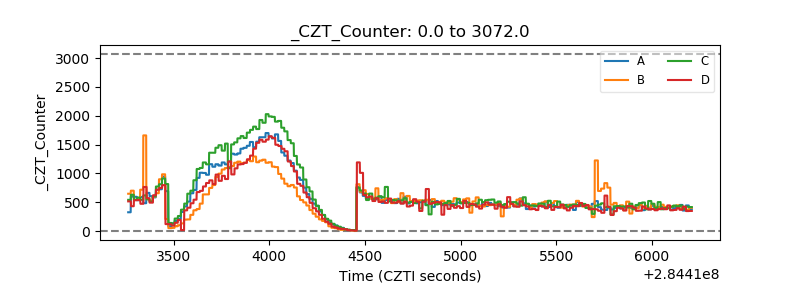 |
| +2.5 Volts monitor |  |
| +5 Volts monitor |  |
| _ROLL_ROT |  |
| _Roll_DEC | 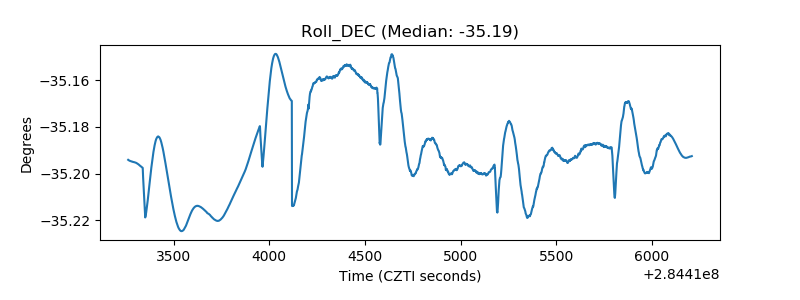 |
| _Roll_RA | 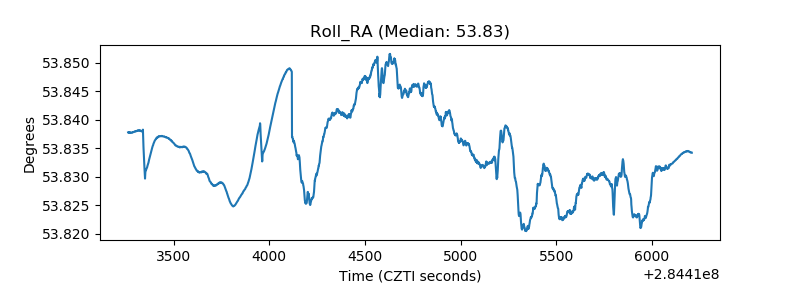 |
| Veto Counter | 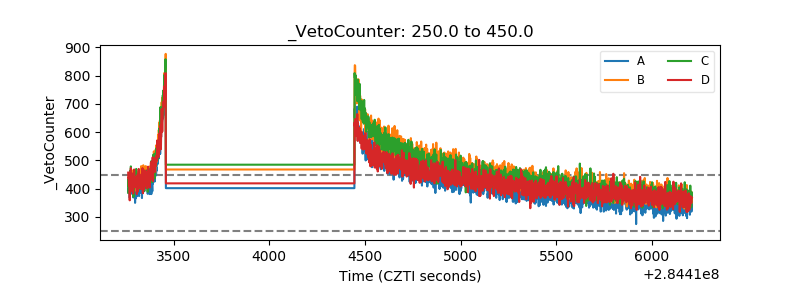 |