| Param | Original file | Final file |
|---|---|---|
| Filename | modeM0/AS1A05_186T02_9000002624_17687cztM0_level2.evt | modeM0/AS1A05_186T02_9000002624_17687cztM0_level2_quad_clean.evt |
| Size (bytes) | 27,933,120 | 9,296,640 |
| Size | 26.6 MB | 8.9 MB |
| Events in quadrant A | 203,194 | 61,360 |
| Events in quadrant B | 207,004 | 63,312 |
| Events in quadrant C | 211,765 | 59,745 |
| Events in quadrant D | 190,452 | 57,777 |
| Mode M0 | |||
|---|---|---|---|
| Quadrant | BADHDUFLAG | Total packets | Discarded packets |
| A | 0 | 888 | 0 |
| B | 0 | 884 | 0 |
| C | 0 | 888 | 0 |
| D | 0 | 882 | 1 |
| Mode SS | |||
|---|---|---|---|
| Quadrant | BADHDUFLAG | Total packets | Discarded packets |
| A | 0 | 8 | 0 |
| B | 0 | 8 | 0 |
| C | 0 | 8 | 0 |
| D | 0 | 8 | 0 |
| Quadrant | Total seconds | Saturated seconds | Saturation percentage |
|---|---|---|---|
| A | 442 | 0 | 0.000000% |
| B | 442 | 0 | 0.000000% |
| C | 442 | 1 | 0.226244% |
| D | 441 | 0 | 0.000000% |
Noise dominated data is calculated using 1-second bins in cleaned event files. If a bin has >2000 counts, and if more than 50% of those come from <1% of pixels, then it is considered to be noise-dominated and hence unusable.
| Quadrant | # 1 sec bins | Bins with >0 counts | Bins with >2000 counts | High rate bins dominated by noise | Noise dominated (total time) | Noise dominated (detector-on time) | Marked lightcurve |
|---|---|---|---|---|---|---|---|
| A | 442 | 442 | 0 | 0 | 0.00% | 0.00% | 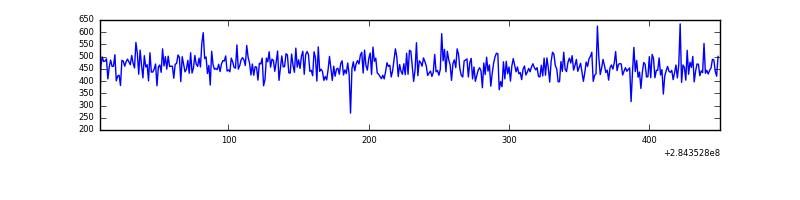 |
| B | 442 | 442 | 0 | 0 | 0.00% | 0.00% | 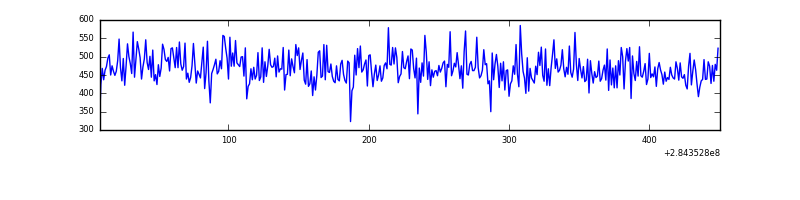 |
| C | 442 | 442 | 0 | 0 | 0.00% | 0.00% | 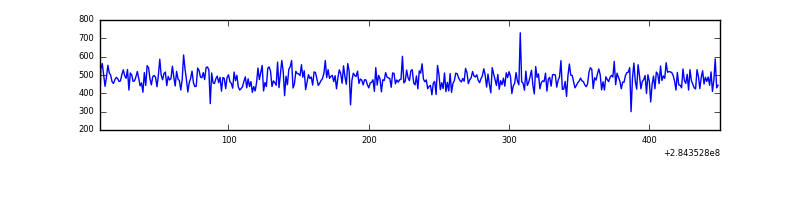 |
| D | 441 | 441 | 0 | 0 | 0.00% | 0.00% | 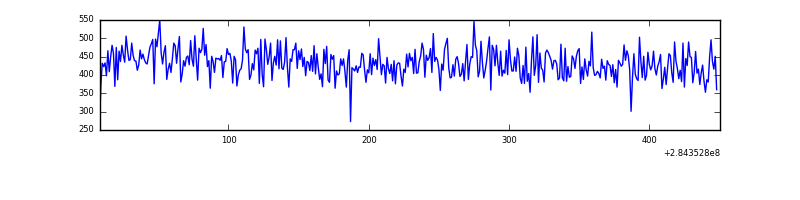 |
Top three noisy pixels from each quadrant. If the there are fewer than three noisy pixels in the level2.evt file, extra rows are filled as -1
| Pixel properties | Quadrant properties | ||||||
|---|---|---|---|---|---|---|---|
| Quadrant | DetID | PixID | Counts | Sigma | Mean | Median | Sigma |
| A | 0 | 226 | 463 | 32.61 | 52 | 51 | 12.6 |
| A | 12 | 194 | 412 | 28.57 | 52 | 51 | 12.6 |
| A | 3 | 137 | 372 | 25.41 | 52 | 51 | 12.6 |
| B | 12 | 111 | 1136 | 90.15 | 52 | 51 | 12.0 |
| B | 10 | 245 | 1015 | 80.1 | 52 | 51 | 12.0 |
| B | 11 | 111 | 982 | 77.35 | 52 | 51 | 12.0 |
| C | 14 | 238 | 8260 | 601.31 | 50 | 50 | 13.7 |
| C | 3 | 233 | 5912 | 429.34 | 50 | 50 | 13.7 |
| C | 5 | 218 | 1695 | 120.48 | 50 | 50 | 13.7 |
| D | 2 | 152 | 1544 | 106.59 | 49 | 48 | 14.0 |
| D | 2 | 234 | 1532 | 105.74 | 49 | 48 | 14.0 |
| D | 13 | 170 | 761 | 50.8 | 49 | 48 | 14.0 |
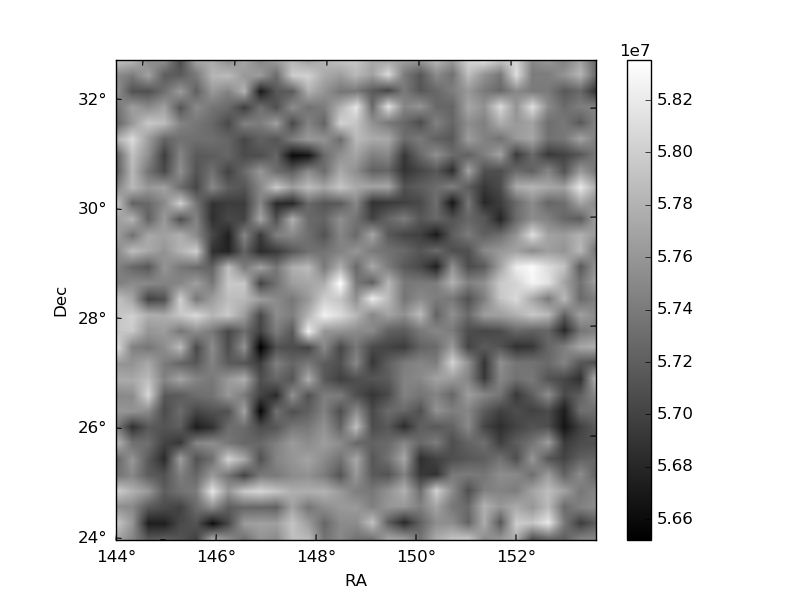
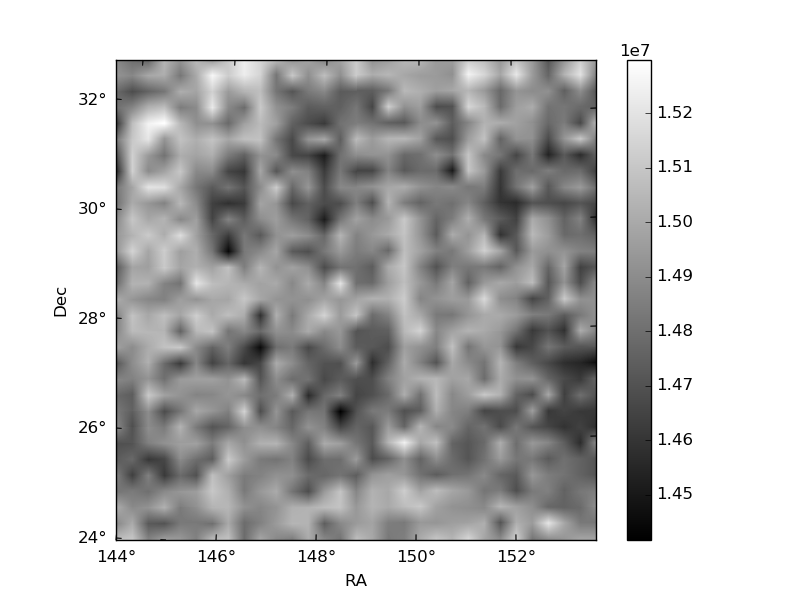
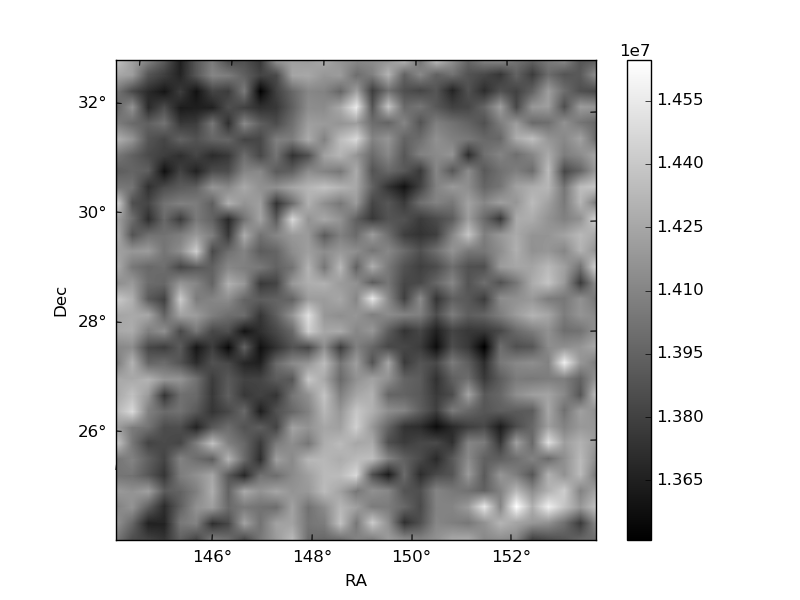
Histogram calculated using DETX and DETY for each event in the final _common_clean file
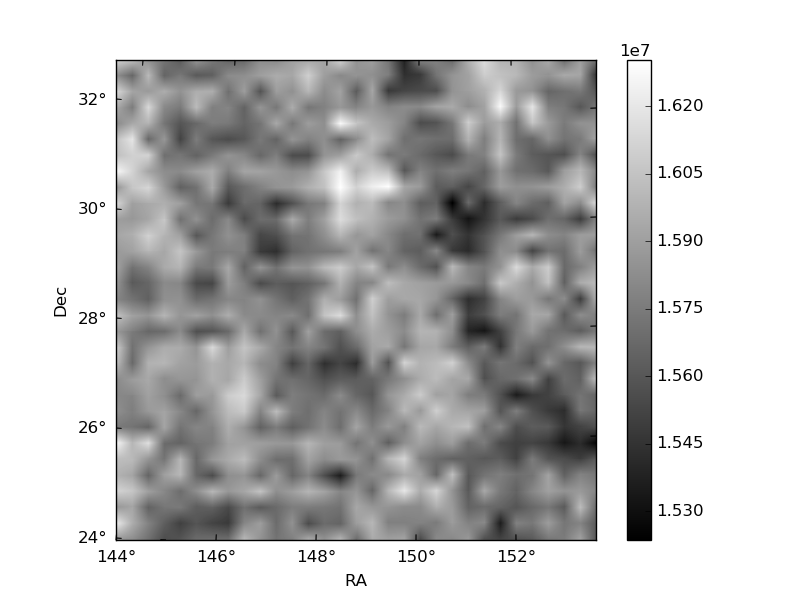
| Quadrant A | 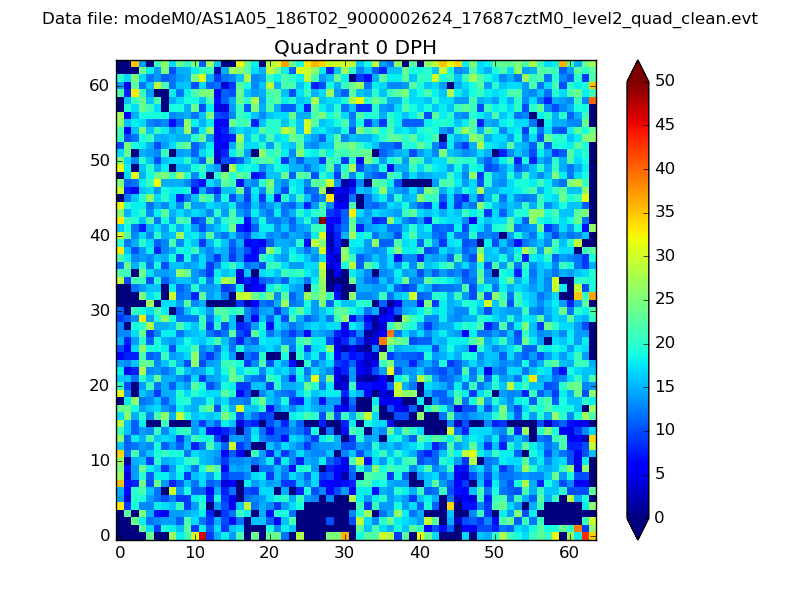 |
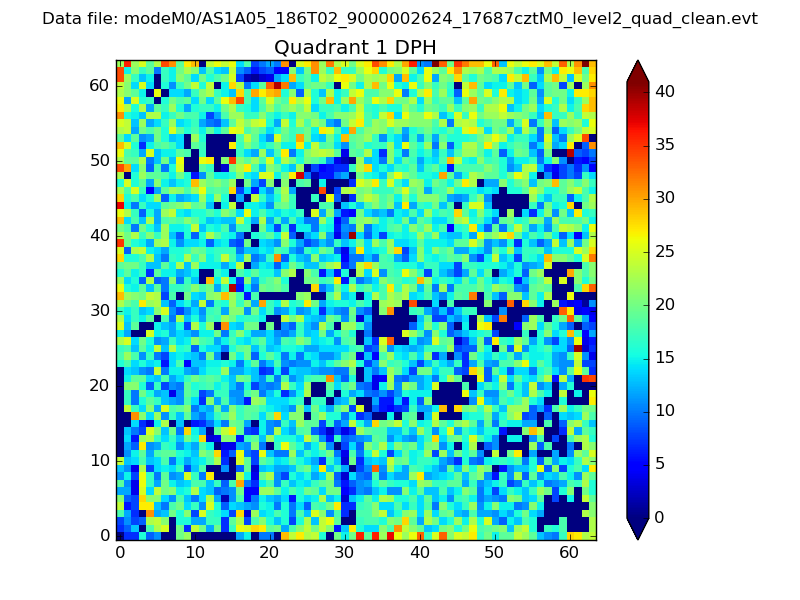 |
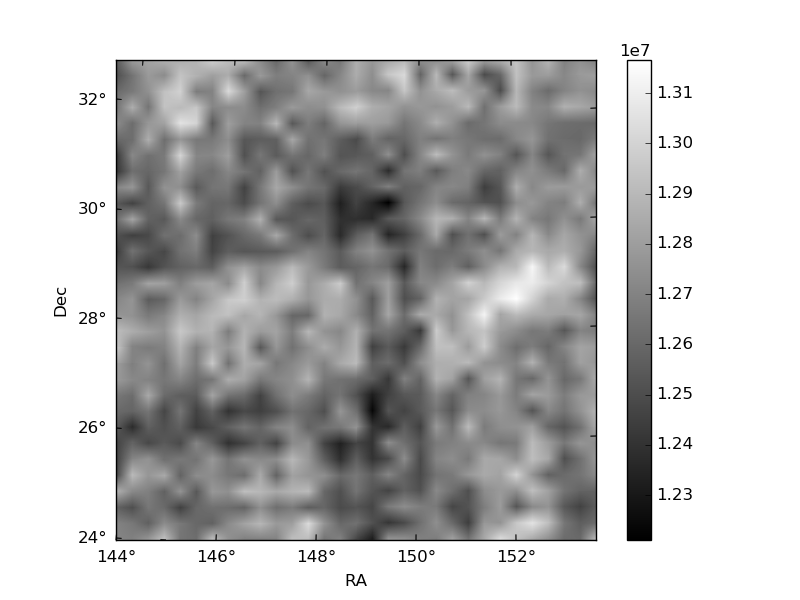
Quadrant B |
|---|---|---|---|
| Quadrant D | 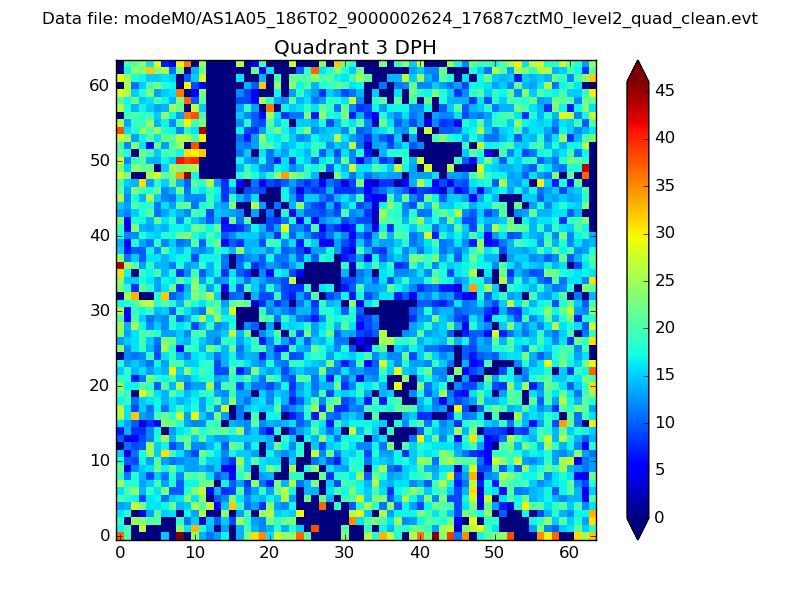 |
 |
Quadrant C |
| Plot type | Count rate plots | Images |
|---|---|---|
| Comparison with Poisson distribution Blue bars denote a histogram of data divided into 1 sec bins. Red curve is a Poisson curve with rate = median count rate of data. |
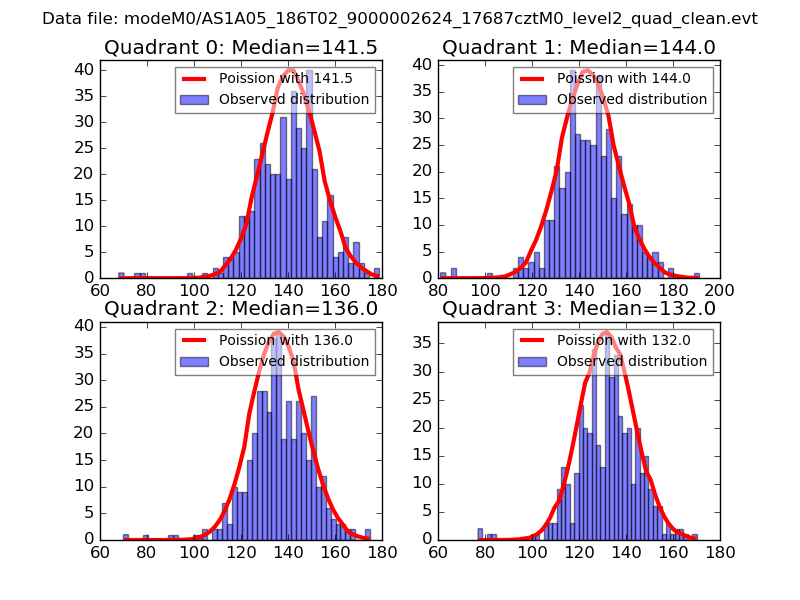 |
 |
| Quadrant-wise count rates Data is divided into 100 sec bins |
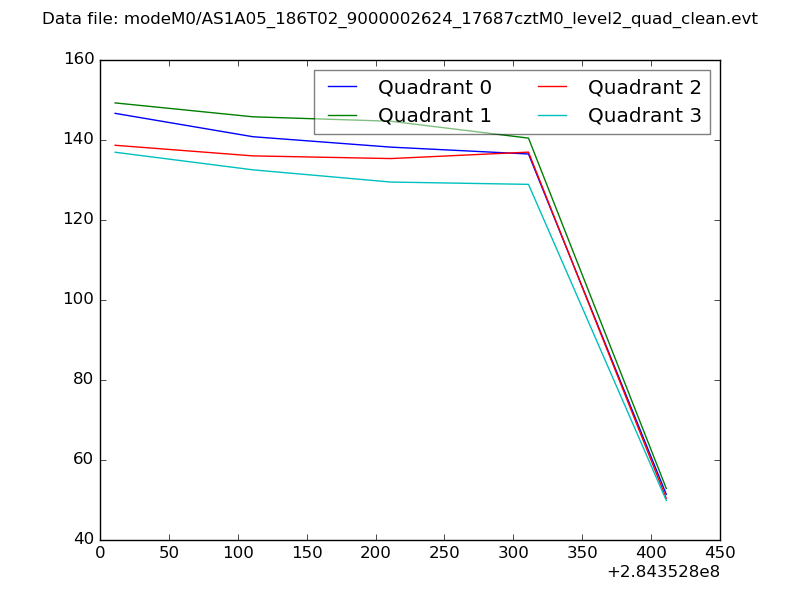 |
|
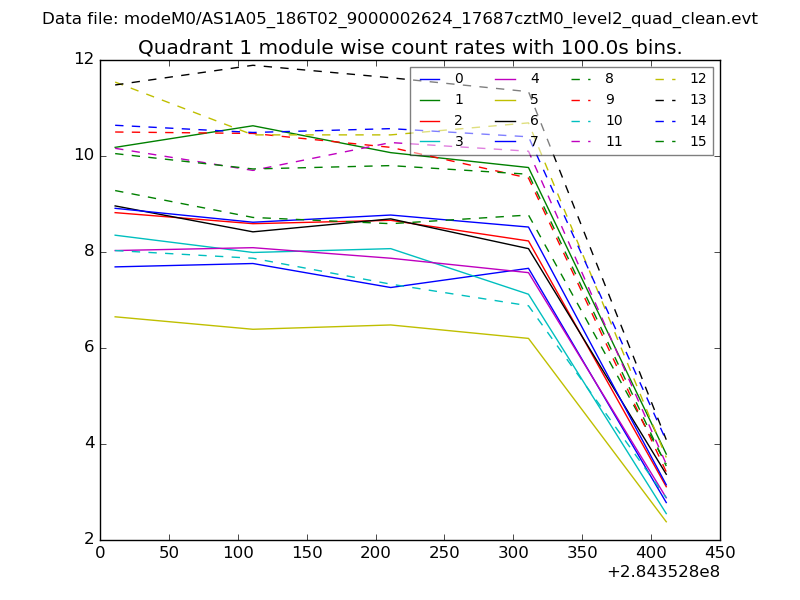
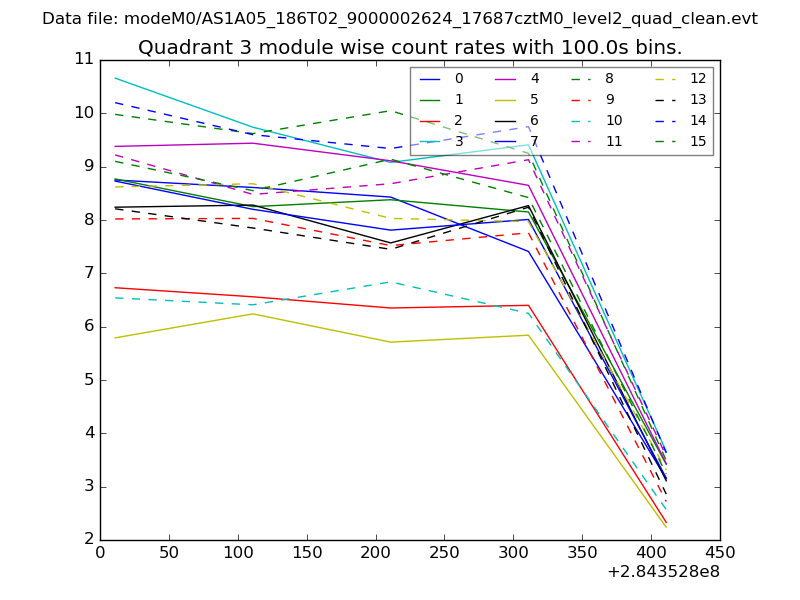
| Module-wise count rates for Quadrant A Data is divided into 100 sec bins |
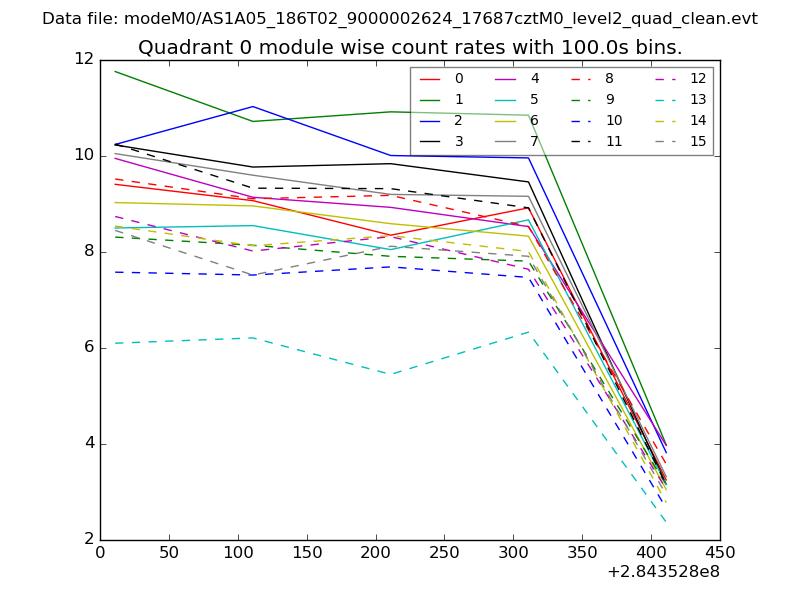 |
 |
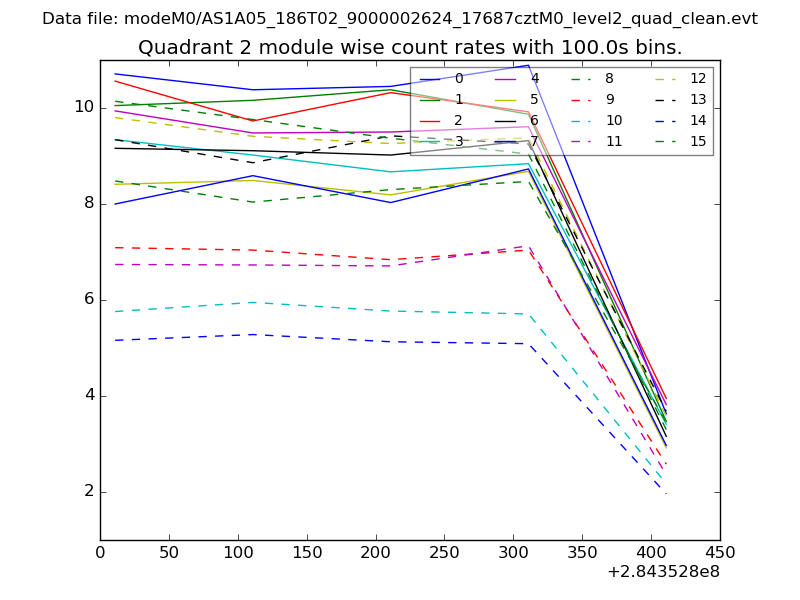
| Module-wise count rates for Quadrant B Data is divided into 100 sec bins |
 |
 |
| Module-wise count rates for Quadrant C Data is divided into 100 sec bins |
 |
 |
| Module-wise count rates for Quadrant D Data is divided into 100 sec bins |
 |
 |
| Parameter | Plot |
|---|---|
| CZT HV Monitor | 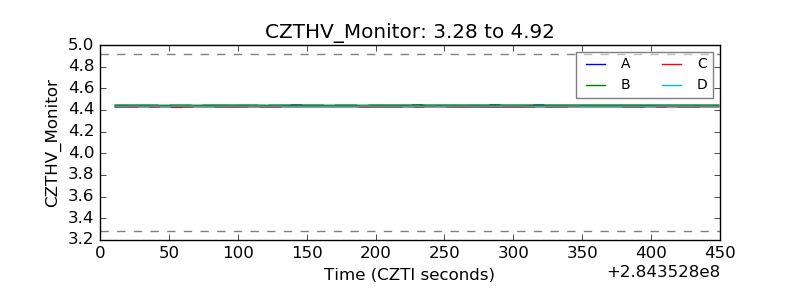 |
| D_VDD | 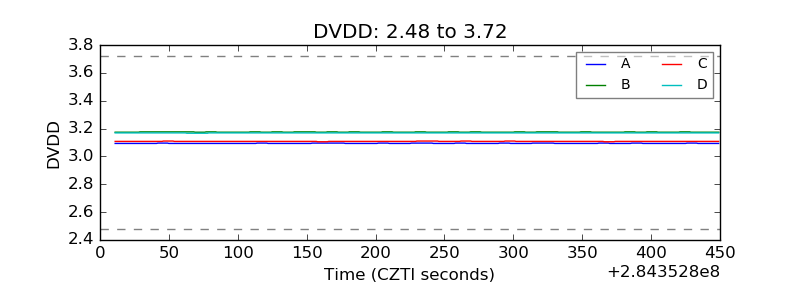 |
| Temperature 1 | 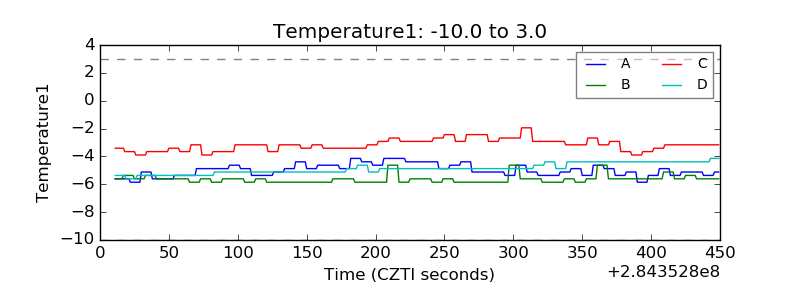 |
| Veto HV Monitor | 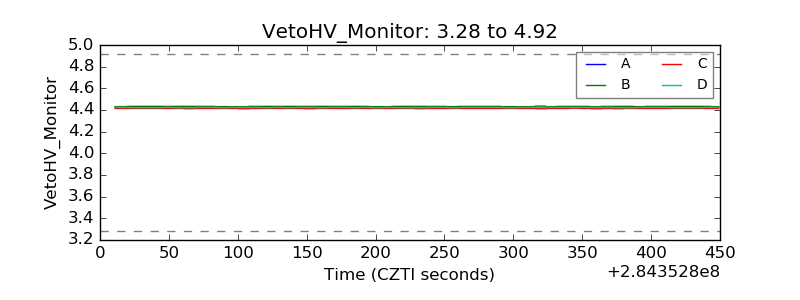 |
| Veto LLD | 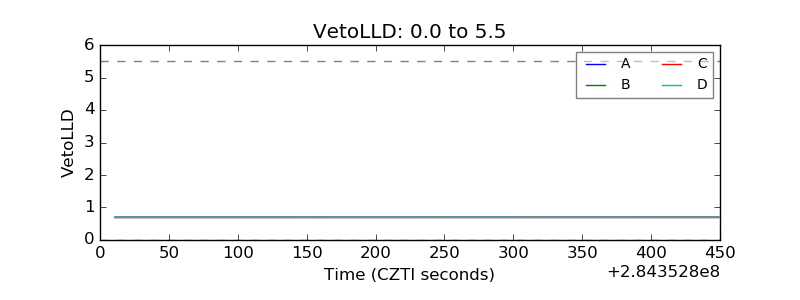 |
| Alpha Counter | 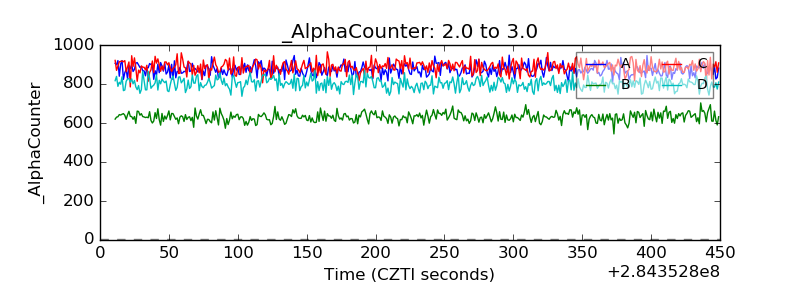 |
| _CPM_Rate | 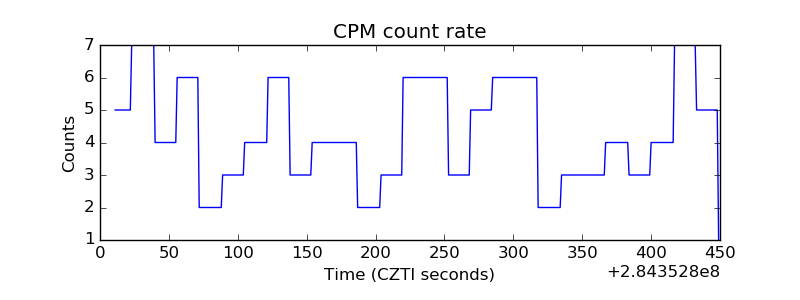 |
| CZT Counter |  |
| +2.5 Volts monitor |  |
| +5 Volts monitor |  |
| _ROLL_ROT | 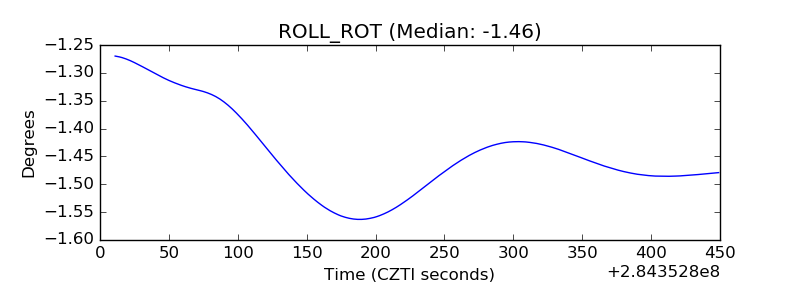 |
| _Roll_DEC | 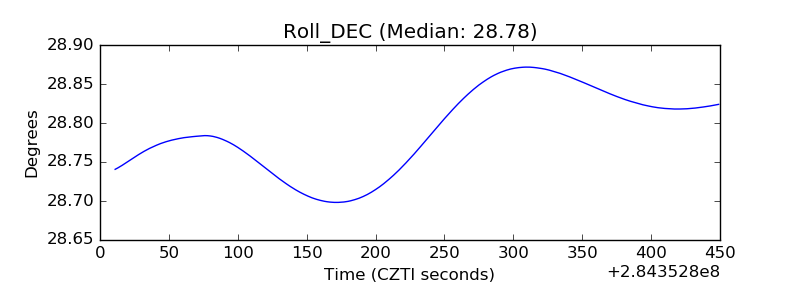 |
| _Roll_RA | 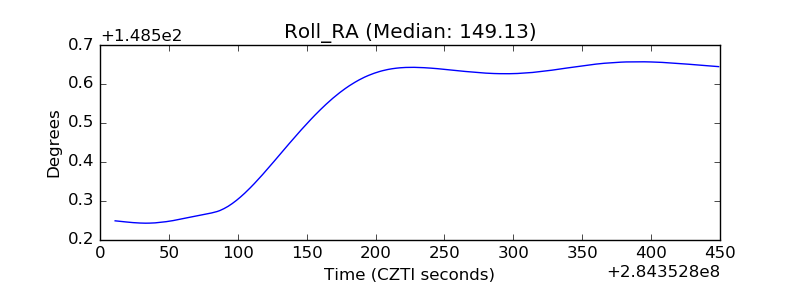 |
| Veto Counter | 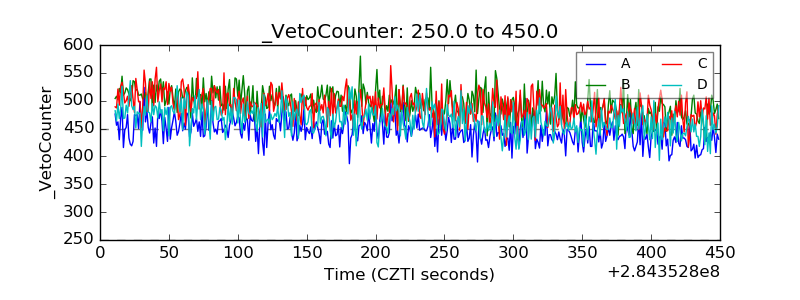 |