| Param | Original file | Final file |
|---|---|---|
| Filename | modeM0/AS1A05_186T02_9000002624_17688cztM0_level2.evt | modeM0/AS1A05_186T02_9000002624_17688cztM0_level2_quad_clean.evt |
| Size (bytes) | 388,238,400 | 70,378,560 |
| Size | 370.3 MB | 67.1 MB |
| Events in quadrant A | 2,685,040 | 448,677 |
| Events in quadrant B | 3,078,734 | 456,469 |
| Events in quadrant C | 2,769,544 | 433,386 |
| Events in quadrant D | 2,863,405 | 420,785 |
| Mode M9 | |||
|---|---|---|---|
| Quadrant | BADHDUFLAG | Total packets | Discarded packets |
| A | 0 | 13 | 0 |
| B | 0 | 13 | 0 |
| C | 0 | 13 | 0 |
| D | 0 | 13 | 0 |
| Mode M0 | |||
|---|---|---|---|
| Quadrant | BADHDUFLAG | Total packets | Discarded packets |
| A | 0 | 11194 | 1 |
| B | 0 | 12554 | 1 |
| C | 0 | 11262 | 1 |
| D | 0 | 11934 | 1 |
| Mode SS | |||
|---|---|---|---|
| Quadrant | BADHDUFLAG | Total packets | Discarded packets |
| A | 0 | 108 | 0 |
| B | 0 | 108 | 0 |
| C | 0 | 108 | 0 |
| D | 0 | 108 | 0 |
| Quadrant | Total seconds | Saturated seconds | Saturation percentage |
|---|---|---|---|
| A | 5309 | 25 | 0.470898% |
| B | 5309 | 96 | 1.808250% |
| C | 5308 | 61 | 1.149209% |
| D | 5308 | 90 | 1.695554% |
Noise dominated data is calculated using 1-second bins in cleaned event files. If a bin has >2000 counts, and if more than 50% of those come from <1% of pixels, then it is considered to be noise-dominated and hence unusable.
| Quadrant | # 1 sec bins | Bins with >0 counts | Bins with >2000 counts | High rate bins dominated by noise | Noise dominated (total time) | Noise dominated (detector-on time) | Marked lightcurve |
|---|---|---|---|---|---|---|---|
| A | 6624 | 5310 | 0 | 0 | 0.00% | 0.00% | 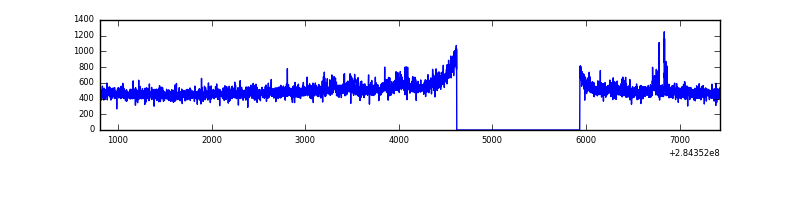 |
| B | 6624 | 5310 | 36 | 36 | 0.54% | 0.68% | 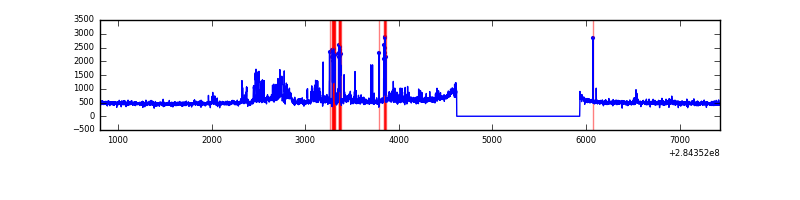 |
| C | 6623 | 5309 | 0 | 0 | 0.00% | 0.00% | 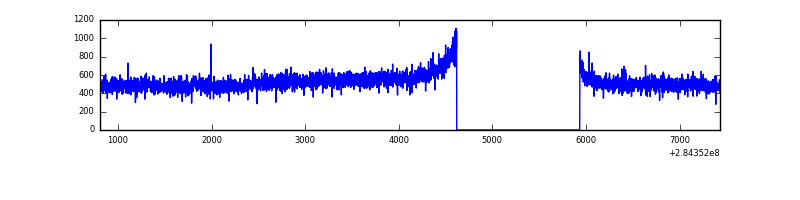 |
| D | 6623 | 5309 | 53 | 53 | 0.80% | 1.00% | 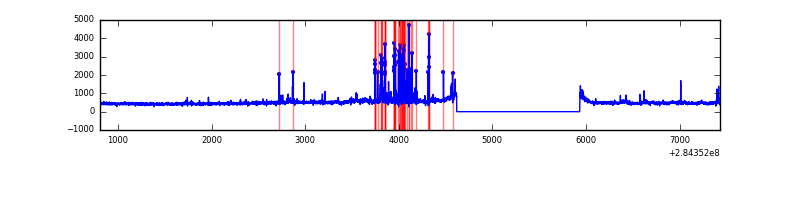 |
Top three noisy pixels from each quadrant. If the there are fewer than three noisy pixels in the level2.evt file, extra rows are filled as -1
| Pixel properties | Quadrant properties | ||||||
|---|---|---|---|---|---|---|---|
| Quadrant | DetID | PixID | Counts | Sigma | Mean | Median | Sigma |
| A | 14 | 237 | 78291 | 567.54 | 678 | 667 | 136.8 |
| A | 0 | 226 | 5983 | 38.87 | 678 | 667 | 136.8 |
| A | 12 | 194 | 5017 | 31.8 | 678 | 667 | 136.8 |
| B | 10 | 245 | 310085 | 2455.71 | 672 | 657 | 126.0 |
| B | 0 | 189 | 89425 | 704.49 | 672 | 657 | 126.0 |
| B | 4 | 142 | 23226 | 179.11 | 672 | 657 | 126.0 |
| C | 3 | 233 | 154518 | 1026.52 | 643 | 647 | 149.9 |
| C | 14 | 238 | 101467 | 672.6 | 643 | 647 | 149.9 |
| C | 5 | 218 | 7674 | 46.88 | 643 | 647 | 149.9 |
| D | 1 | 52 | 286418 | 1824.1 | 650 | 633 | 156.7 |
| D | 10 | 70 | 43430 | 273.16 | 650 | 633 | 156.7 |
| D | 12 | 233 | 27426 | 171.01 | 650 | 633 | 156.7 |
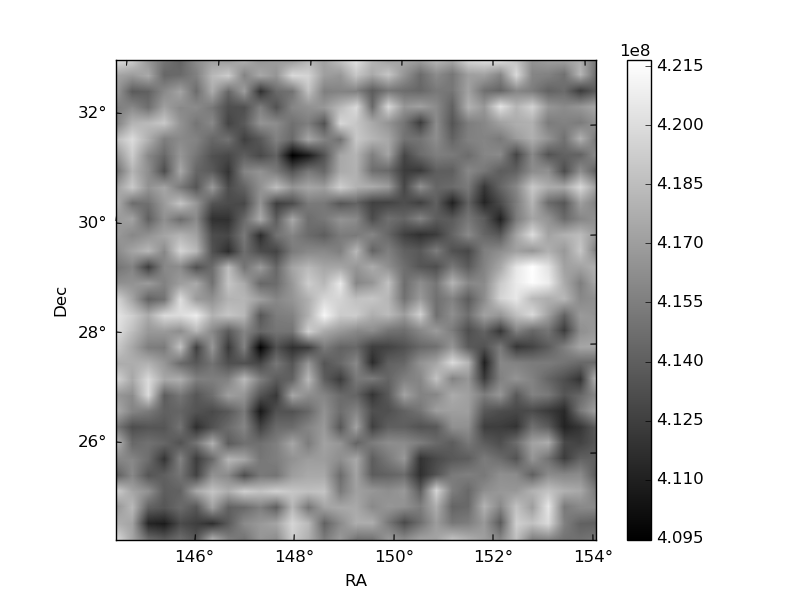
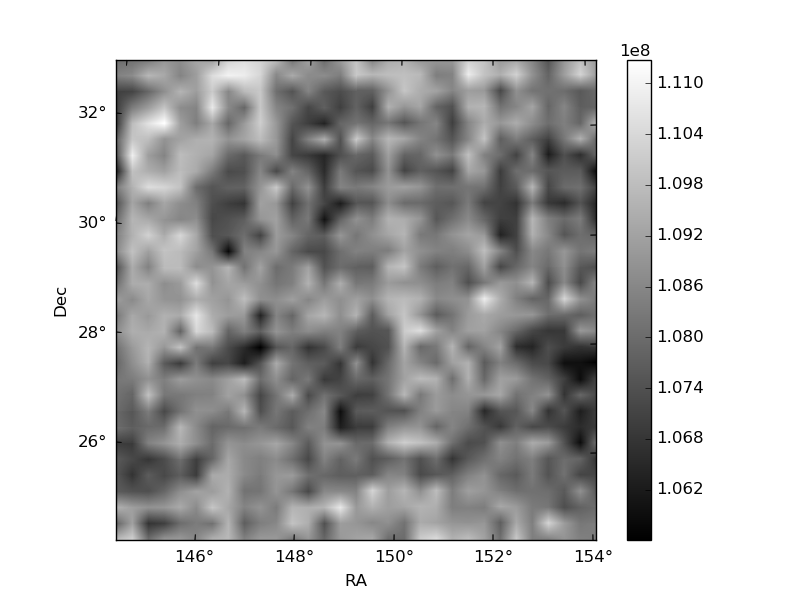
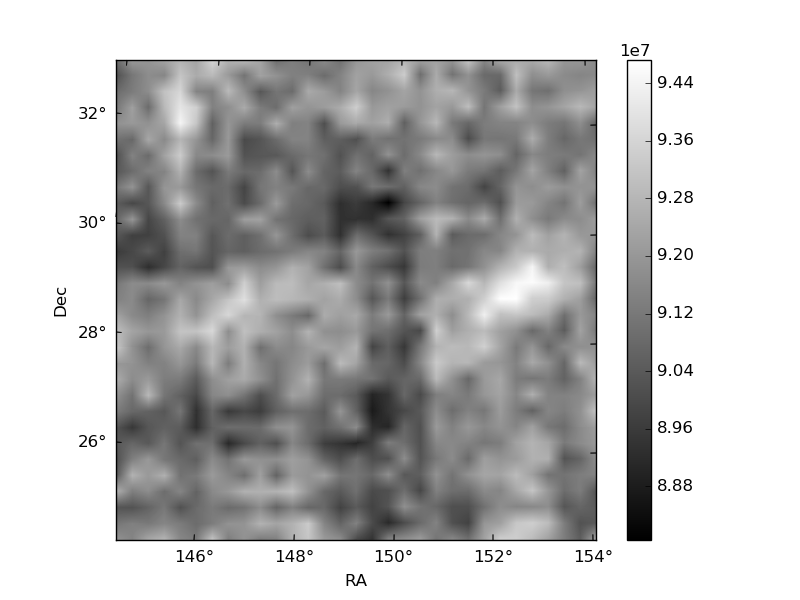
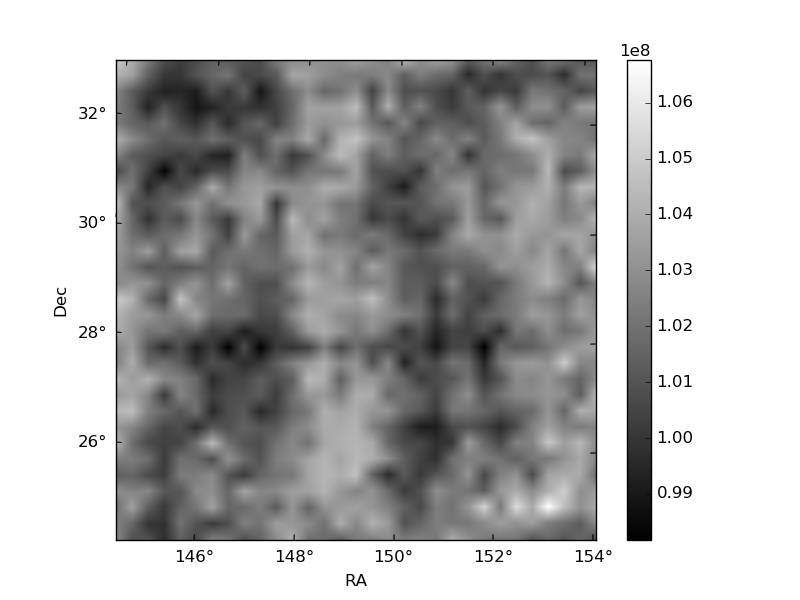
Histogram calculated using DETX and DETY for each event in the final _common_clean file
| Quadrant A | 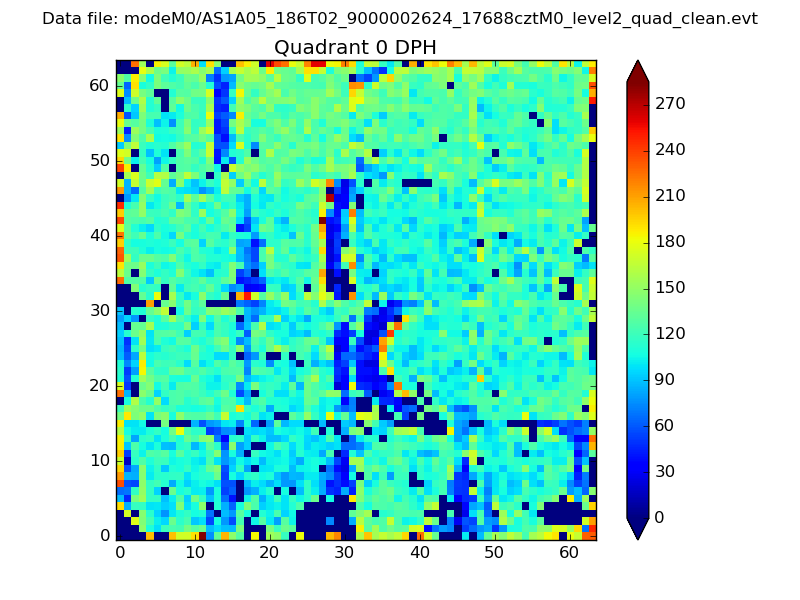 |
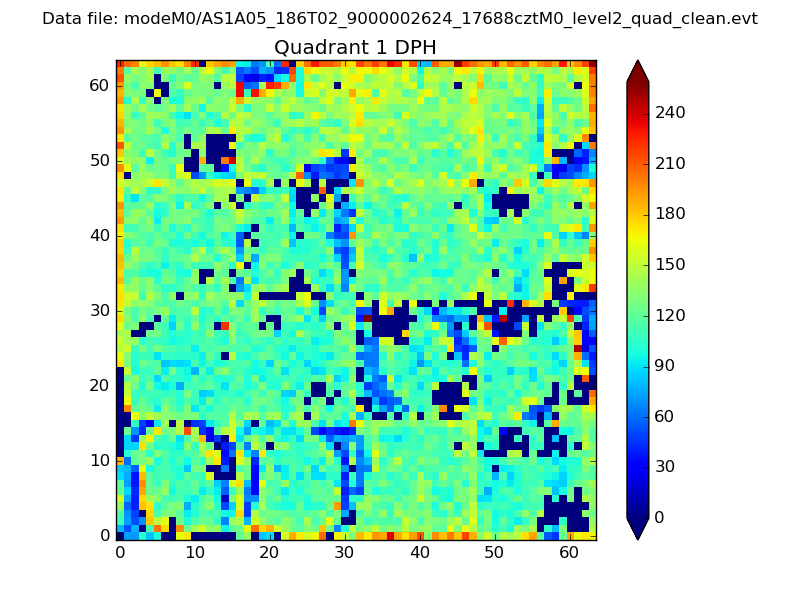 |
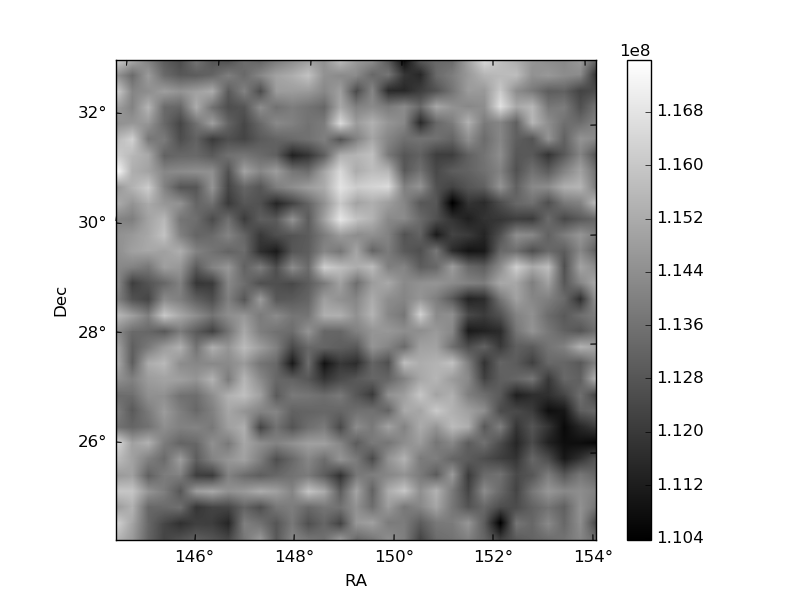
Quadrant B |
|---|---|---|---|
| Quadrant D | 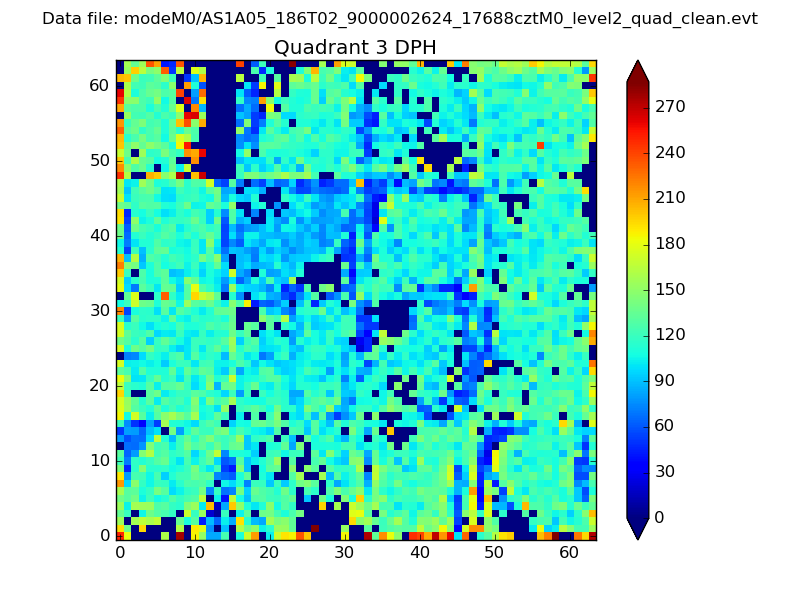 |
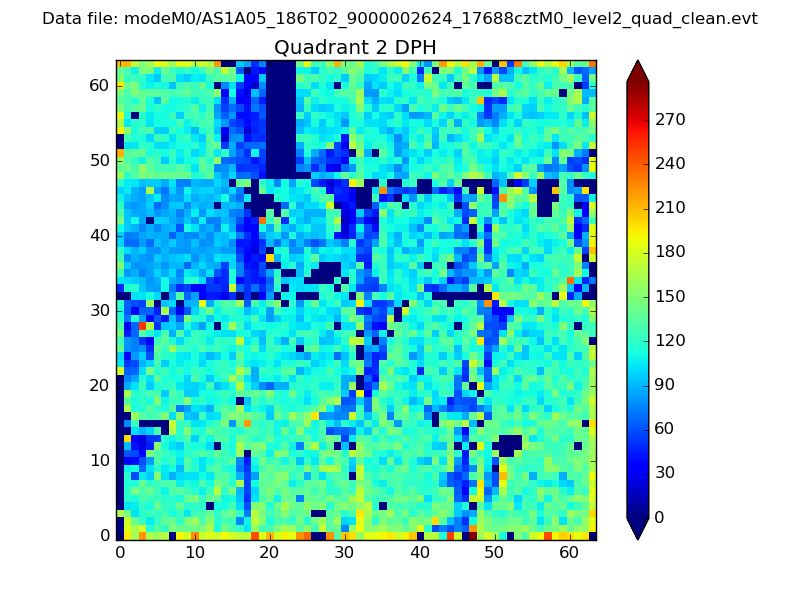 |
Quadrant C |
| Plot type | Count rate plots | Images |
|---|---|---|
| Comparison with Poisson distribution Blue bars denote a histogram of data divided into 1 sec bins. Red curve is a Poisson curve with rate = median count rate of data. |
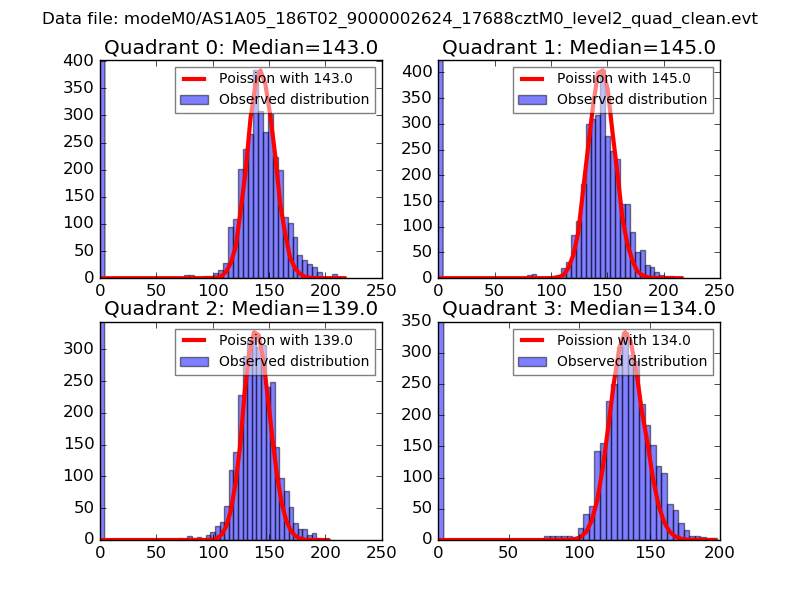 |
 |
| Quadrant-wise count rates Data is divided into 100 sec bins |
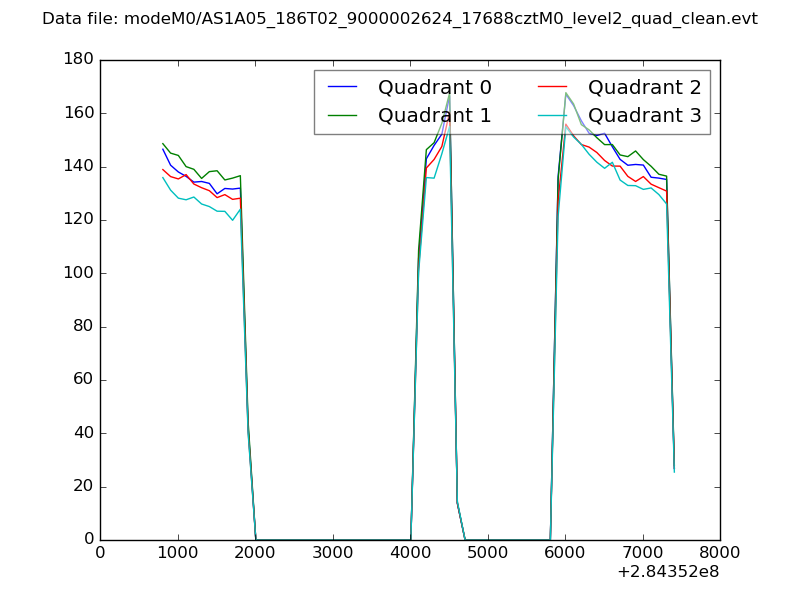 |
|
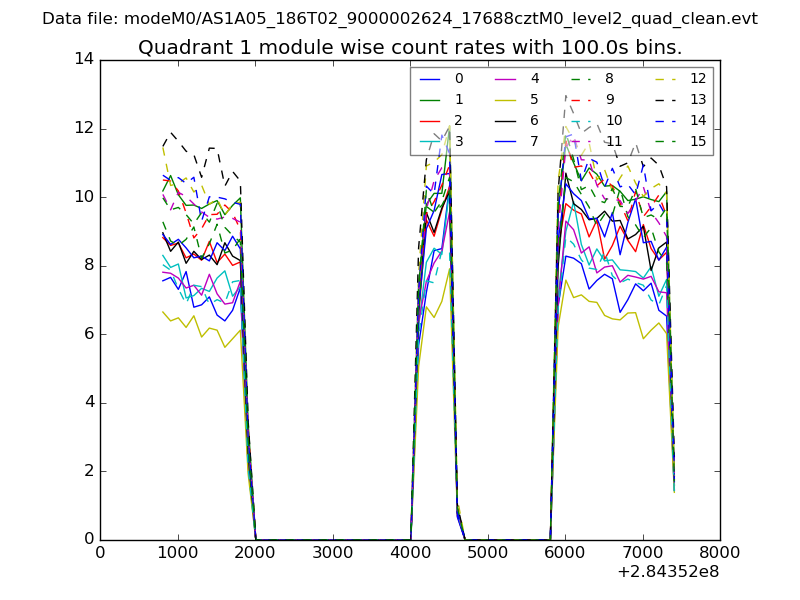
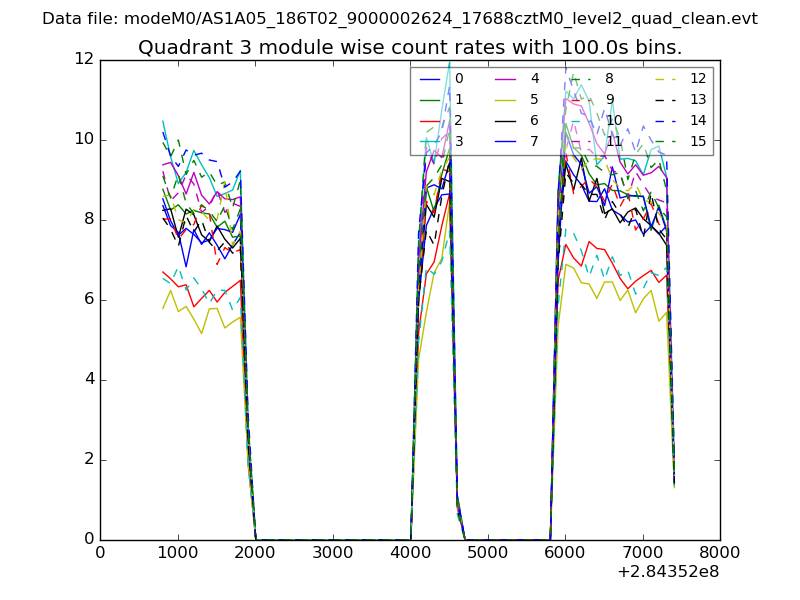
| Module-wise count rates for Quadrant A Data is divided into 100 sec bins |
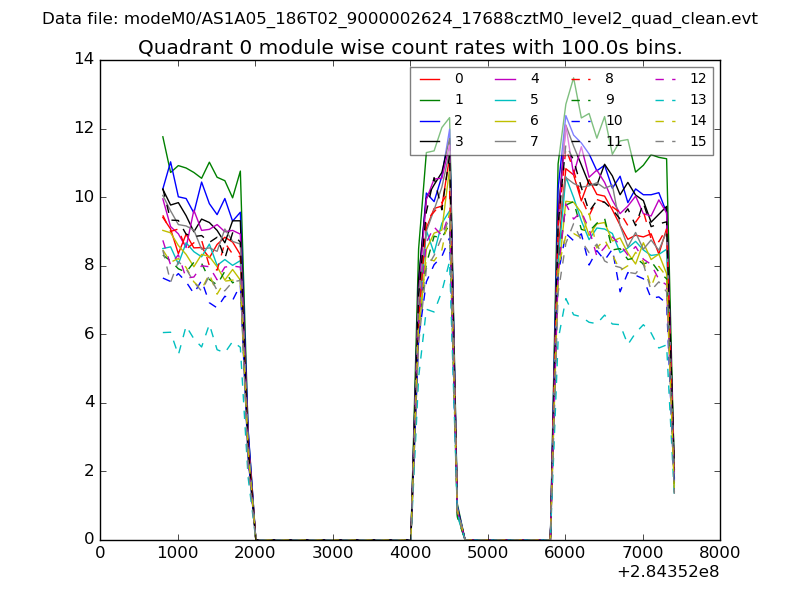 |
 |
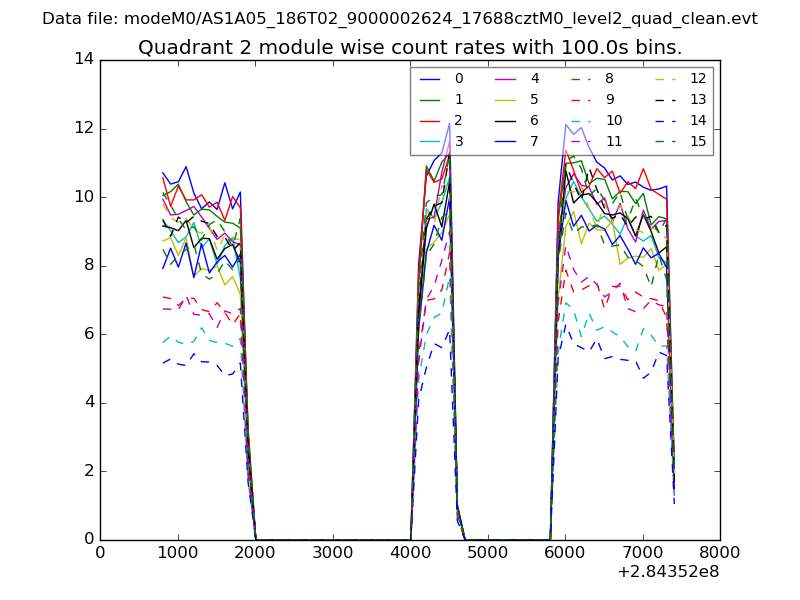
| Module-wise count rates for Quadrant B Data is divided into 100 sec bins |
 |
 |
| Module-wise count rates for Quadrant C Data is divided into 100 sec bins |
 |
 |
| Module-wise count rates for Quadrant D Data is divided into 100 sec bins |
 |
 |
| Parameter | Plot |
|---|---|
| CZT HV Monitor | 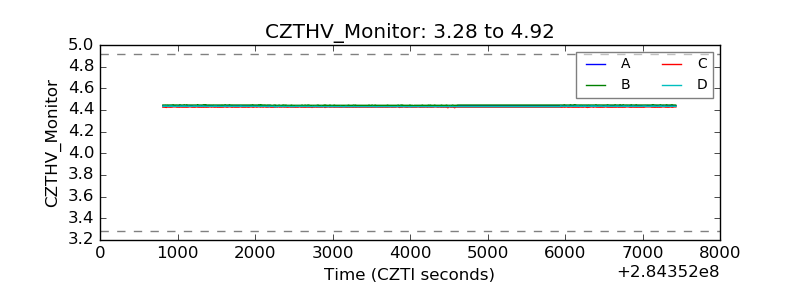 |
| D_VDD |  |
| Temperature 1 | 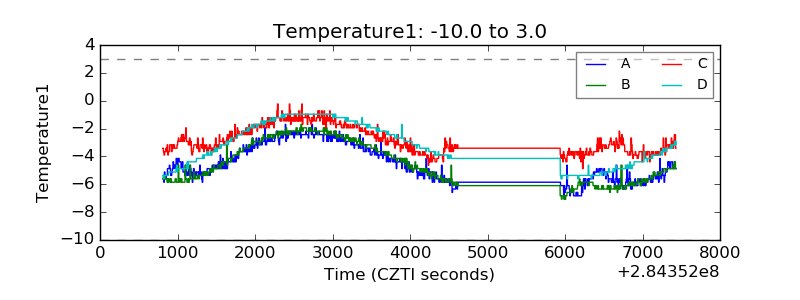 |
| Veto HV Monitor | 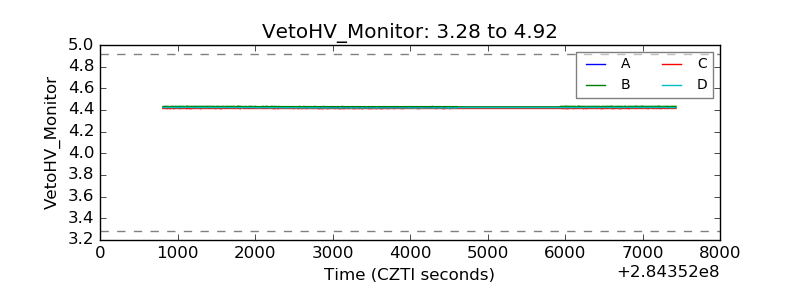 |
| Veto LLD |  |
| Alpha Counter | 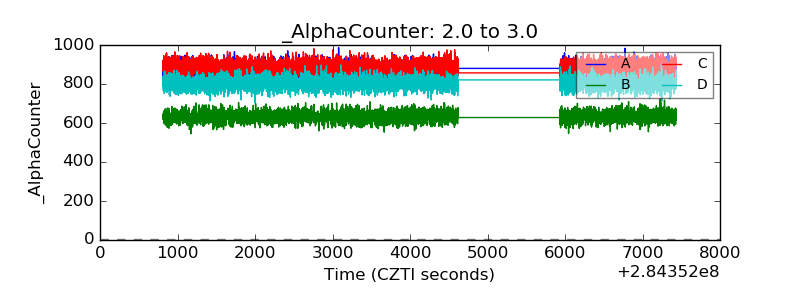 |
| _CPM_Rate | 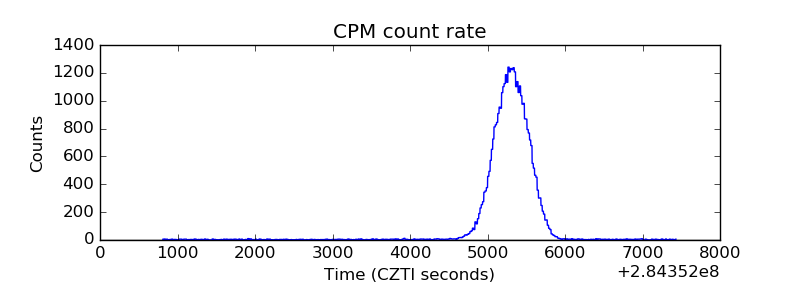 |
| CZT Counter | 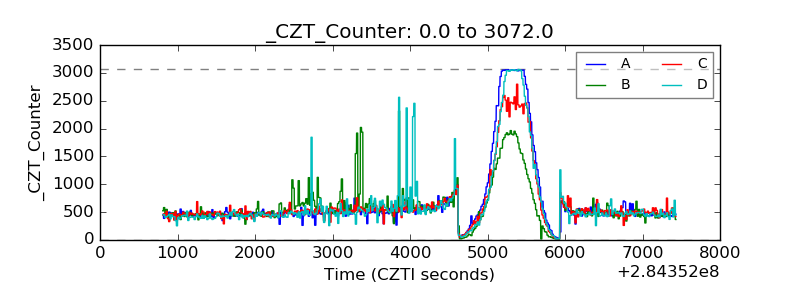 |
| +2.5 Volts monitor |  |
| +5 Volts monitor | 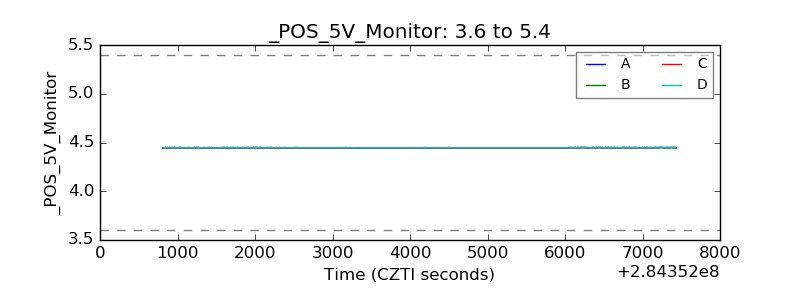 |
| _ROLL_ROT |  |
| _Roll_DEC | 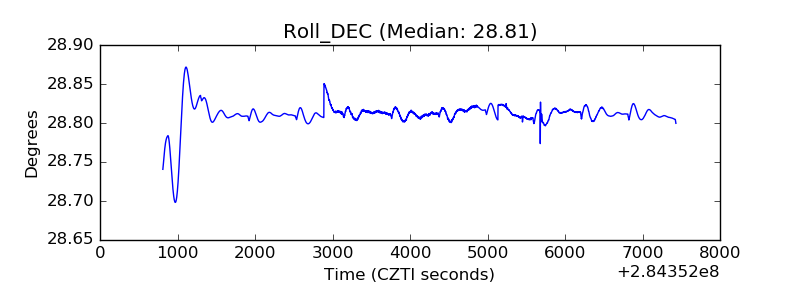 |
| _Roll_RA | 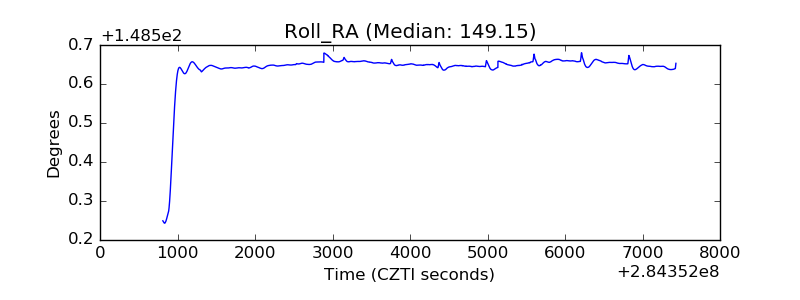 |
| Veto Counter |  |