| Param | Original file | Final file |
|---|---|---|
| Filename | modeM0/AS1A05_186T02_9000002624_17689cztM0_level2.evt | modeM0/AS1A05_186T02_9000002624_17689cztM0_level2_quad_clean.evt |
| Size (bytes) | 502,263,360 | 92,485,440 |
| Size | 479.0 MB | 88.2 MB |
| Events in quadrant A | 3,202,701 | 601,949 |
| Events in quadrant B | 3,487,205 | 605,688 |
| Events in quadrant C | 3,326,328 | 579,438 |
| Events in quadrant D | 4,759,774 | 566,298 |
| Mode M9 | |||
|---|---|---|---|
| Quadrant | BADHDUFLAG | Total packets | Discarded packets |
| A | 0 | 15 | 0 |
| B | 0 | 16 | 0 |
| C | 0 | 16 | 0 |
| D | 0 | 16 | 0 |
| Mode M0 | |||
|---|---|---|---|
| Quadrant | BADHDUFLAG | Total packets | Discarded packets |
| A | 0 | 13380 | 3 |
| B | 0 | 14309 | 2 |
| C | 0 | 13464 | 2 |
| D | 0 | 18646 | 2 |
| Mode SS | |||
|---|---|---|---|
| Quadrant | BADHDUFLAG | Total packets | Discarded packets |
| A | 0 | 130 | 0 |
| B | 0 | 130 | 0 |
| C | 0 | 130 | 0 |
| D | 0 | 130 | 0 |
| Quadrant | Total seconds | Saturated seconds | Saturation percentage |
|---|---|---|---|
| A | 6414 | 82 | 1.278453% |
| B | 6414 | 136 | 2.120362% |
| C | 6414 | 107 | 1.668226% |
| D | 6414 | 159 | 2.478952% |
Noise dominated data is calculated using 1-second bins in cleaned event files. If a bin has >2000 counts, and if more than 50% of those come from <1% of pixels, then it is considered to be noise-dominated and hence unusable.
| Quadrant | # 1 sec bins | Bins with >0 counts | Bins with >2000 counts | High rate bins dominated by noise | Noise dominated (total time) | Noise dominated (detector-on time) | Marked lightcurve |
|---|---|---|---|---|---|---|---|
| A | 7574 | 6415 | 0 | 0 | 0.00% | 0.00% | 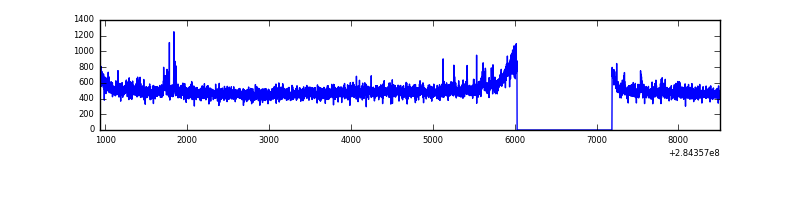 |
| B | 7574 | 6415 | 38 | 38 | 0.50% | 0.59% | 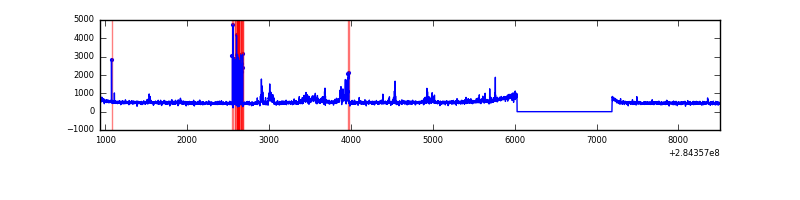 |
| C | 7574 | 6415 | 0 | 0 | 0.00% | 0.00% |  |
| D | 7574 | 6415 | 82 | 82 | 1.08% | 1.28% |  |
Top three noisy pixels from each quadrant. If the there are fewer than three noisy pixels in the level2.evt file, extra rows are filled as -1
| Pixel properties | Quadrant properties | ||||||
|---|---|---|---|---|---|---|---|
| Quadrant | DetID | PixID | Counts | Sigma | Mean | Median | Sigma |
| A | 14 | 237 | 69487 | 417.54 | 816 | 802 | 164.5 |
| A | 0 | 226 | 7098 | 38.27 | 816 | 802 | 164.5 |
| A | 12 | 194 | 5914 | 31.08 | 816 | 802 | 164.5 |
| B | 10 | 245 | 237506 | 1549.06 | 806 | 786 | 152.8 |
| B | 0 | 189 | 53348 | 343.96 | 806 | 786 | 152.8 |
| B | 0 | 230 | 26236 | 166.54 | 806 | 786 | 152.8 |
| C | 3 | 233 | 188703 | 1048.79 | 771 | 778 | 179.2 |
| C | 14 | 238 | 121561 | 674.07 | 771 | 778 | 179.2 |
| C | 5 | 218 | 10989 | 56.99 | 771 | 778 | 179.2 |
| D | 1 | 52 | 1609470 | 8488.7 | 783 | 761 | 189.5 |
| D | 7 | 238 | 117649 | 616.78 | 783 | 761 | 189.5 |
| D | 2 | 234 | 21719 | 110.59 | 783 | 761 | 189.5 |
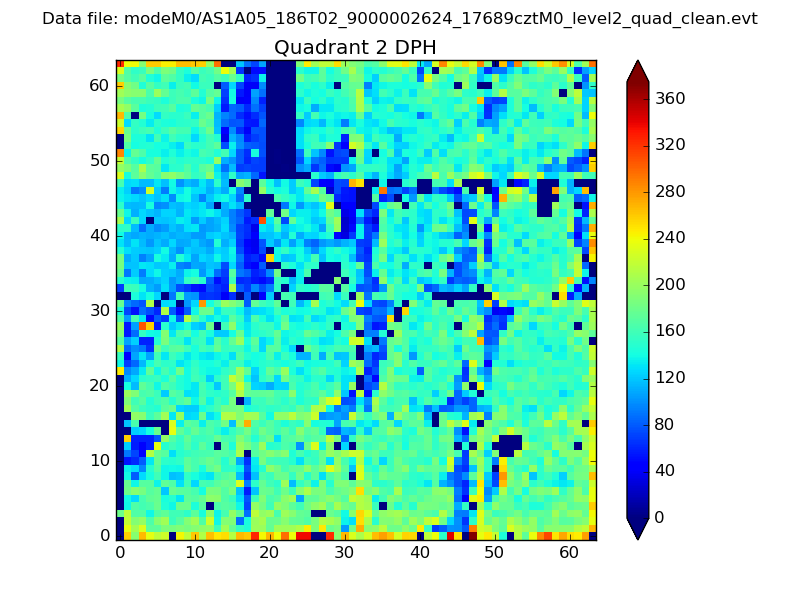
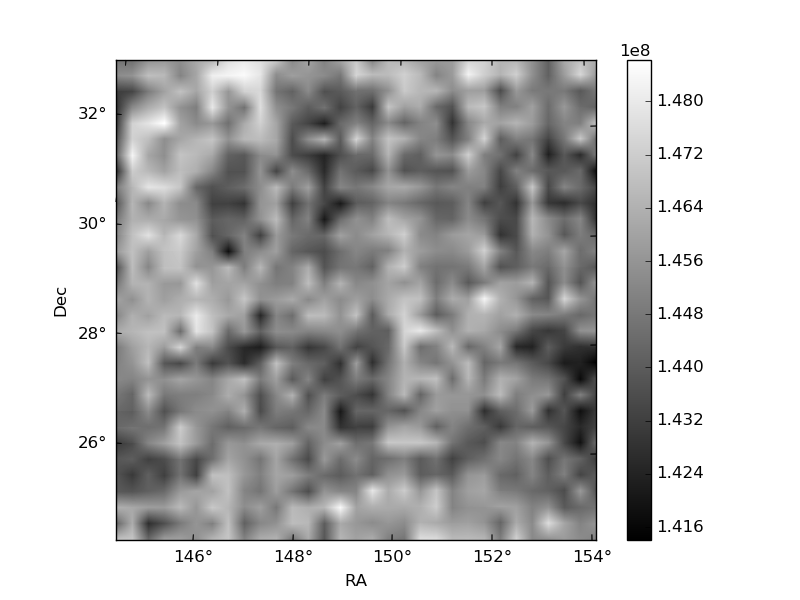
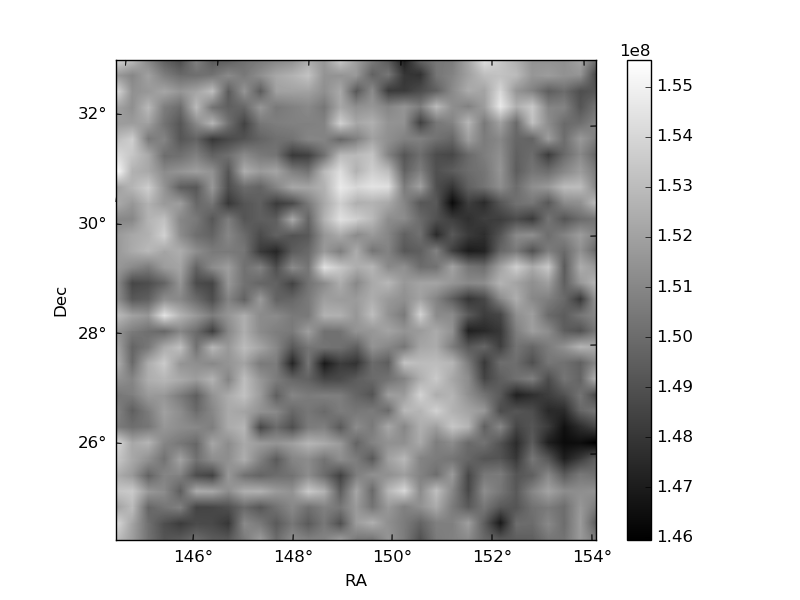
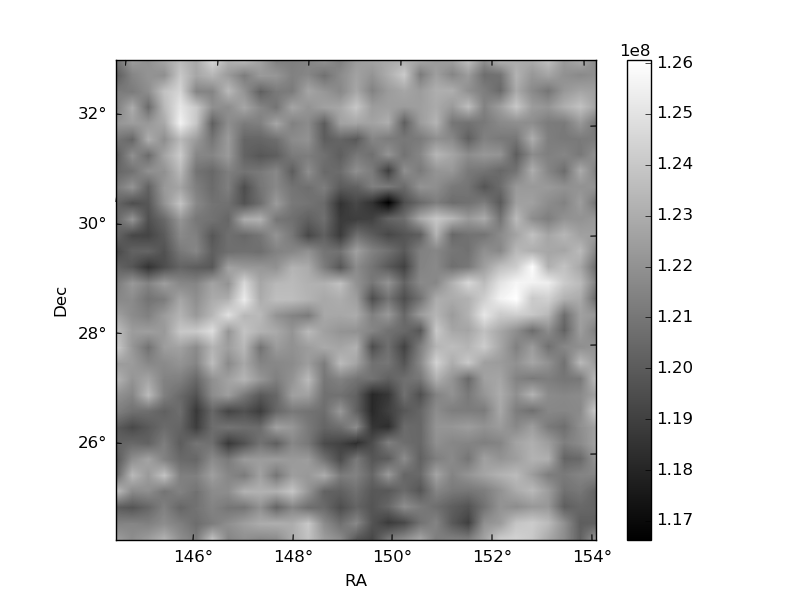
Histogram calculated using DETX and DETY for each event in the final _common_clean file
| Quadrant A | 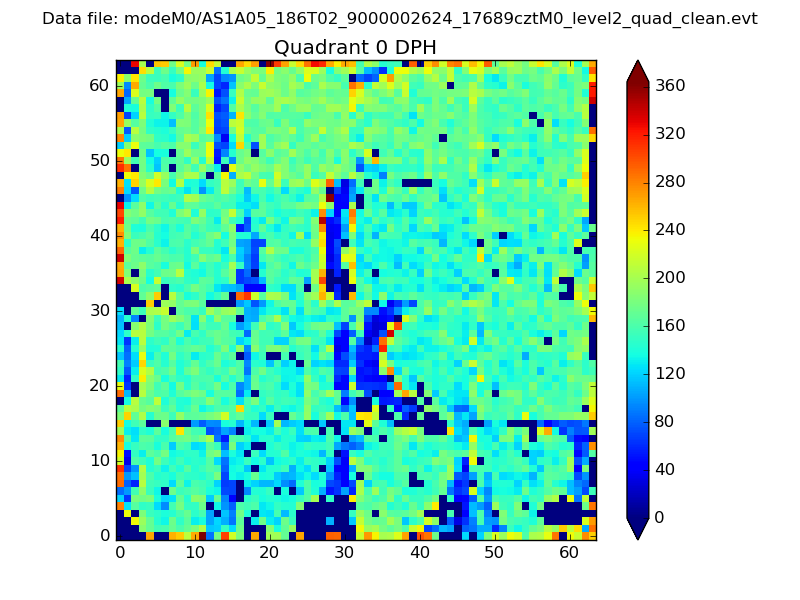 |
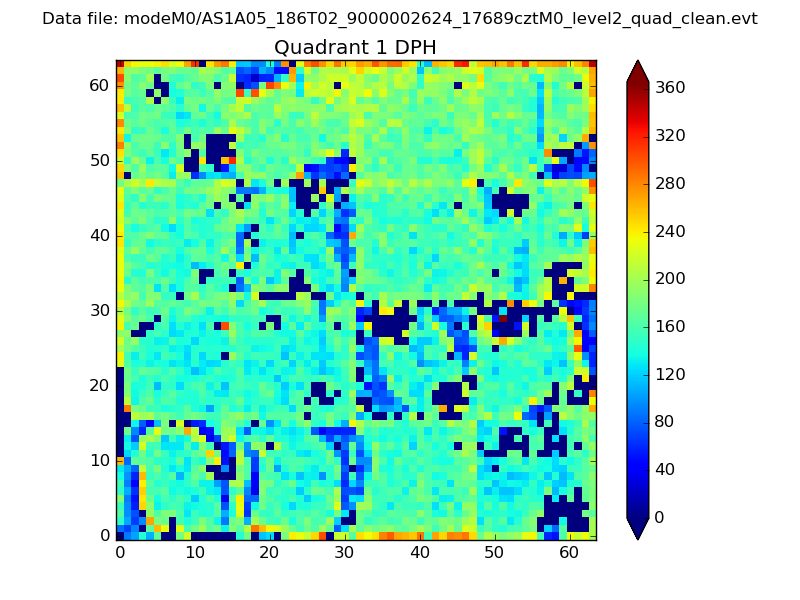 |
Quadrant B |
|---|---|---|---|
| Quadrant D | 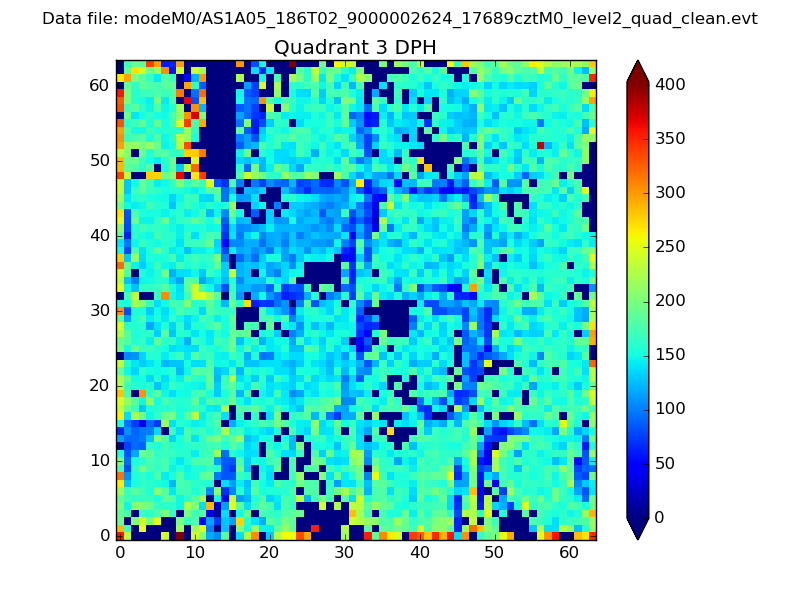 |
 |
Quadrant C |
| Plot type | Count rate plots | Images |
|---|---|---|
| Comparison with Poisson distribution Blue bars denote a histogram of data divided into 1 sec bins. Red curve is a Poisson curve with rate = median count rate of data. |
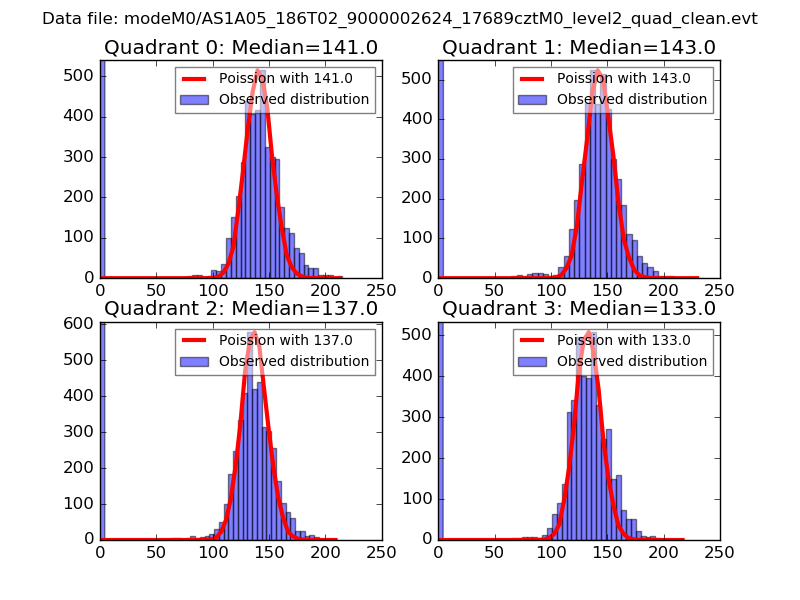 |
 |
| Quadrant-wise count rates Data is divided into 100 sec bins |
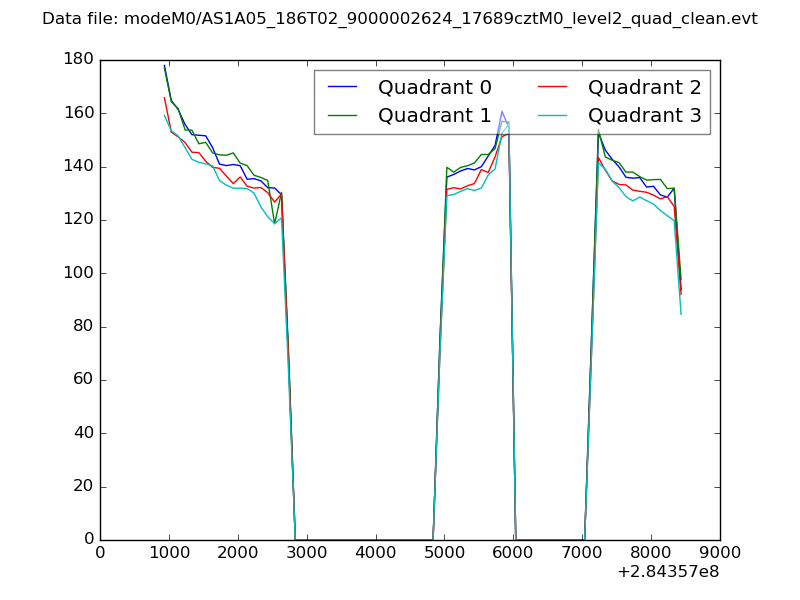 |
|
| Module-wise count rates for Quadrant A Data is divided into 100 sec bins |
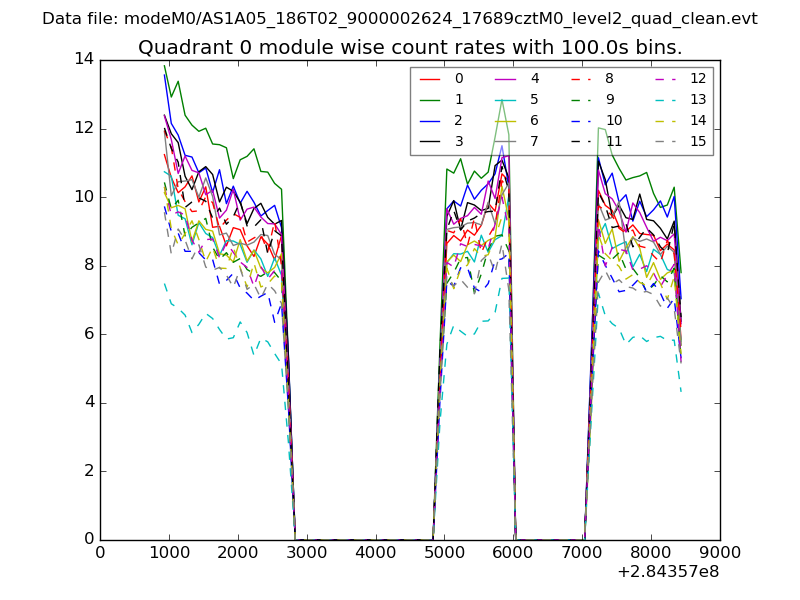 |
 |
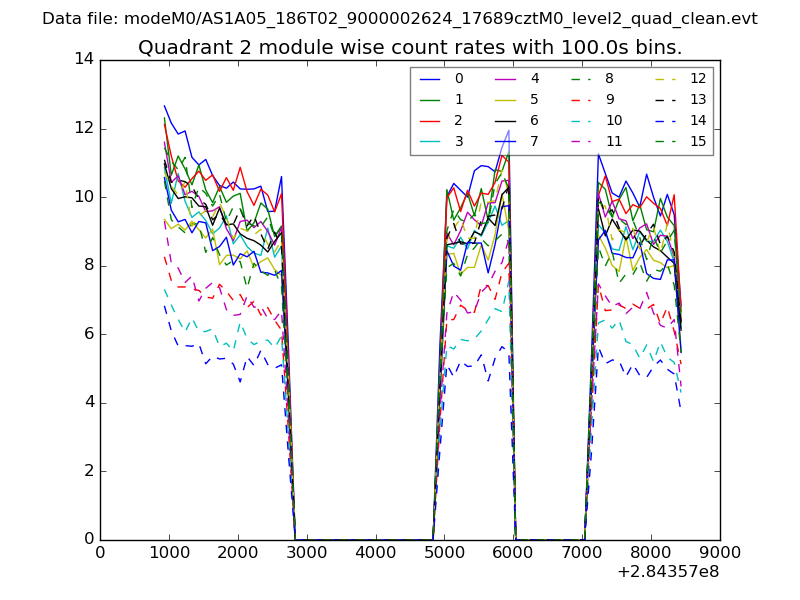
| Module-wise count rates for Quadrant B Data is divided into 100 sec bins |
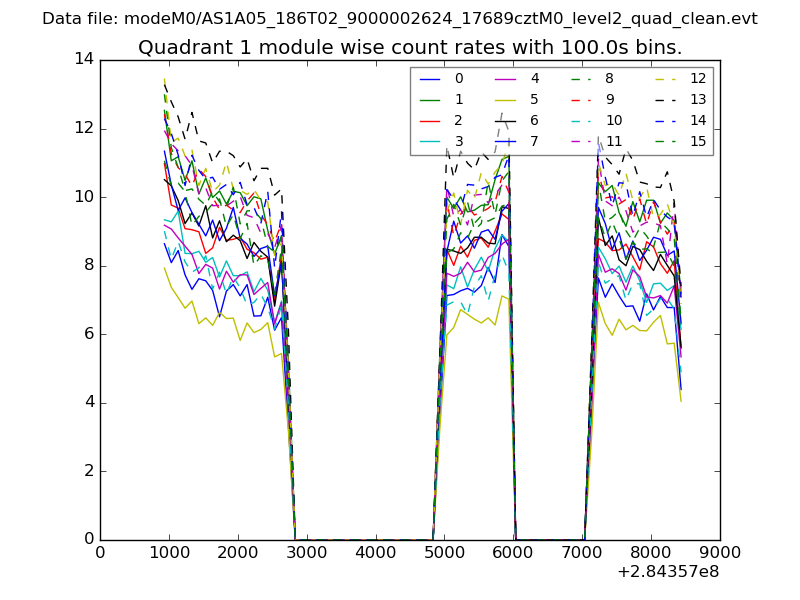 |
 |
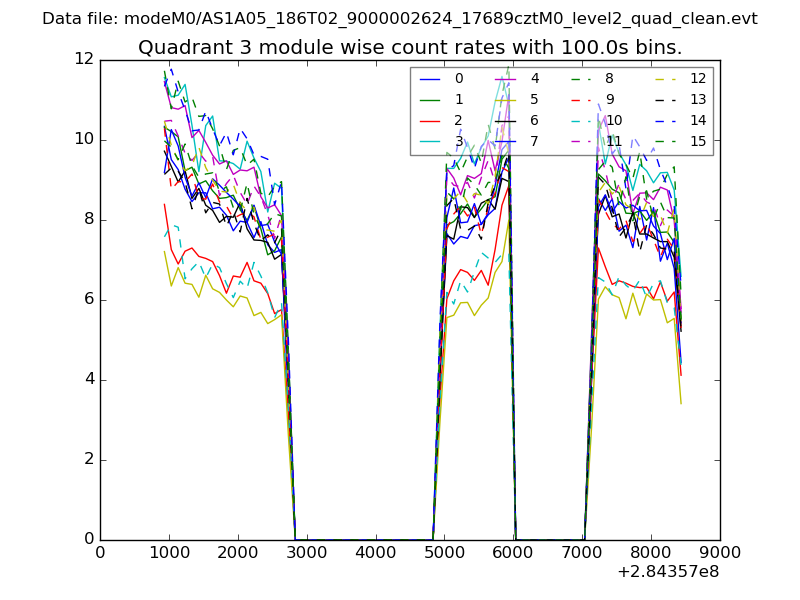
| Module-wise count rates for Quadrant C Data is divided into 100 sec bins |
 |
 |
| Module-wise count rates for Quadrant D Data is divided into 100 sec bins |
 |
 |
| Parameter | Plot |
|---|---|
| CZT HV Monitor | 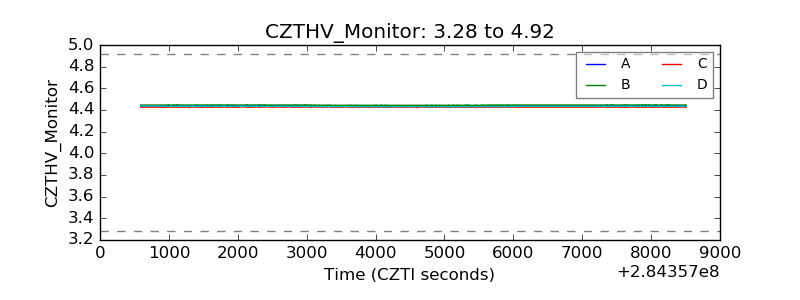 |
| D_VDD | 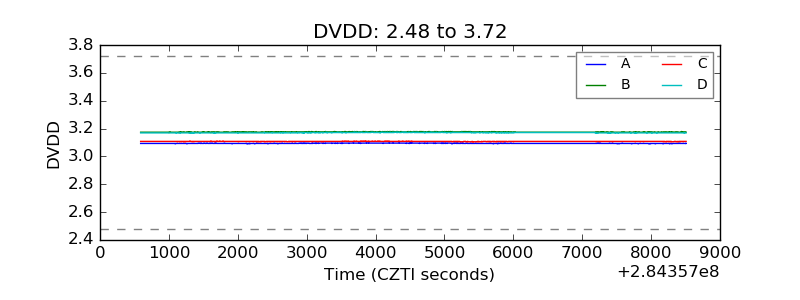 |
| Temperature 1 |  |
| Veto HV Monitor |  |
| Veto LLD | 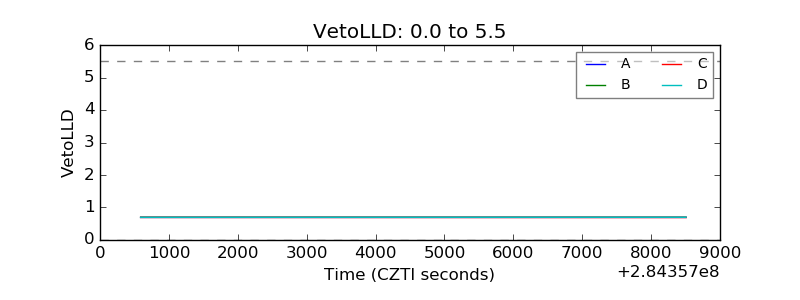 |
| Alpha Counter | 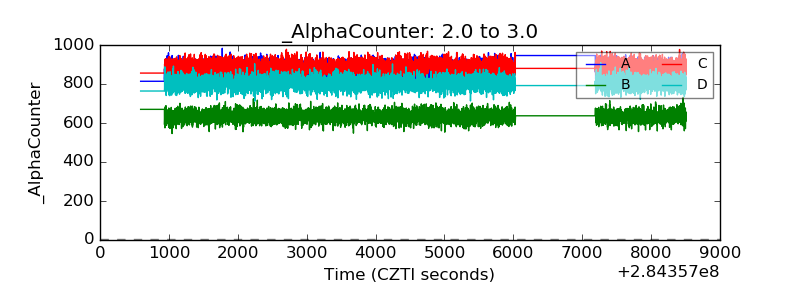 |
| _CPM_Rate | 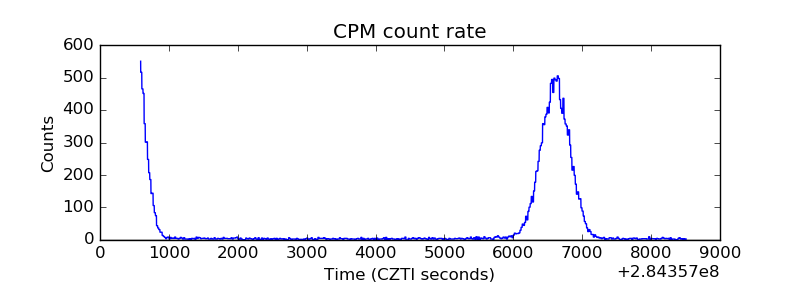 |
| CZT Counter | 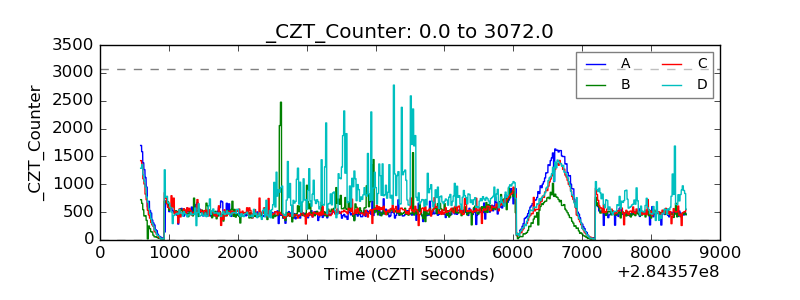 |
| +2.5 Volts monitor |  |
| +5 Volts monitor |  |
| _ROLL_ROT | 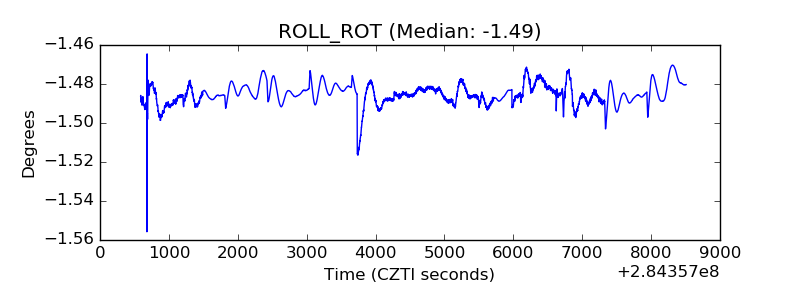 |
| _Roll_DEC | 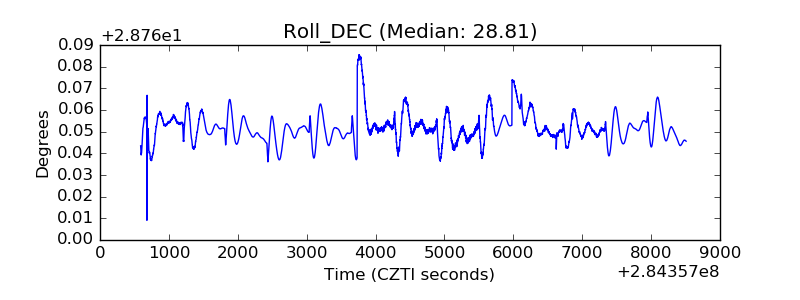 |
| _Roll_RA | 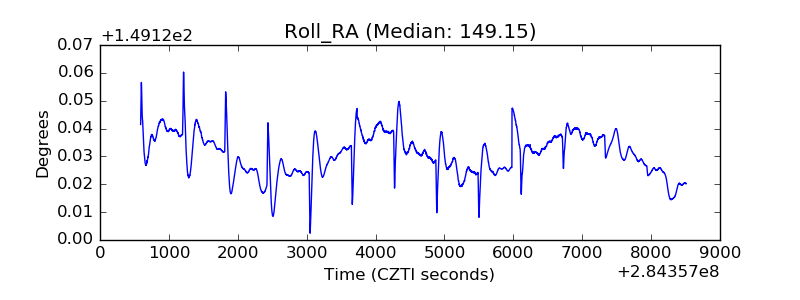 |
| Veto Counter | 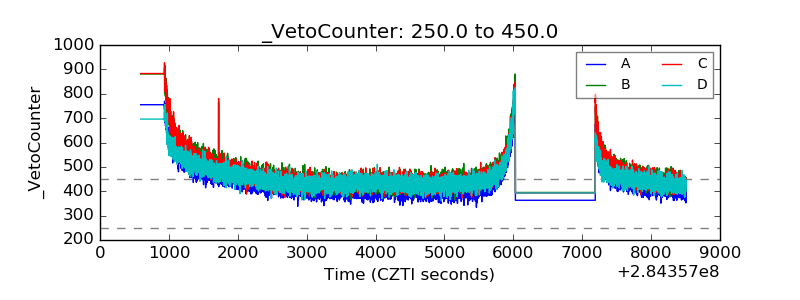 |