| Param | Original file | Final file |
|---|---|---|
| Filename | modeM0/AS1A05_186T02_9000002624_17692cztM0_level2.evt | modeM0/AS1A05_186T02_9000002624_17692cztM0_level2_quad_clean.evt |
| Size (bytes) | 568,278,720 | 87,552,000 |
| Size | 542.0 MB | 83.5 MB |
| Events in quadrant A | 3,806,532 | 537,268 |
| Events in quadrant B | 4,536,064 | 540,193 |
| Events in quadrant C | 4,015,160 | 516,704 |
| Events in quadrant D | 4,320,703 | 511,932 |
| Mode M9 | |||
|---|---|---|---|
| Quadrant | BADHDUFLAG | Total packets | Discarded packets |
| A | 0 | 2 | 0 |
| B | 0 | 3 | 0 |
| C | 0 | 3 | 0 |
| D | 0 | 3 | 0 |
| Mode M0 | |||
|---|---|---|---|
| Quadrant | BADHDUFLAG | Total packets | Discarded packets |
| A | 0 | 16332 | 2 |
| B | 0 | 18417 | 2 |
| C | 0 | 16489 | 2 |
| D | 0 | 18038 | 2 |
| Mode SS | |||
|---|---|---|---|
| Quadrant | BADHDUFLAG | Total packets | Discarded packets |
| A | 0 | 160 | 0 |
| B | 0 | 160 | 0 |
| C | 0 | 160 | 0 |
| D | 0 | 160 | 0 |
| Quadrant | Total seconds | Saturated seconds | Saturation percentage |
|---|---|---|---|
| A | 7831 | 216 | 2.758268% |
| B | 7831 | 404 | 5.158984% |
| C | 7831 | 285 | 3.639382% |
| D | 7831 | 263 | 3.358447% |
Noise dominated data is calculated using 1-second bins in cleaned event files. If a bin has >2000 counts, and if more than 50% of those come from <1% of pixels, then it is considered to be noise-dominated and hence unusable.
| Quadrant | # 1 sec bins | Bins with >0 counts | Bins with >2000 counts | High rate bins dominated by noise | Noise dominated (total time) | Noise dominated (detector-on time) | Marked lightcurve |
|---|---|---|---|---|---|---|---|
| A | 8036 | 7831 | 0 | 0 | 0.00% | 0.00% | 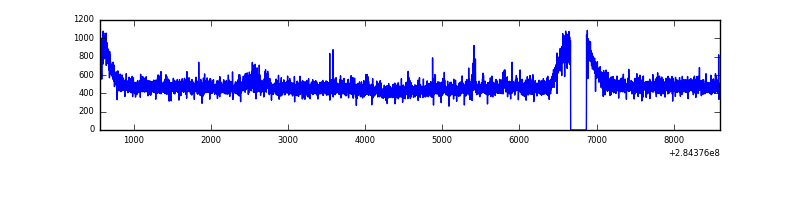 |
| B | 8036 | 7831 | 148 | 148 | 1.84% | 1.89% |  |
| C | 8036 | 7831 | 0 | 0 | 0.00% | 0.00% | 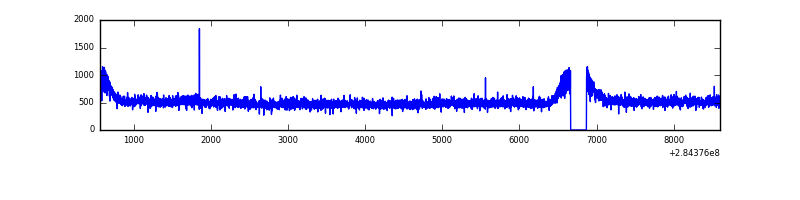 |
| D | 8036 | 7831 | 41 | 41 | 0.51% | 0.52% | 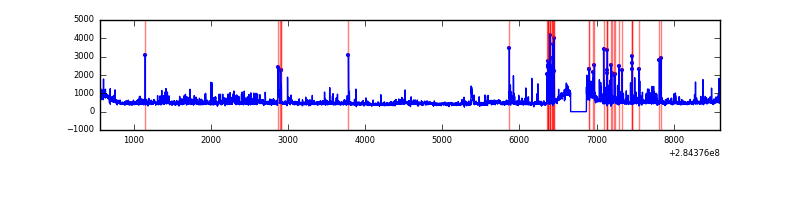 |
Top three noisy pixels from each quadrant. If the there are fewer than three noisy pixels in the level2.evt file, extra rows are filled as -1
| Pixel properties | Quadrant properties | ||||||
|---|---|---|---|---|---|---|---|
| Quadrant | DetID | PixID | Counts | Sigma | Mean | Median | Sigma |
| A | 14 | 237 | 76521 | 380.54 | 971 | 949 | 198.6 |
| A | 0 | 226 | 8389 | 37.46 | 971 | 949 | 198.6 |
| A | 3 | 137 | 7376 | 32.36 | 971 | 949 | 198.6 |
| B | 10 | 245 | 548603 | 2982.71 | 952 | 930 | 183.6 |
| B | 7 | 220 | 80562 | 433.69 | 952 | 930 | 183.6 |
| B | 0 | 189 | 75636 | 406.86 | 952 | 930 | 183.6 |
| C | 3 | 233 | 223334 | 1028.28 | 922 | 925 | 216.3 |
| C | 14 | 238 | 140855 | 646.95 | 922 | 925 | 216.3 |
| C | 5 | 218 | 40377 | 182.4 | 922 | 925 | 216.3 |
| D | 1 | 52 | 621996 | 2687.29 | 942 | 913 | 231.1 |
| D | 2 | 234 | 36567 | 154.27 | 942 | 913 | 231.1 |
| D | 15 | 0 | 23357 | 97.11 | 942 | 913 | 231.1 |
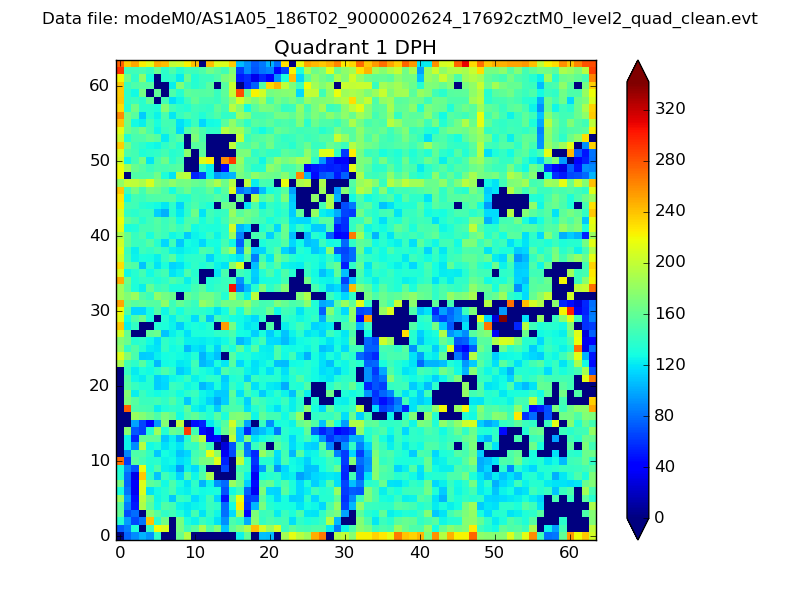
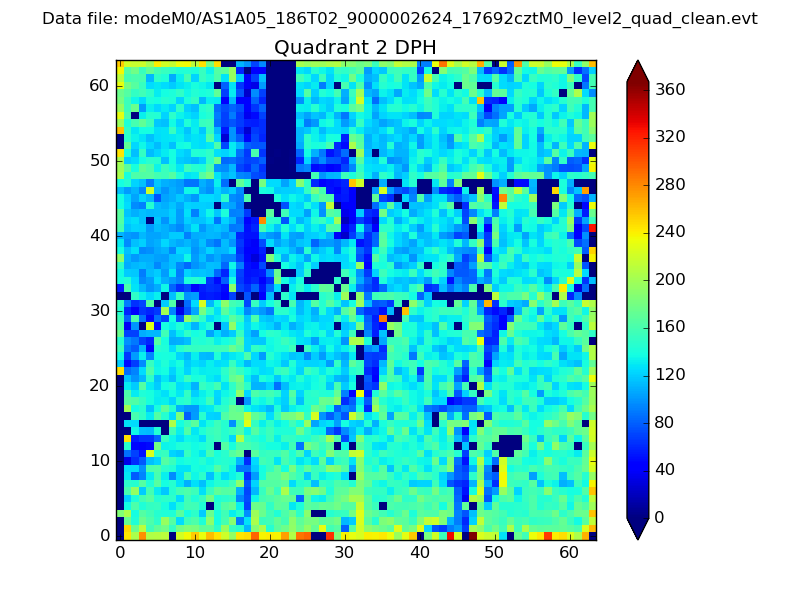
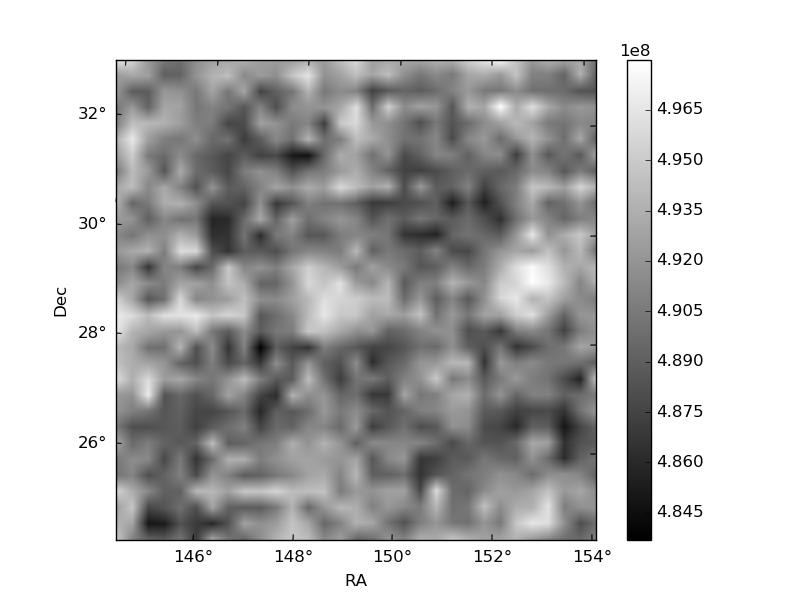
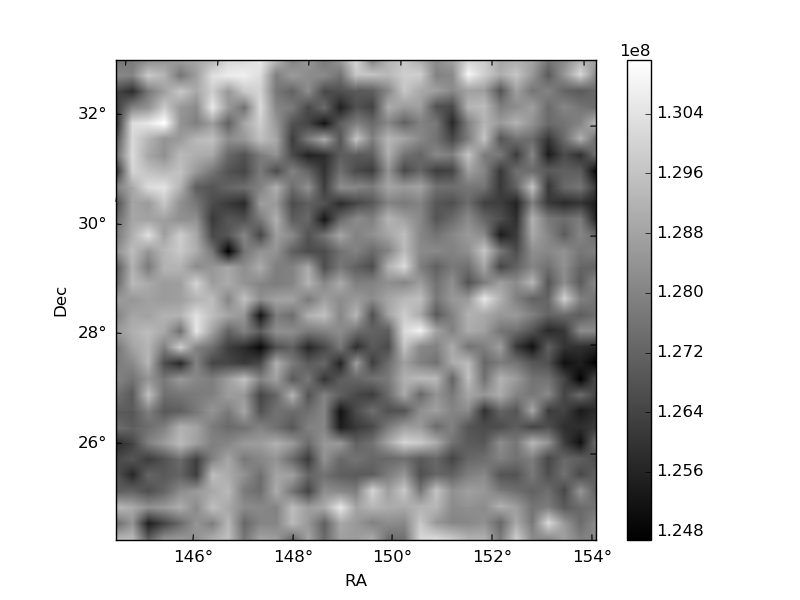
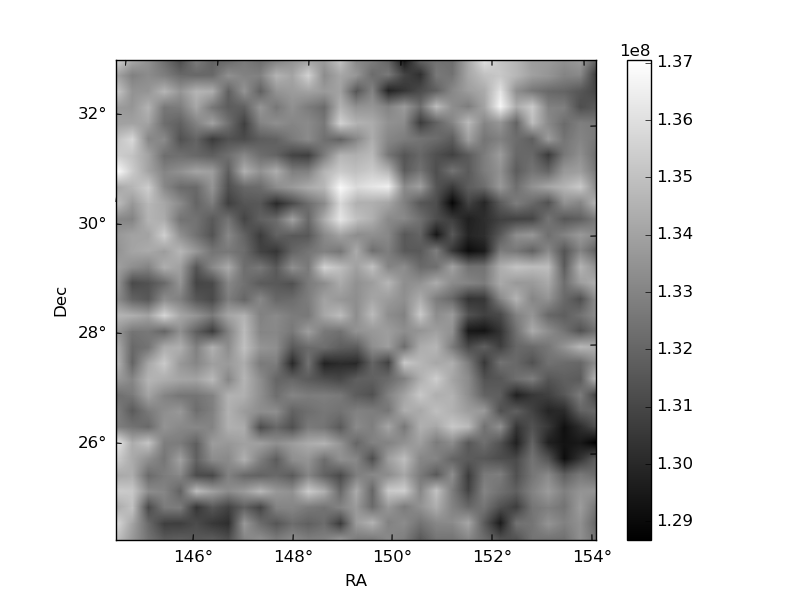
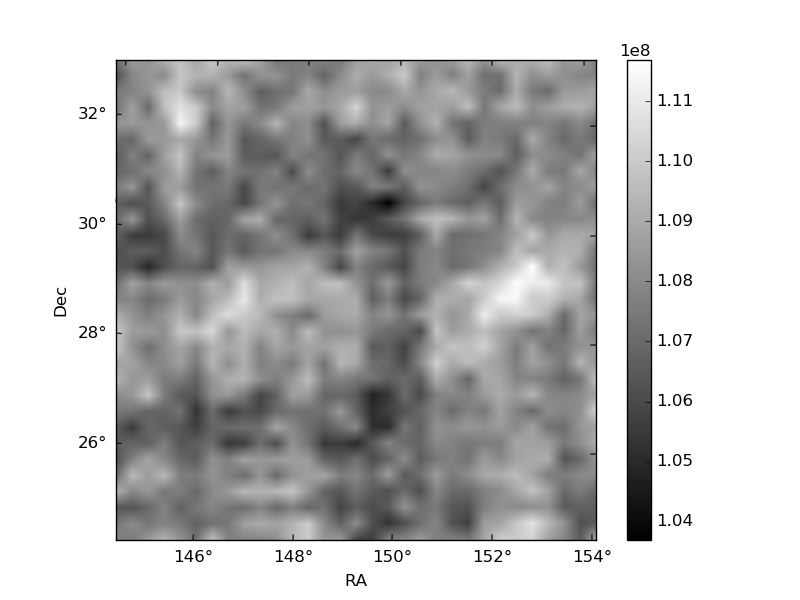
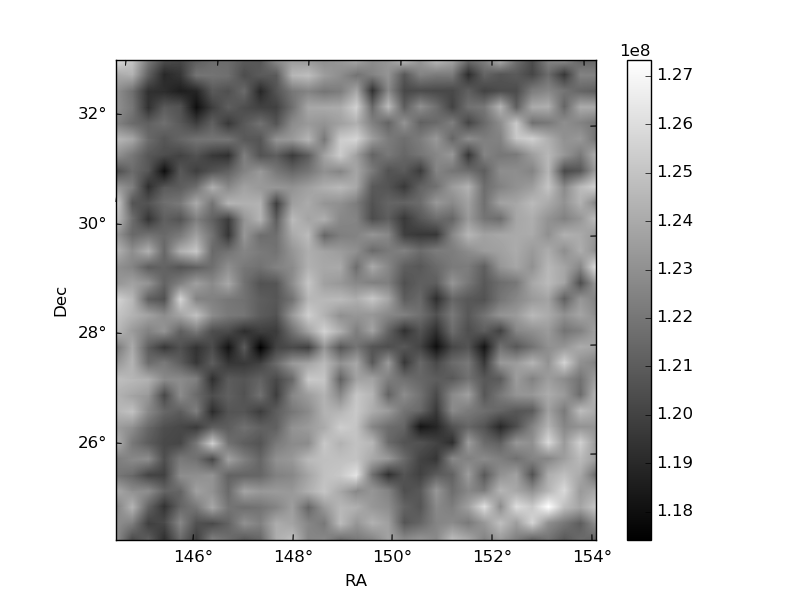
Histogram calculated using DETX and DETY for each event in the final _common_clean file
| Quadrant A | 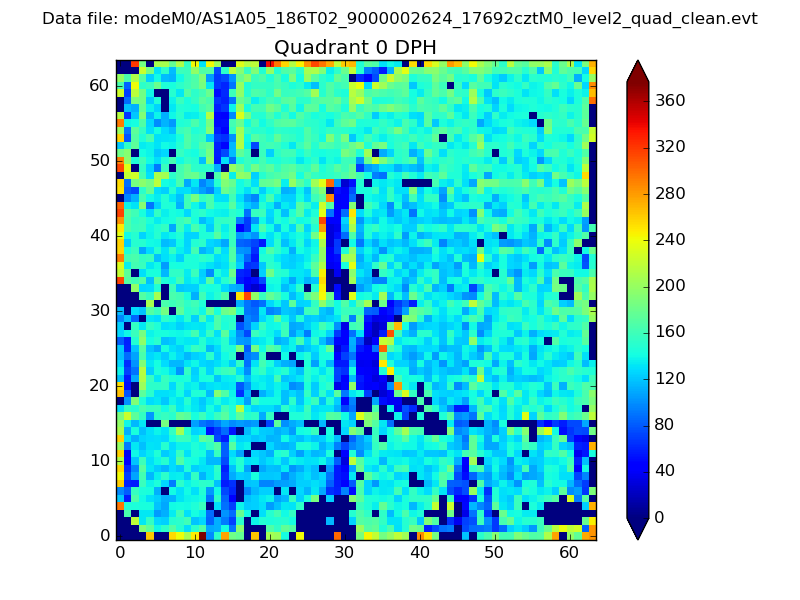 |
 |
Quadrant B |
|---|---|---|---|
| Quadrant D | 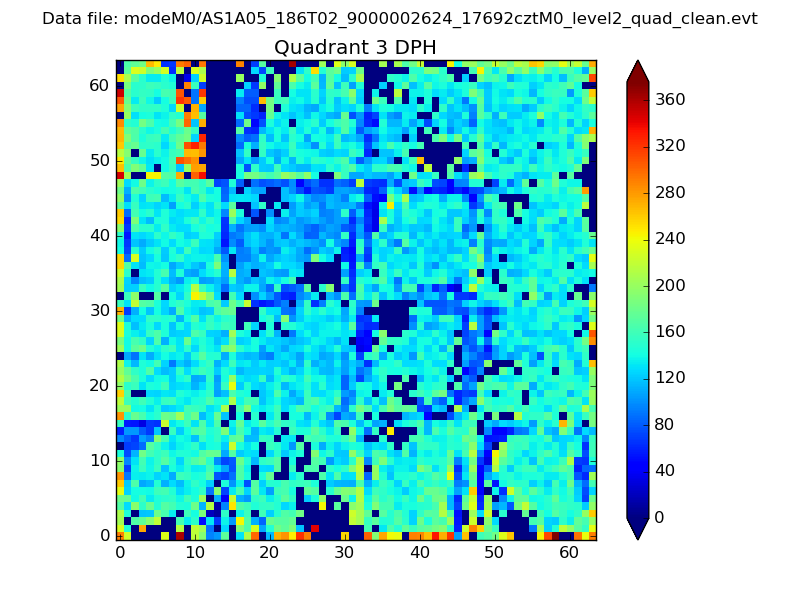 |
 |
Quadrant C |
| Plot type | Count rate plots | Images |
|---|---|---|
| Comparison with Poisson distribution Blue bars denote a histogram of data divided into 1 sec bins. Red curve is a Poisson curve with rate = median count rate of data. |
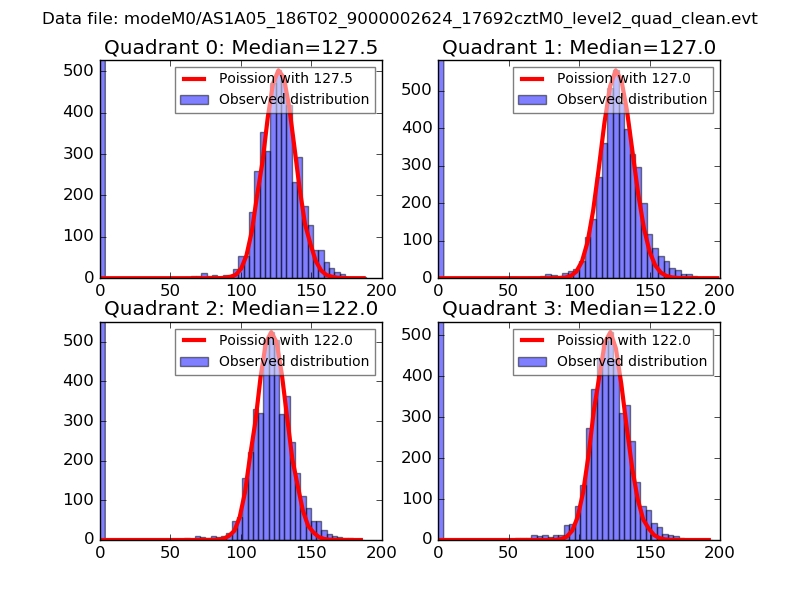 |
 |
| Quadrant-wise count rates Data is divided into 100 sec bins |
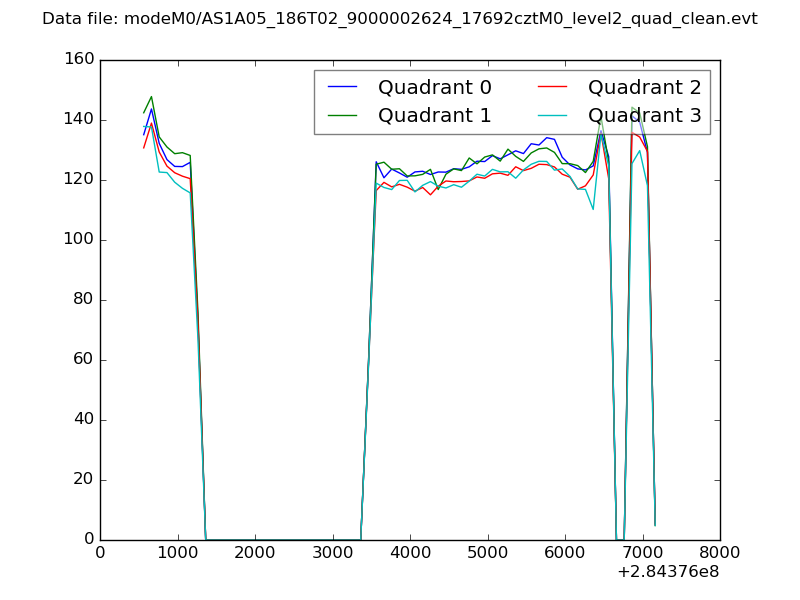 |
|
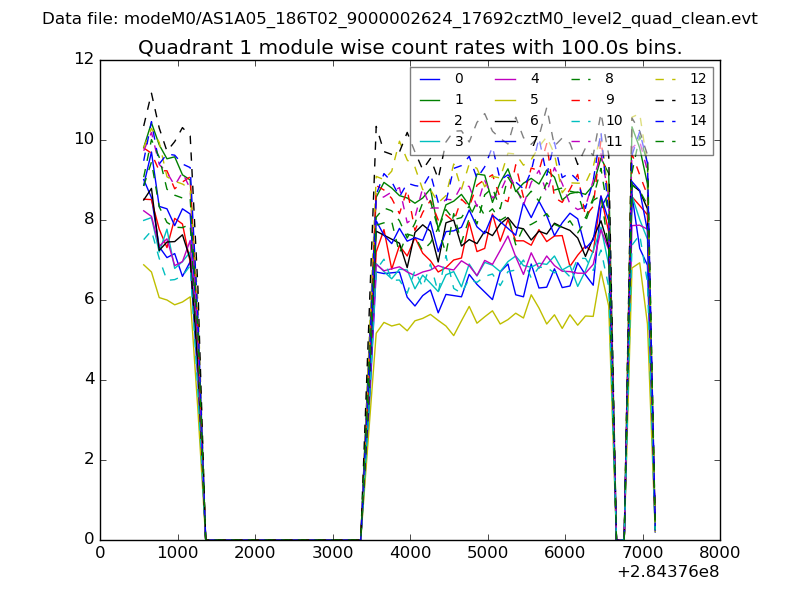
| Module-wise count rates for Quadrant A Data is divided into 100 sec bins |
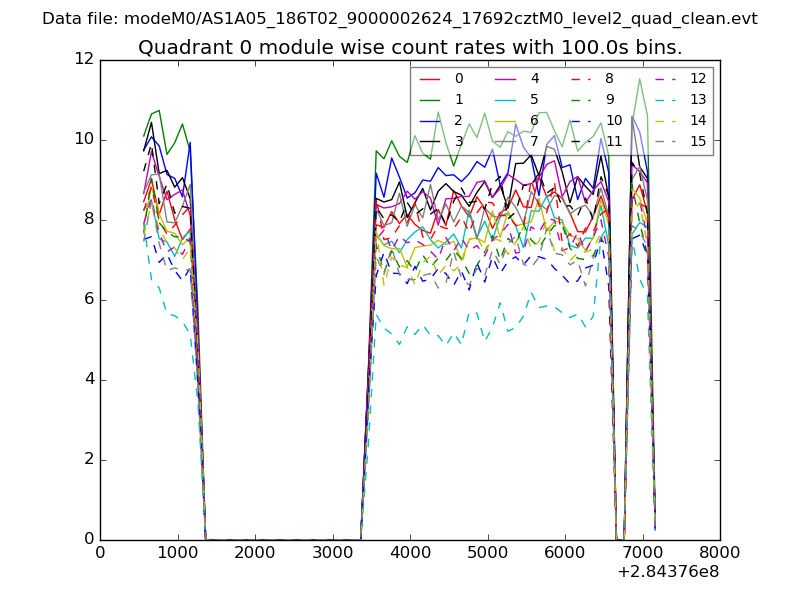 |
 |
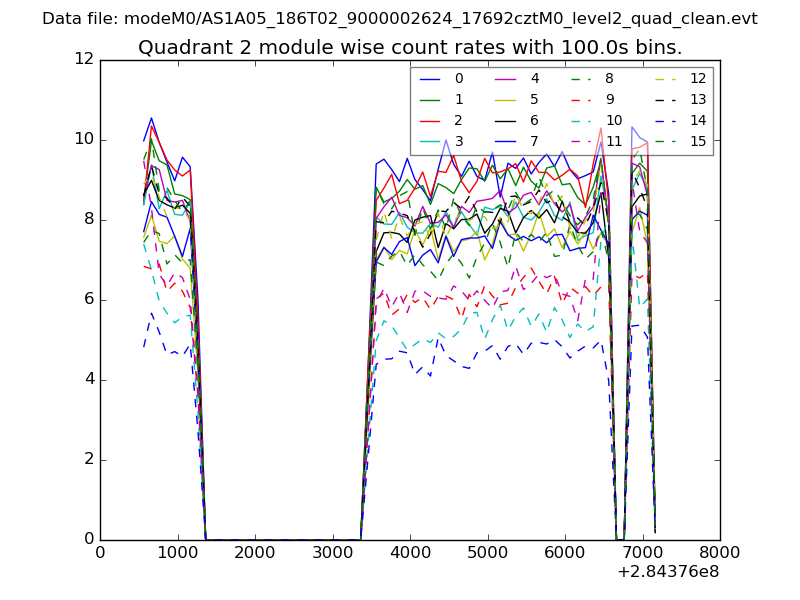
| Module-wise count rates for Quadrant B Data is divided into 100 sec bins |
 |
 |
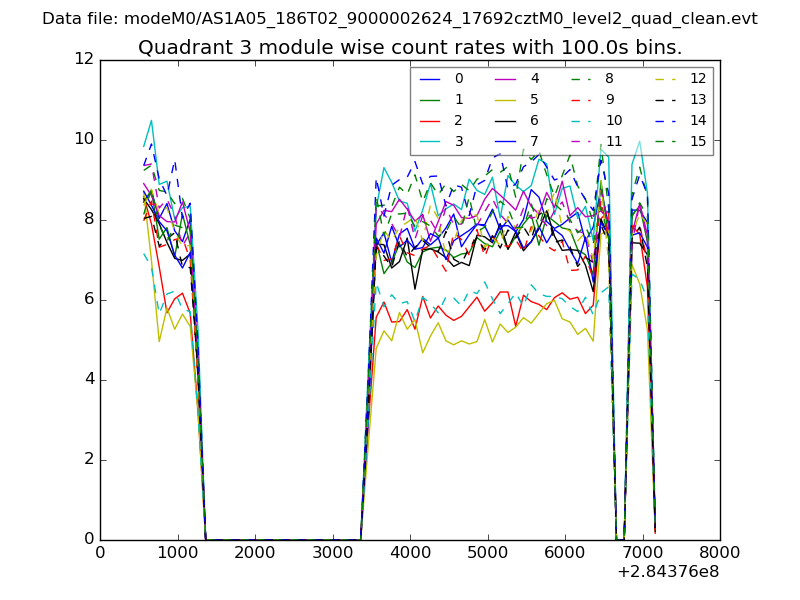
| Module-wise count rates for Quadrant C Data is divided into 100 sec bins |
 |
 |
| Module-wise count rates for Quadrant D Data is divided into 100 sec bins |
 |
 |
| Parameter | Plot |
|---|---|
| CZT HV Monitor | 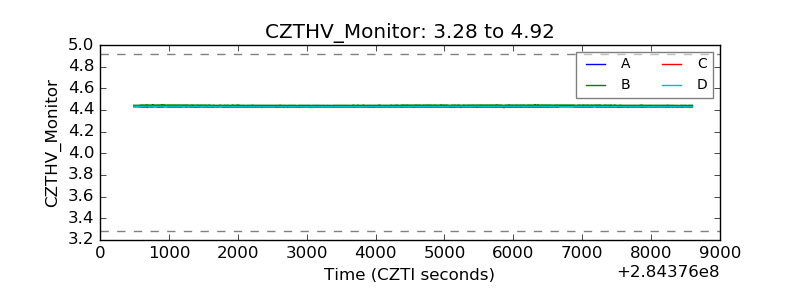 |
| D_VDD | 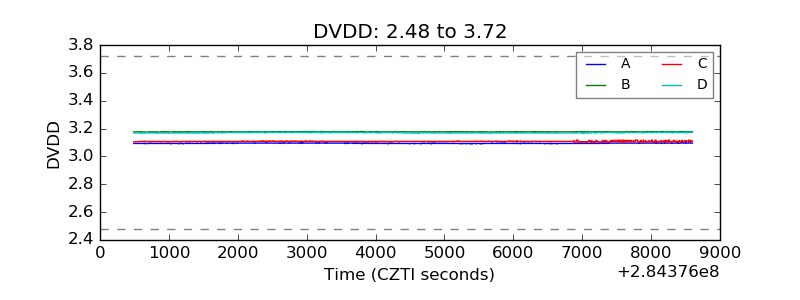 |
| Temperature 1 | 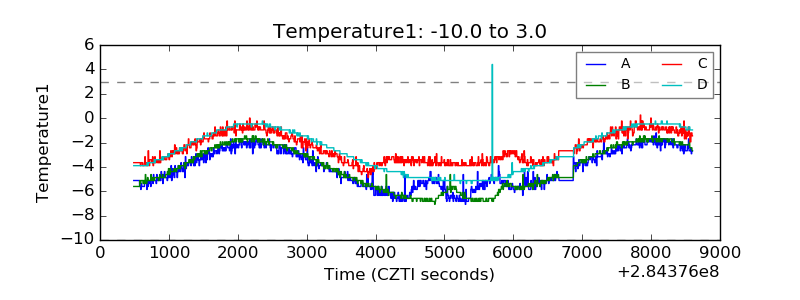 |
| Veto HV Monitor | 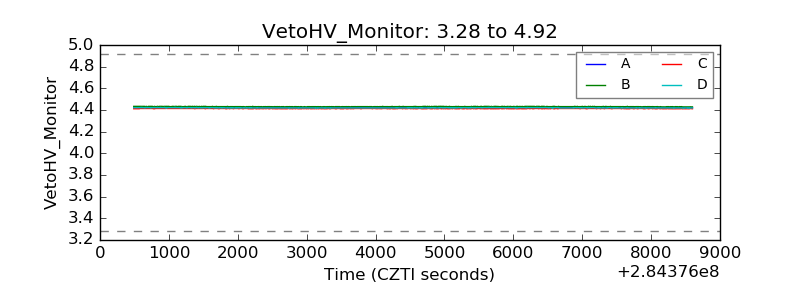 |
| Veto LLD | 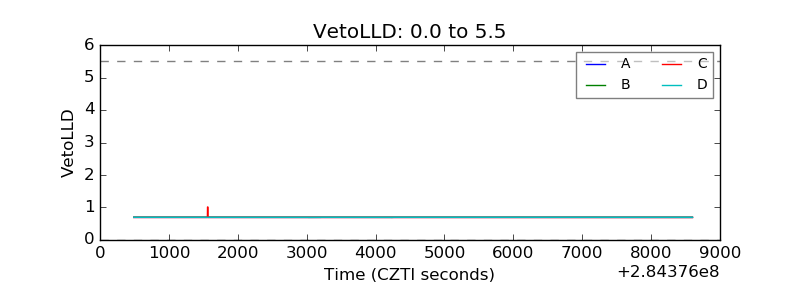 |
| Alpha Counter | 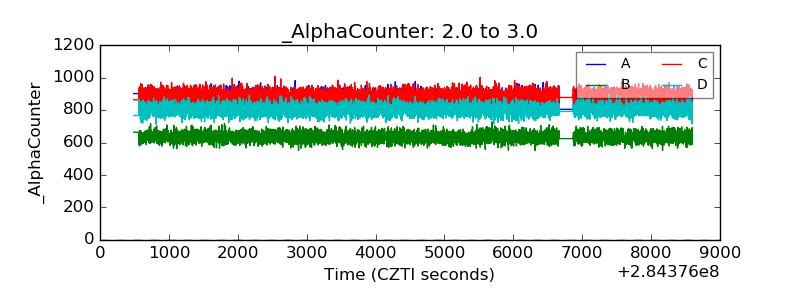 |
| _CPM_Rate |  |
| CZT Counter | 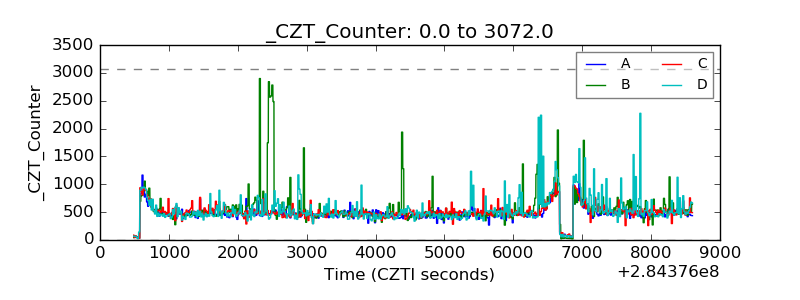 |
| +2.5 Volts monitor |  |
| +5 Volts monitor |  |
| _ROLL_ROT | 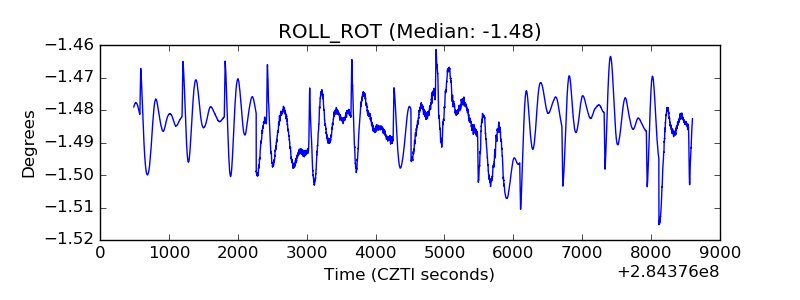 |
| _Roll_DEC | 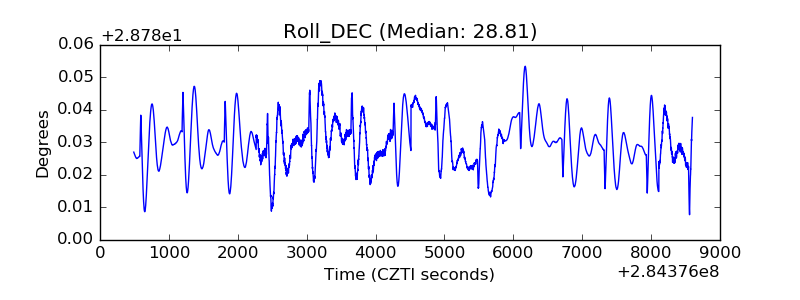 |
| _Roll_RA | 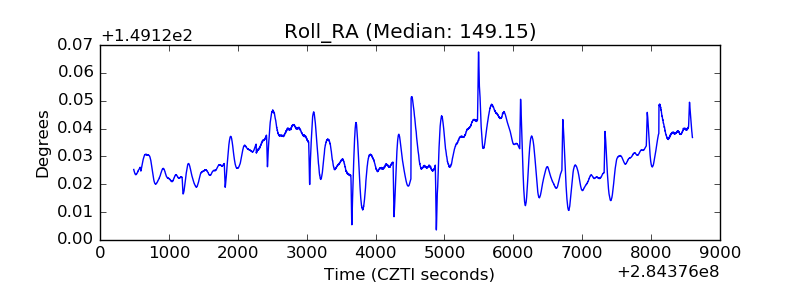 |
| Veto Counter | 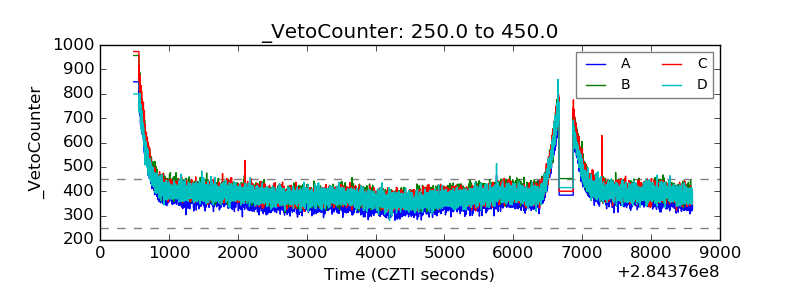 |