| Param | Original file | Final file |
|---|---|---|
| Filename | modeM0/AS1T03_040T01_9000002628cztM0_level2.fits | modeM0/AS1T03_040T01_9000002628cztM0_level2_quad_clean.evt |
| Size (bytes) | 653,028,480 | 600,382,080 |
| Size | 622.8 MB | 572.6 MB |
| Events in quadrant A | 4,019,608 | 3,565,513 |
| Events in quadrant B | 3,862,552 | 3,587,290 |
| Events in quadrant C | 3,925,850 | 3,422,101 |
| Events in quadrant D | 3,219,924 | 2,861,932 |
| Mode SS | |||
|---|---|---|---|
| Quadrant | BADHDUFLAG | Total packets | Discarded packets |
| A | 0 | 1416 | 0 |
| B | 0 | 1416 | 0 |
| C | 0 | 1416 | 0 |
| D | 0 | 1416 | 0 |
| Mode M0 | |||
|---|---|---|---|
| Quadrant | BADHDUFLAG | Total packets | Discarded packets |
| A | 0 | 145402 | 0 |
| B | 0 | 152150 | 0 |
| C | 0 | 145813 | 0 |
| D | 0 | 217747 | 0 |
| Mode M9 | |||
|---|---|---|---|
| Quadrant | BADHDUFLAG | Total packets | Discarded packets |
| A | 0 | 107 | 0 |
| B | 0 | 107 | 0 |
| C | 0 | 107 | 0 |
| D | 0 | 107 | 0 |
| Quadrant | Total seconds | Saturated seconds | Saturation percentage |
|---|---|---|---|
| A | 69174 | 1086 | 1.569954% |
| B | 69174 | 1335 | 1.929916% |
| C | 69174 | 1122 | 1.621997% |
| D | 69174 | 8057 | 11.647440% |
Noise dominated data is calculated using 1-second bins in cleaned event files. If a bin has >2000 counts, and if more than 50% of those come from <1% of pixels, then it is considered to be noise-dominated and hence unusable.
| Quadrant | # 1 sec bins | Bins with >0 counts | Bins with >2000 counts | High rate bins dominated by noise | Noise dominated (total time) | Noise dominated (detector-on time) | Marked lightcurve |
|---|---|---|---|---|---|---|---|
| A | 80205 | 69174 | 0 | 0 | 0.00% | 0.00% |  |
| B | 80205 | 69170 | 0 | 0 | 0.00% | 0.00% |  |
| C | 80205 | 69172 | 0 | 0 | 0.00% | 0.00% |  |
| D | 80205 | 68942 | 0 | 0 | 0.00% | 0.00% |  |
Top three noisy pixels from each quadrant. If the there are fewer than three noisy pixels in the level2.evt file, extra rows are filled as -1
| Pixel properties | Quadrant properties | ||||||
|---|---|---|---|---|---|---|---|
| Quadrant | DetID | PixID | Counts | Sigma | Mean | Median | Sigma |
| A | 0 | 29 | 3814 | 10.76 | 1045 | 975 | 264.0 |
| A | 7 | 110 | 3207 | 8.46 | 1045 | 975 | 264.0 |
| A | 0 | 30 | 3103 | 8.06 | 1045 | 975 | 264.0 |
| B | 2 | 9 | 3220 | 11.36 | 1019 | 972 | 197.9 |
| B | 2 | 8 | 2627 | 8.36 | 1019 | 972 | 197.9 |
| B | 14 | 254 | 2548 | 7.96 | 1019 | 972 | 197.9 |
| C | 1 | 80 | 2967 | 7.55 | 1036 | 966 | 265.1 |
| C | 1 | 81 | 2880 | 7.22 | 1036 | 966 | 265.1 |
| C | 12 | 241 | 2788 | 6.87 | 1036 | 966 | 265.1 |
| D | 3 | 14 | 2416 | 6.39 | 919 | 836 | 247.0 |
| D | 15 | 46 | 2279 | 5.84 | 919 | 836 | 247.0 |
| D | 6 | 67 | 2279 | 5.84 | 919 | 836 | 247.0 |
Histogram calculated using DETX and DETY for each event in the final _common_clean file
| Quadrant A |  |
 |
Quadrant B |
|---|---|---|---|
| Quadrant D |  |
 |
Quadrant C |
| Plot type | Count rate plots | Images |
|---|---|---|
| Comparison with Poisson distribution Blue bars denote a histogram of data divided into 1 sec bins. Red curve is a Poisson curve with rate = median count rate of data. |
 |
 |
| Quadrant-wise count rates Data is divided into 100 sec bins |
 |
|
| Module-wise count rates for Quadrant A Data is divided into 100 sec bins |
 |
 |
| Module-wise count rates for Quadrant B Data is divided into 100 sec bins |
 |
 |
| Module-wise count rates for Quadrant C Data is divided into 100 sec bins |
 |
 |
| Module-wise count rates for Quadrant D Data is divided into 100 sec bins |
 |
 |
| Parameter | Plot |
|---|---|
| CZT HV Monitor |  |
| D_VDD |  |
| Temperature 1 |  |
| Veto HV Monitor |  |
| Veto LLD |  |
| Alpha Counter |  |
| _CPM_Rate |  |
| CZT Counter |  |
| +2.5 Volts monitor |  |
| +5 Volts monitor |  |
| _ROLL_ROT |  |
| _Roll_DEC |  |
| _Roll_RA | 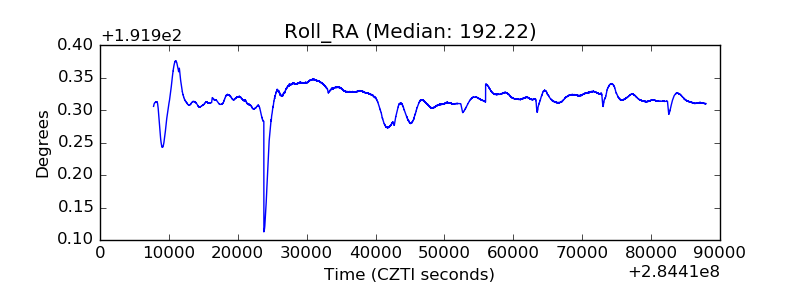 |
| Veto Counter |  |