| Param | Original file | Final file |
|---|---|---|
| Filename | modeM0/AS1T03_040T01_9000002628_17699cztM0_level2.evt | modeM0/AS1T03_040T01_9000002628_17699cztM0_level2_quad_clean.evt |
| Size (bytes) | 247,567,680 | 45,555,840 |
| Size | 236.1 MB | 43.4 MB |
| Events in quadrant A | 1,573,352 | 290,932 |
| Events in quadrant B | 2,138,203 | 294,893 |
| Events in quadrant C | 1,680,220 | 287,685 |
| Events in quadrant D | 1,888,183 | 279,698 |
| Mode SS | |||
|---|---|---|---|
| Quadrant | BADHDUFLAG | Total packets | Discarded packets |
| A | 0 | 66 | 0 |
| B | 0 | 66 | 0 |
| C | 0 | 66 | 0 |
| D | 0 | 66 | 0 |
| Mode M0 | |||
|---|---|---|---|
| Quadrant | BADHDUFLAG | Total packets | Discarded packets |
| A | 0 | 6683 | 1 |
| B | 0 | 8449 | 1 |
| C | 0 | 6963 | 1 |
| D | 0 | 7742 | 1 |
| Mode M9 | |||
|---|---|---|---|
| Quadrant | BADHDUFLAG | Total packets | Discarded packets |
| A | 0 | 11 | 0 |
| B | 0 | 11 | 0 |
| C | 0 | 11 | 0 |
| D | 0 | 11 | 0 |
| Quadrant | Total seconds | Saturated seconds | Saturation percentage |
|---|---|---|---|
| A | 3178 | 26 | 0.818125% |
| B | 3178 | 161 | 5.066079% |
| C | 3178 | 51 | 1.604783% |
| D | 3178 | 80 | 2.517306% |
Noise dominated data is calculated using 1-second bins in cleaned event files. If a bin has >2000 counts, and if more than 50% of those come from <1% of pixels, then it is considered to be noise-dominated and hence unusable.
| Quadrant | # 1 sec bins | Bins with >0 counts | Bins with >2000 counts | High rate bins dominated by noise | Noise dominated (total time) | Noise dominated (detector-on time) | Marked lightcurve |
|---|---|---|---|---|---|---|---|
| A | 4308 | 3179 | 0 | 0 | 0.00% | 0.00% | 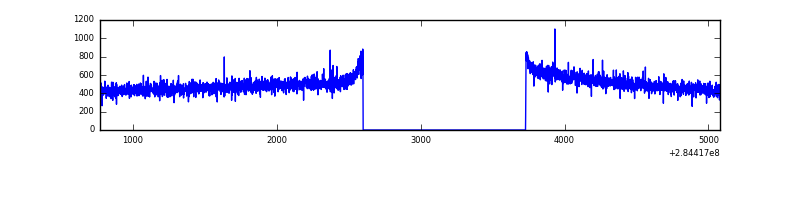 |
| B | 4308 | 3179 | 90 | 90 | 2.09% | 2.83% | 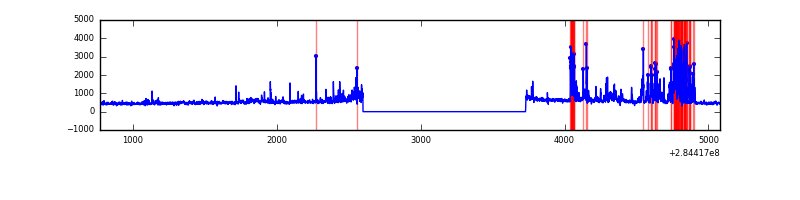 |
| C | 4308 | 3179 | 0 | 0 | 0.00% | 0.00% | 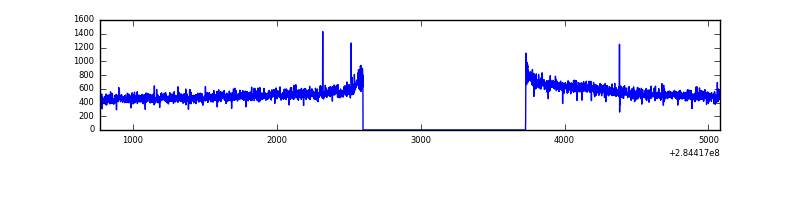 |
| D | 4308 | 3179 | 25 | 25 | 0.58% | 0.79% | 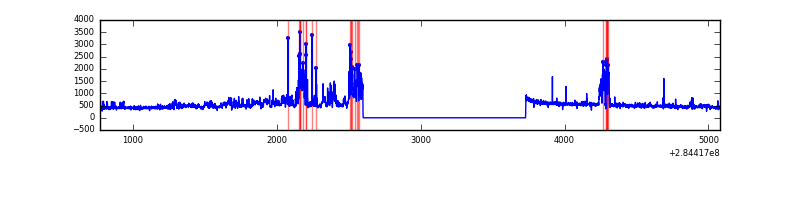 |
Top three noisy pixels from each quadrant. If the there are fewer than three noisy pixels in the level2.evt file, extra rows are filled as -1
| Pixel properties | Quadrant properties | ||||||
|---|---|---|---|---|---|---|---|
| Quadrant | DetID | PixID | Counts | Sigma | Mean | Median | Sigma |
| A | 0 | 226 | 3534 | 37.08 | 409 | 399 | 84.5 |
| A | 12 | 194 | 3037 | 31.2 | 409 | 399 | 84.5 |
| A | 3 | 137 | 3001 | 30.78 | 409 | 399 | 84.5 |
| B | 10 | 245 | 497679 | 6432.3 | 403 | 394 | 77.3 |
| B | 0 | 189 | 23691 | 301.34 | 403 | 394 | 77.3 |
| B | 12 | 111 | 9068 | 112.2 | 403 | 394 | 77.3 |
| C | 3 | 233 | 65164 | 697.6 | 394 | 395 | 92.8 |
| C | 14 | 238 | 60288 | 645.08 | 394 | 395 | 92.8 |
| C | 5 | 218 | 13982 | 146.34 | 394 | 395 | 92.8 |
| D | 7 | 238 | 255063 | 2466.72 | 393 | 383 | 103.2 |
| D | 1 | 20 | 82602 | 796.34 | 393 | 383 | 103.2 |
| D | 1 | 52 | 19342 | 183.63 | 393 | 383 | 103.2 |
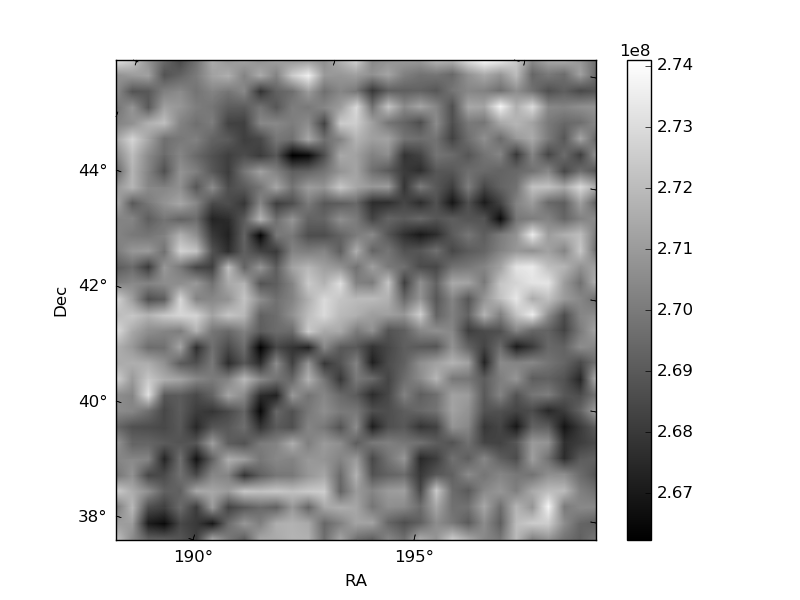
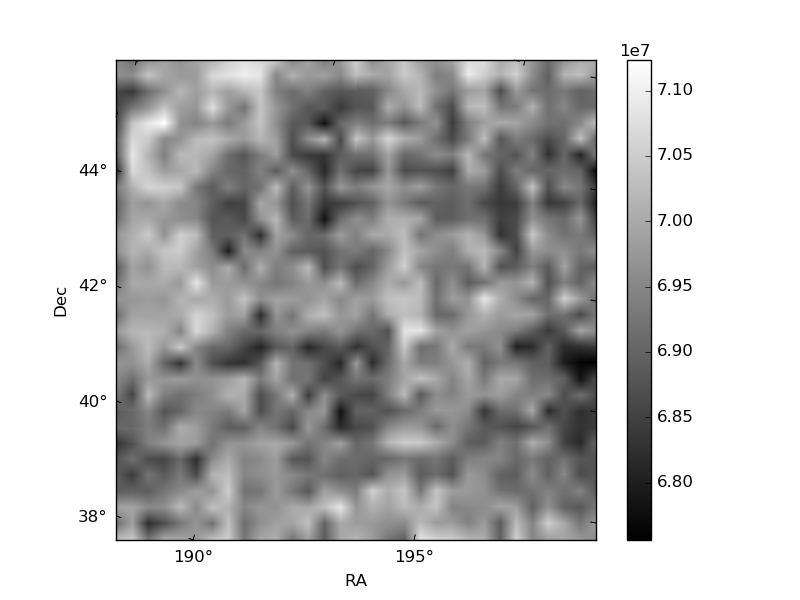
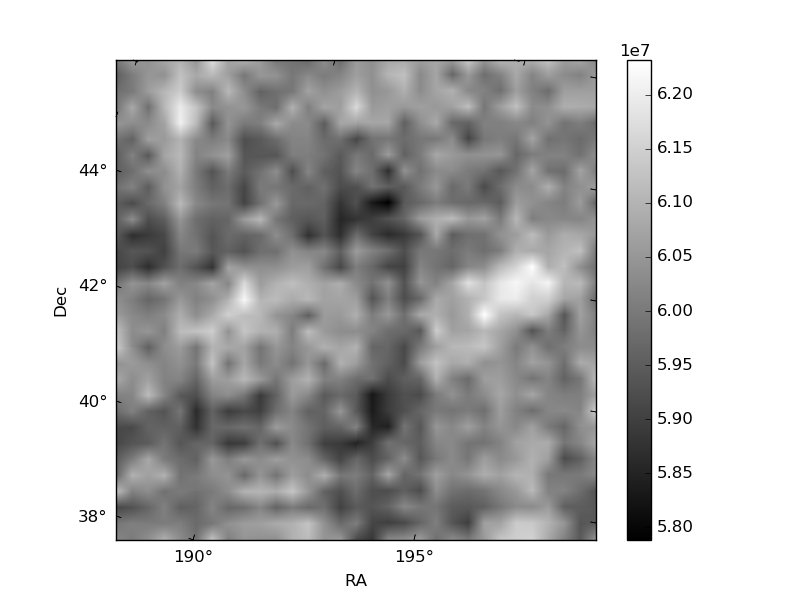
Histogram calculated using DETX and DETY for each event in the final _common_clean file
| Quadrant A | 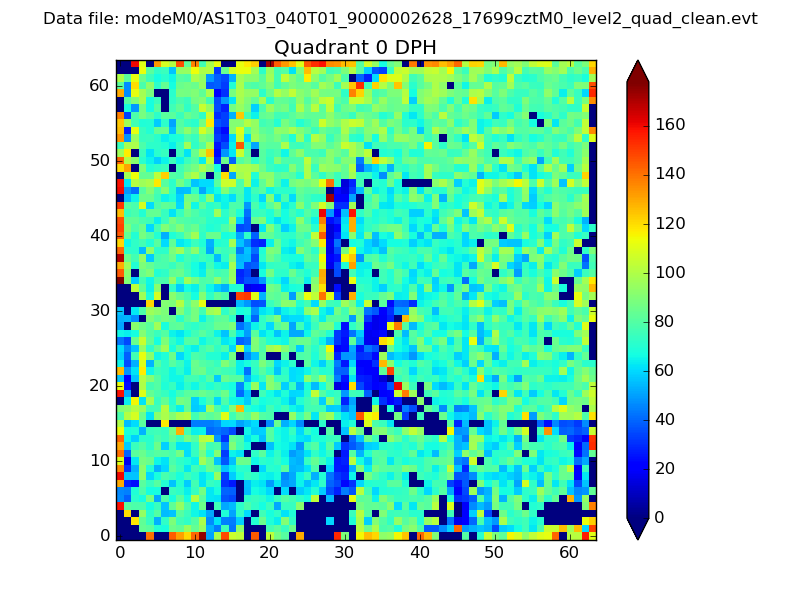 |
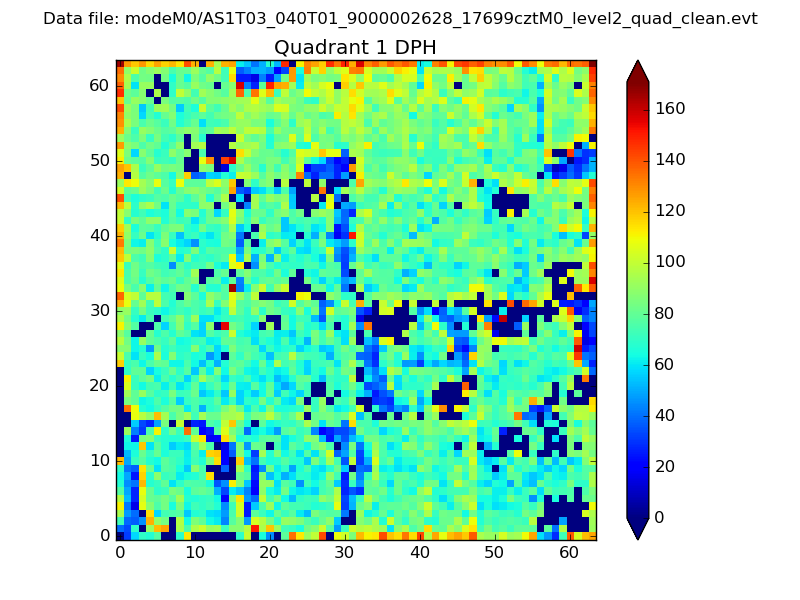 |
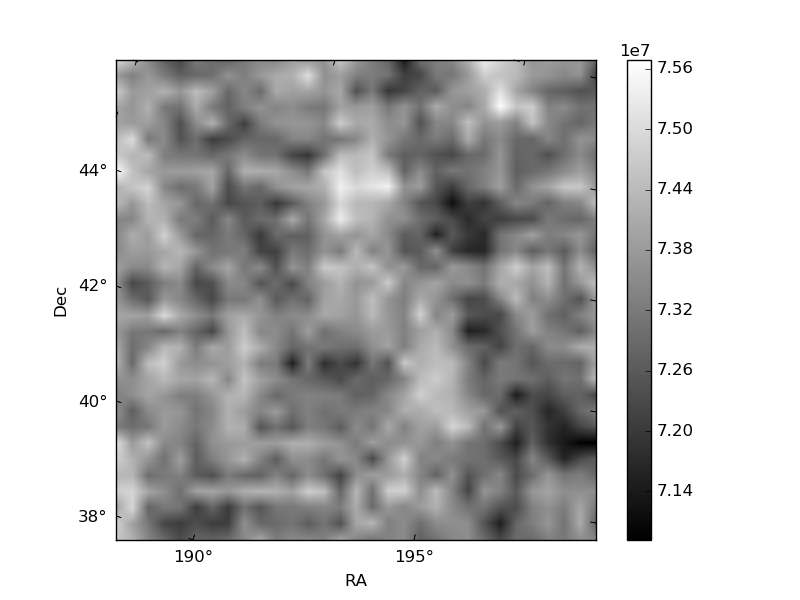
Quadrant B |
|---|---|---|---|
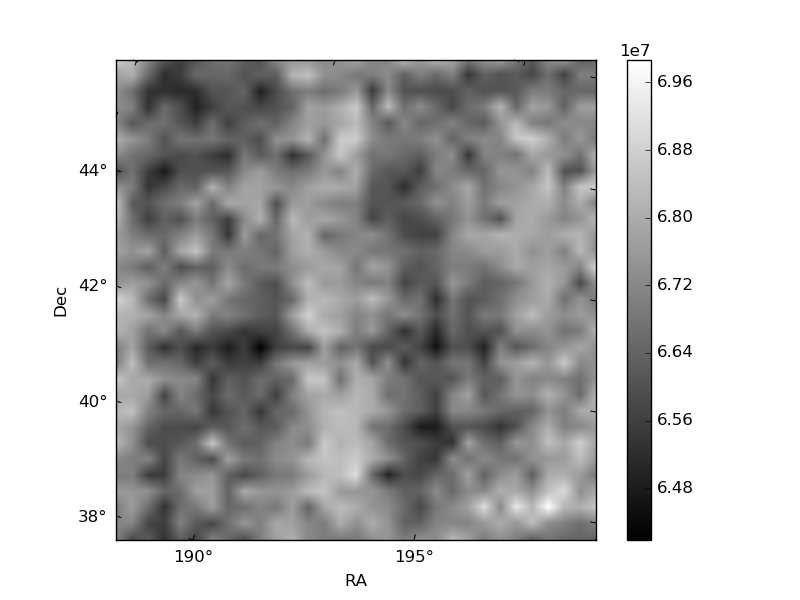
| Quadrant D | 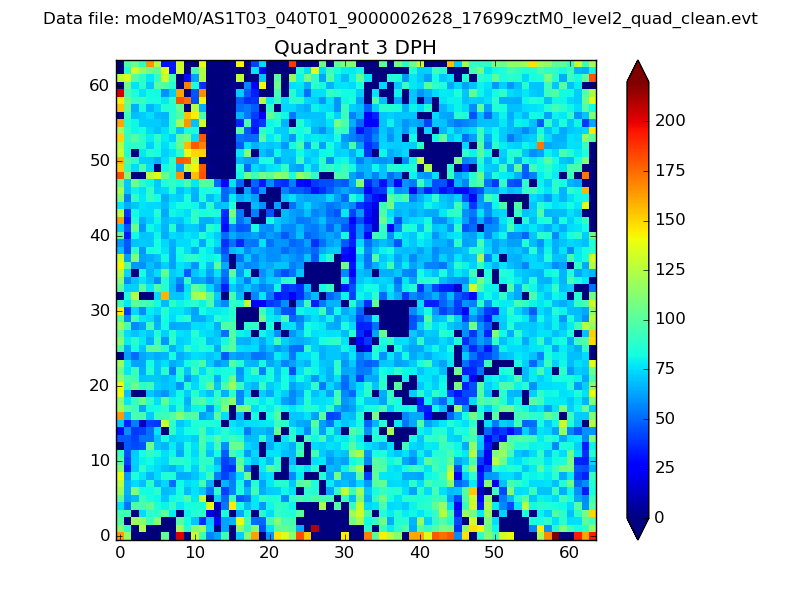 |
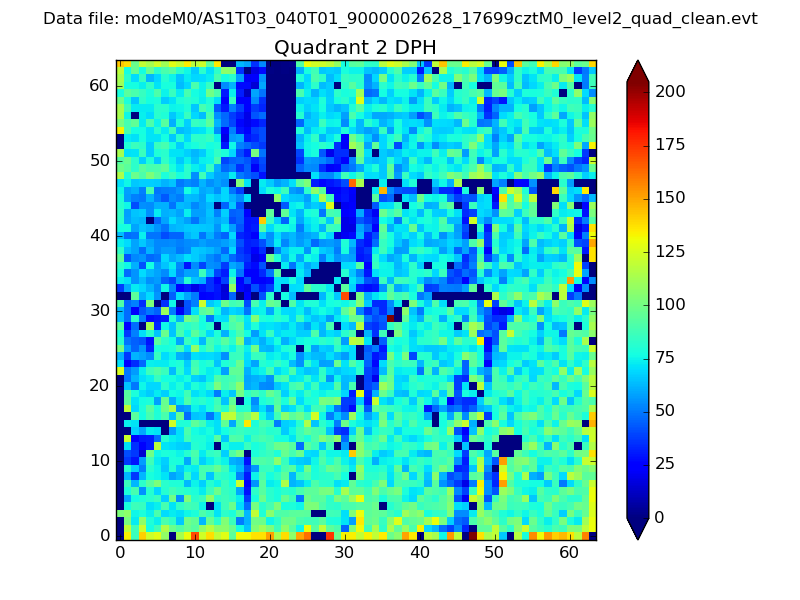 |
Quadrant C |
| Plot type | Count rate plots | Images |
|---|---|---|
| Comparison with Poisson distribution Blue bars denote a histogram of data divided into 1 sec bins. Red curve is a Poisson curve with rate = median count rate of data. |
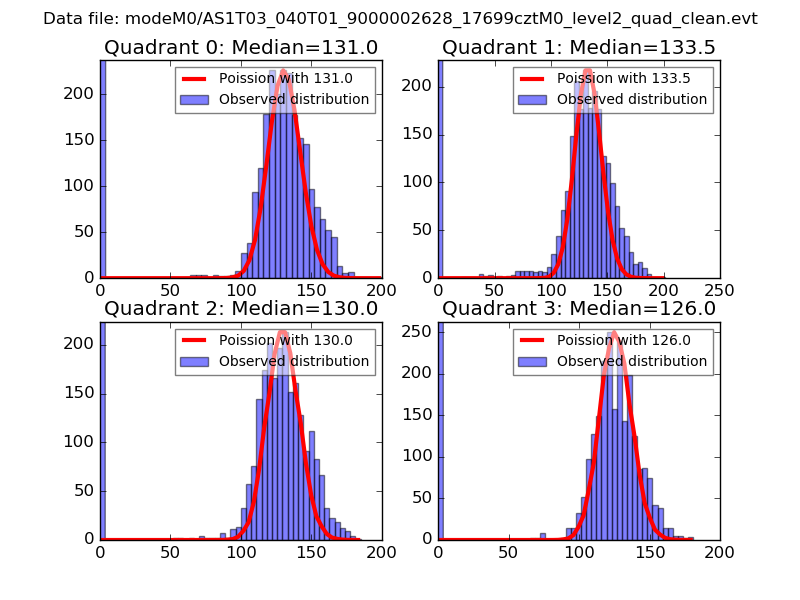 |
 |
| Quadrant-wise count rates Data is divided into 100 sec bins |
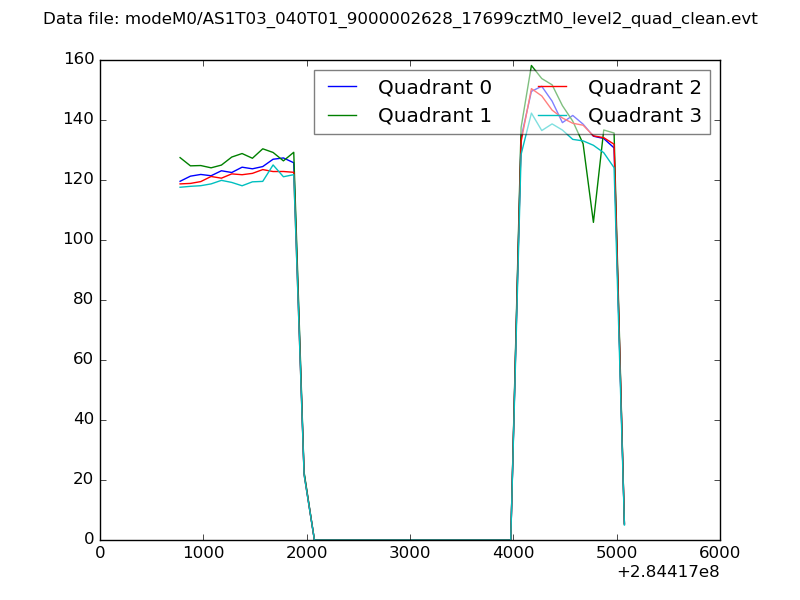 |
|
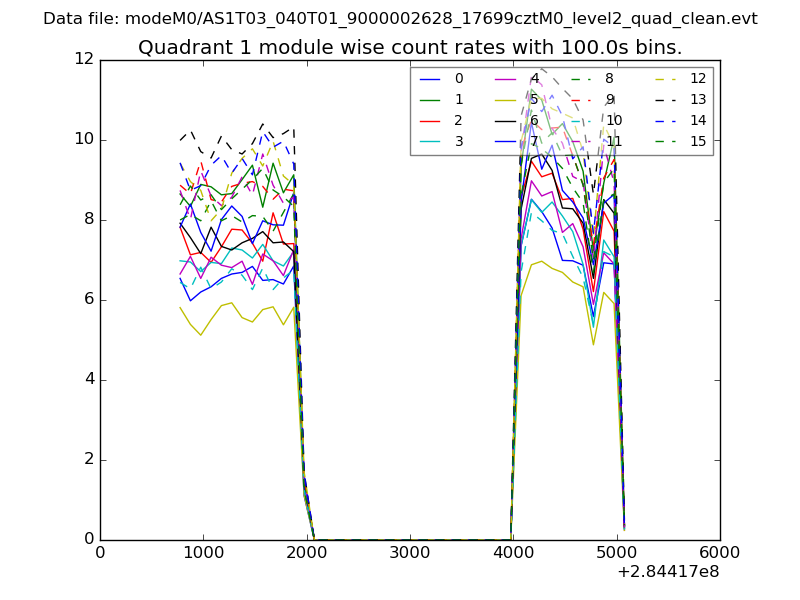
| Module-wise count rates for Quadrant A Data is divided into 100 sec bins |
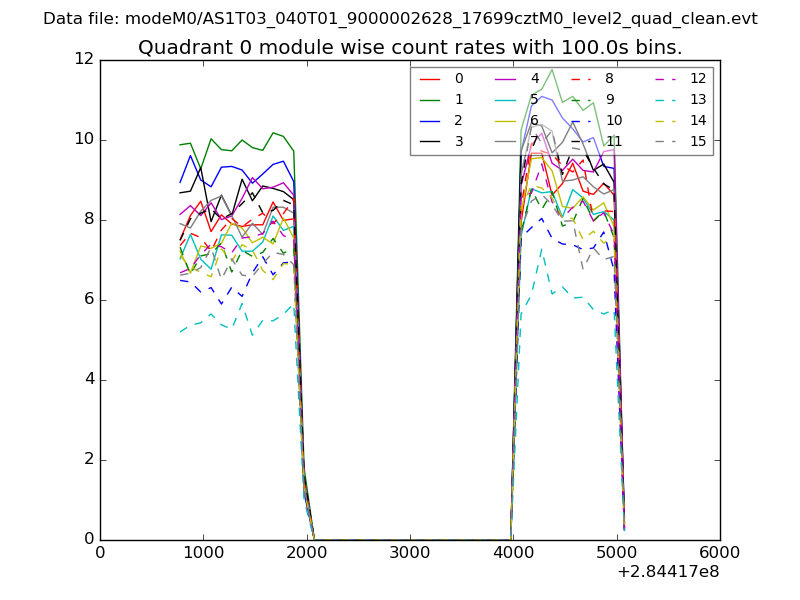 |
 |
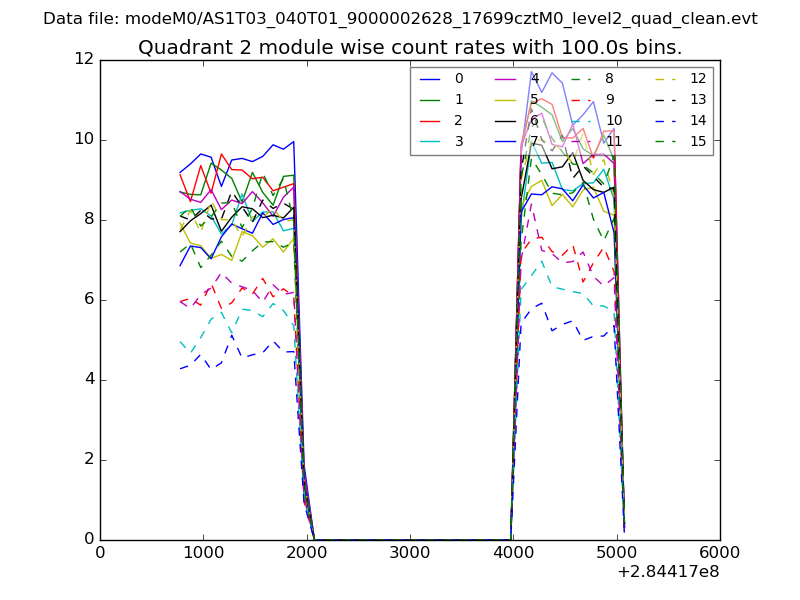
| Module-wise count rates for Quadrant B Data is divided into 100 sec bins |
 |
 |
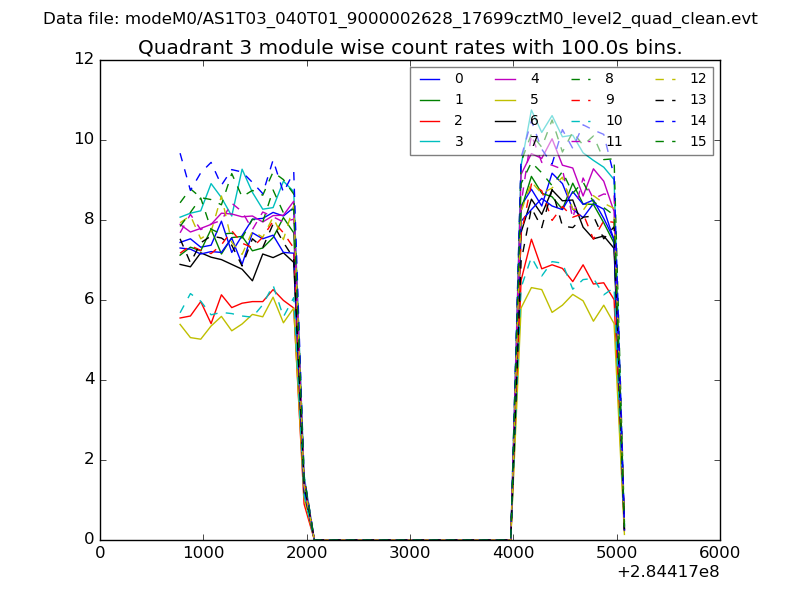
| Module-wise count rates for Quadrant C Data is divided into 100 sec bins |
 |
 |
| Module-wise count rates for Quadrant D Data is divided into 100 sec bins |
 |
 |
| Parameter | Plot |
|---|---|
| CZT HV Monitor | 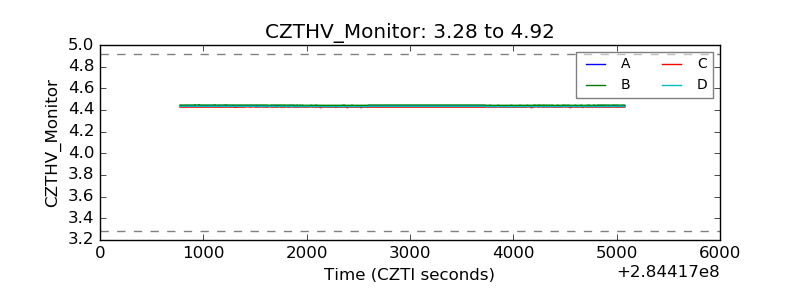 |
| D_VDD | 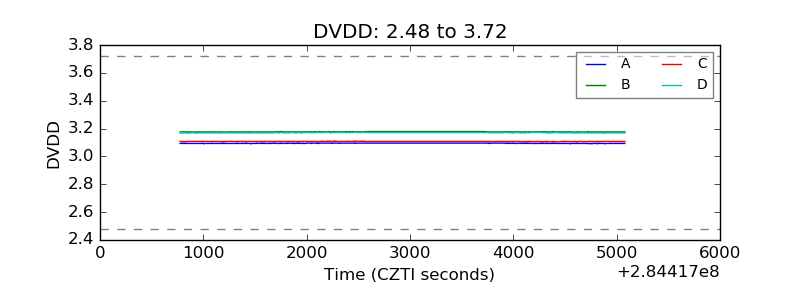 |
| Temperature 1 | 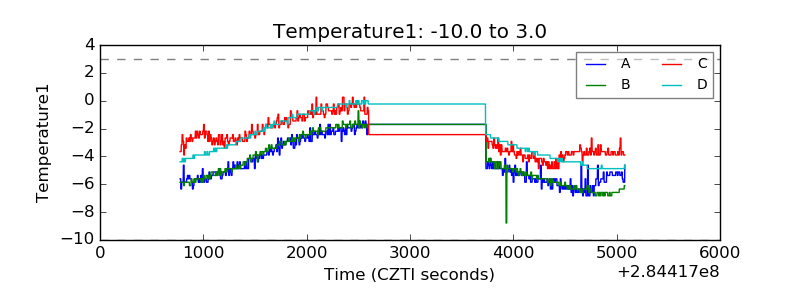 |
| Veto HV Monitor | 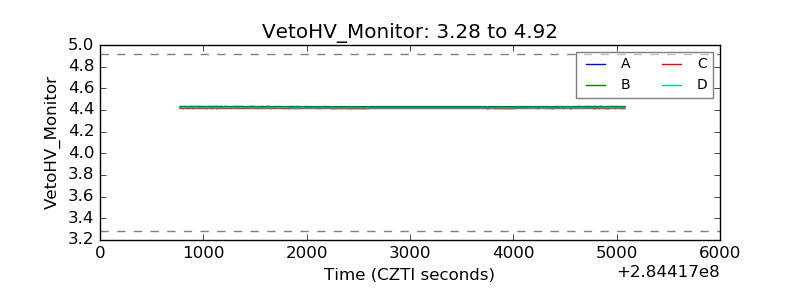 |
| Veto LLD | 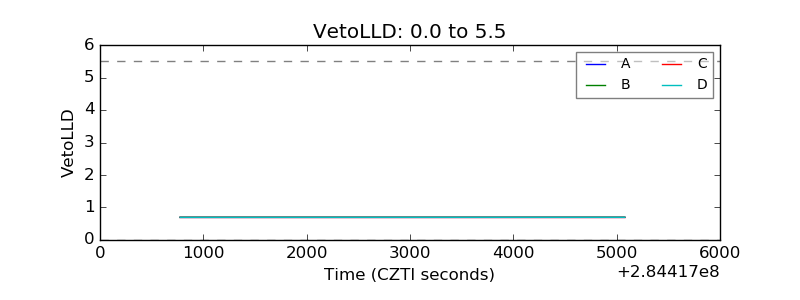 |
| Alpha Counter | 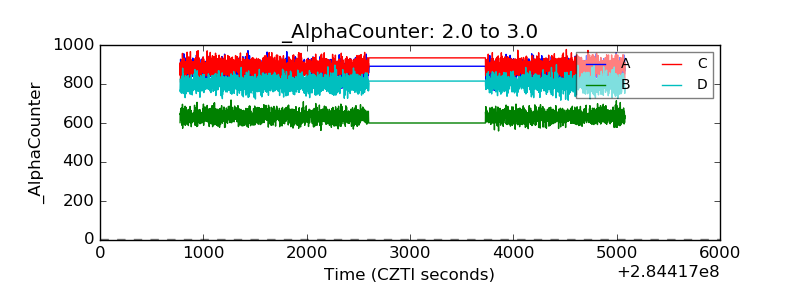 |
| _CPM_Rate | 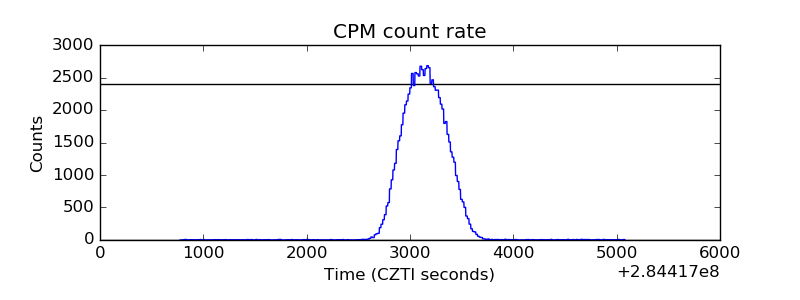 |
| CZT Counter | 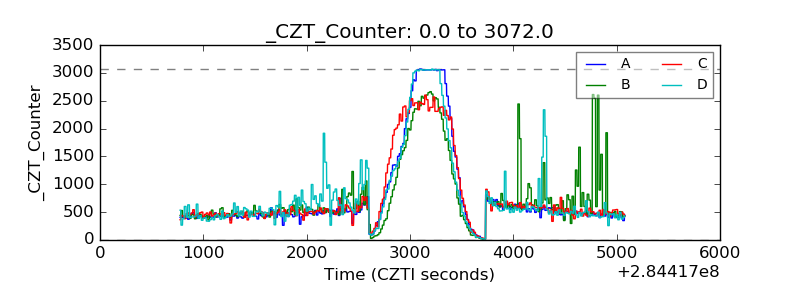 |
| +2.5 Volts monitor |  |
| +5 Volts monitor |  |
| _ROLL_ROT | 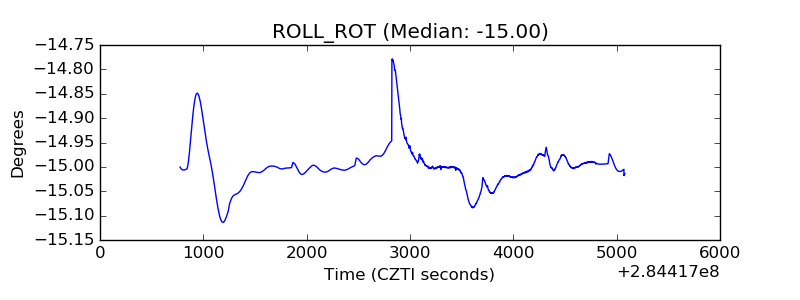 |
| _Roll_DEC | 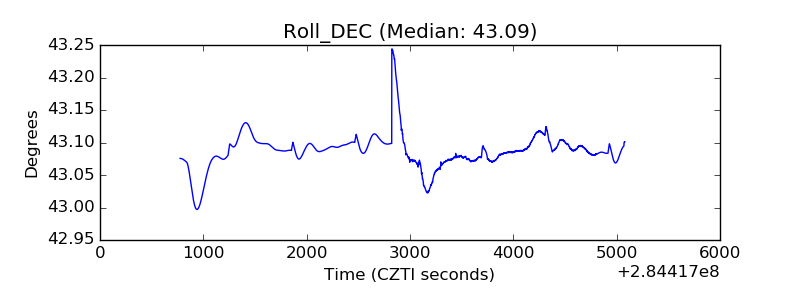 |
| _Roll_RA | 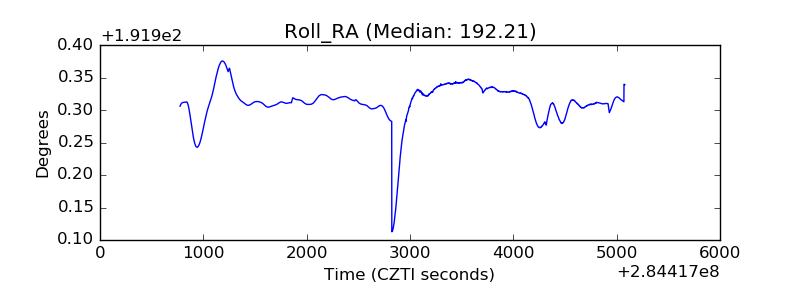 |
| Veto Counter | 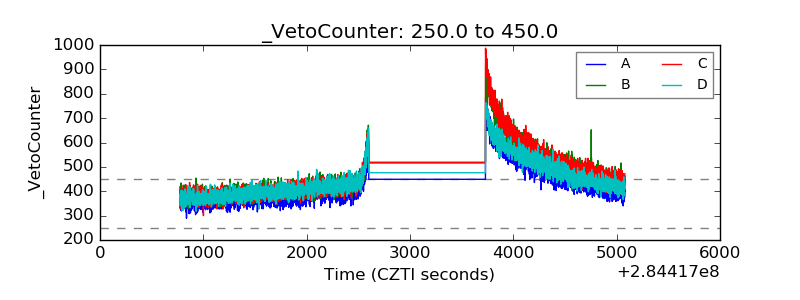 |