| Param | Original file | Final file |
|---|---|---|
| Filename | modeM0/AS1T03_040T01_9000002628_17703cztM0_level2.evt | modeM0/AS1T03_040T01_9000002628_17703cztM0_level2_quad_clean.evt |
| Size (bytes) | 480,352,320 | 95,155,200 |
| Size | 458.1 MB | 90.7 MB |
| Events in quadrant A | 3,126,035 | 621,299 |
| Events in quadrant B | 3,369,304 | 637,892 |
| Events in quadrant C | 3,223,548 | 604,654 |
| Events in quadrant D | 4,381,193 | 558,378 |
| Mode SS | |||
|---|---|---|---|
| Quadrant | BADHDUFLAG | Total packets | Discarded packets |
| A | 0 | 134 | 0 |
| B | 0 | 134 | 0 |
| C | 0 | 134 | 0 |
| D | 0 | 134 | 0 |
| Mode M0 | |||
|---|---|---|---|
| Quadrant | BADHDUFLAG | Total packets | Discarded packets |
| A | 0 | 13591 | 2 |
| B | 0 | 14272 | 2 |
| C | 0 | 13762 | 2 |
| D | 0 | 17504 | 2 |
| Mode M9 | |||
|---|---|---|---|
| Quadrant | BADHDUFLAG | Total packets | Discarded packets |
| A | 0 | 20 | 0 |
| B | 0 | 21 | 0 |
| C | 0 | 21 | 0 |
| D | 0 | 21 | 0 |
| Quadrant | Total seconds | Saturated seconds | Saturation percentage |
|---|---|---|---|
| A | 6584 | 33 | 0.501215% |
| B | 6584 | 71 | 1.078372% |
| C | 6584 | 69 | 1.047995% |
| D | 6584 | 436 | 6.622114% |
Noise dominated data is calculated using 1-second bins in cleaned event files. If a bin has >2000 counts, and if more than 50% of those come from <1% of pixels, then it is considered to be noise-dominated and hence unusable.
| Quadrant | # 1 sec bins | Bins with >0 counts | Bins with >2000 counts | High rate bins dominated by noise | Noise dominated (total time) | Noise dominated (detector-on time) | Marked lightcurve |
|---|---|---|---|---|---|---|---|
| A | 7849 | 6585 | 0 | 0 | 0.00% | 0.00% | 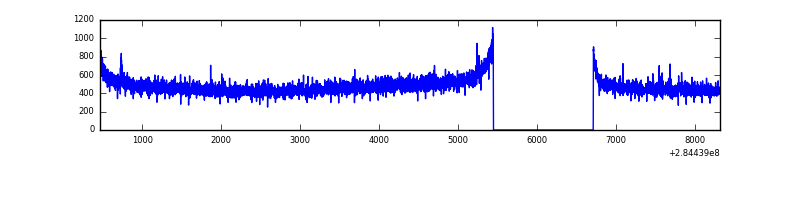 |
| B | 7849 | 6585 | 4 | 4 | 0.05% | 0.06% | 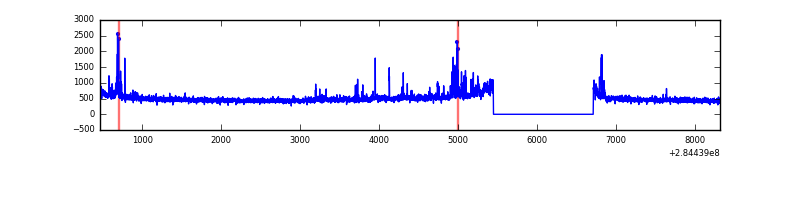 |
| C | 7849 | 6585 | 0 | 0 | 0.00% | 0.00% | 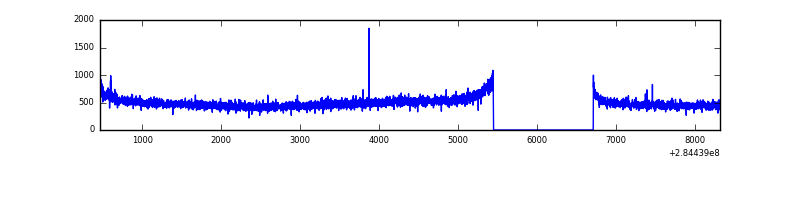 |
| D | 7849 | 6585 | 408 | 408 | 5.20% | 6.20% | 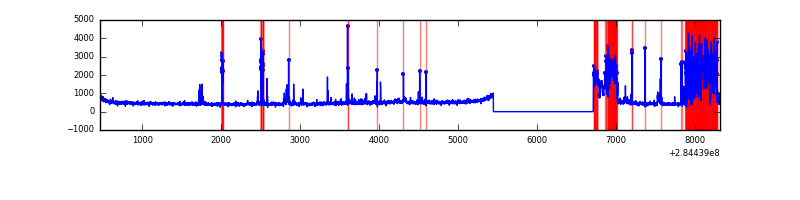 |
Top three noisy pixels from each quadrant. If the there are fewer than three noisy pixels in the level2.evt file, extra rows are filled as -1
| Pixel properties | Quadrant properties | ||||||
|---|---|---|---|---|---|---|---|
| Quadrant | DetID | PixID | Counts | Sigma | Mean | Median | Sigma |
| A | 0 | 226 | 7197 | 39.53 | 812 | 798 | 161.9 |
| A | 12 | 194 | 6213 | 33.45 | 812 | 798 | 161.9 |
| A | 3 | 137 | 5788 | 30.83 | 812 | 798 | 161.9 |
| B | 10 | 245 | 142999 | 925.24 | 814 | 795 | 153.7 |
| B | 0 | 189 | 27784 | 175.6 | 814 | 795 | 153.7 |
| B | 12 | 111 | 17923 | 111.44 | 814 | 795 | 153.7 |
| C | 14 | 238 | 122489 | 680.68 | 775 | 780 | 178.8 |
| C | 5 | 218 | 34627 | 189.3 | 775 | 780 | 178.8 |
| C | 3 | 233 | 30017 | 163.51 | 775 | 780 | 178.8 |
| D | 7 | 238 | 1387406 | 7528.15 | 761 | 740 | 184.2 |
| D | 11 | 241 | 26028 | 137.29 | 761 | 740 | 184.2 |
| D | 13 | 232 | 24953 | 131.45 | 761 | 740 | 184.2 |
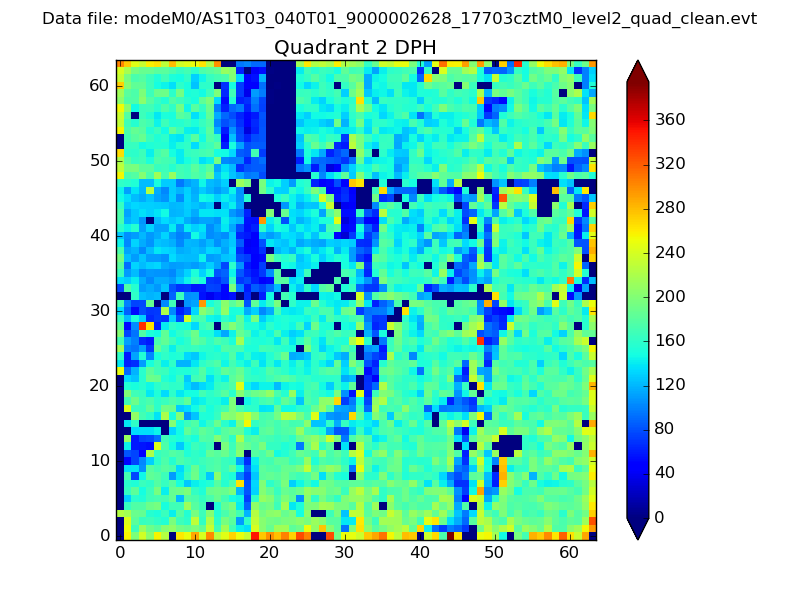
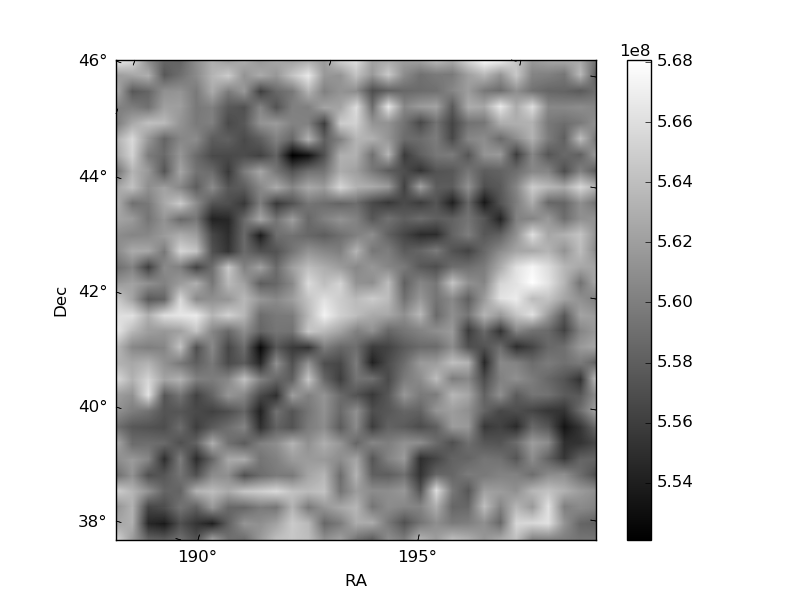
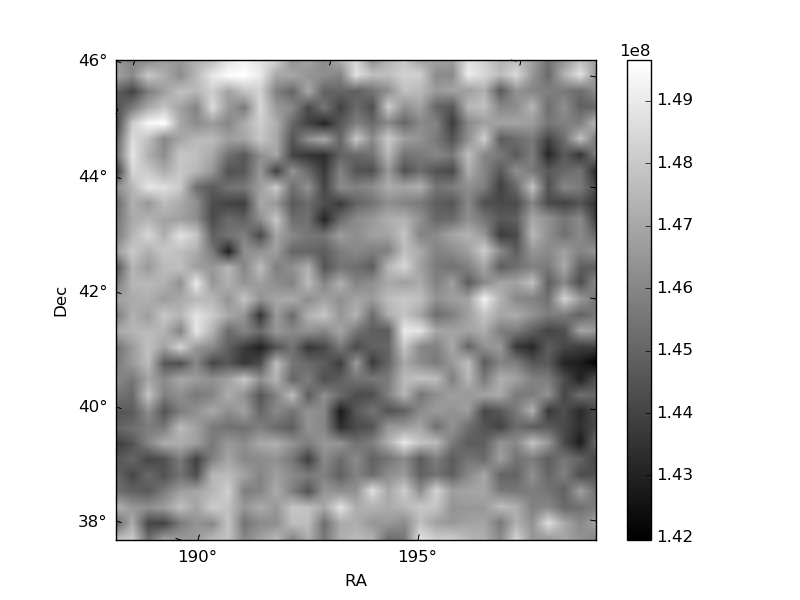
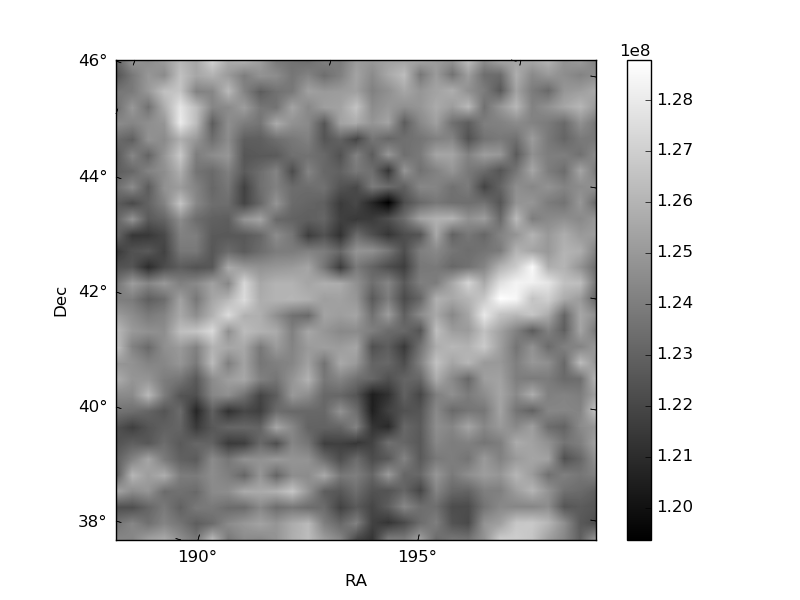
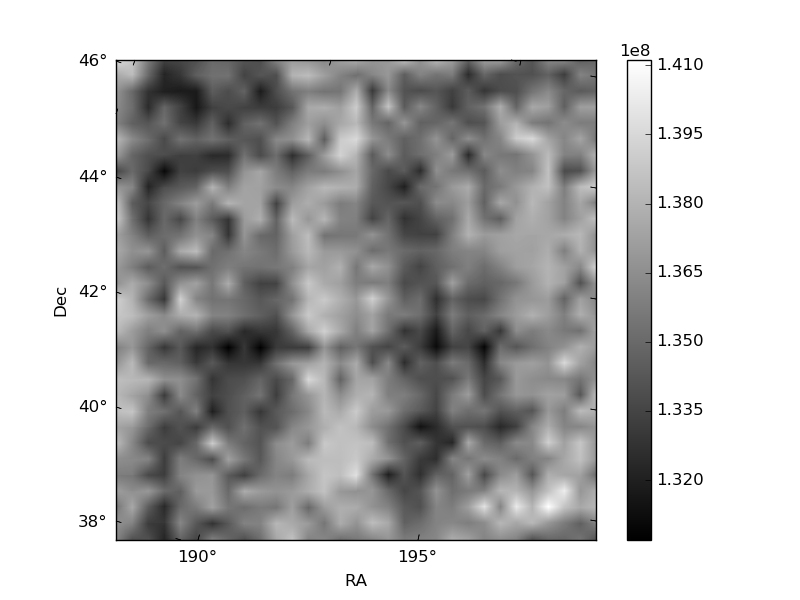
Histogram calculated using DETX and DETY for each event in the final _common_clean file
| Quadrant A | 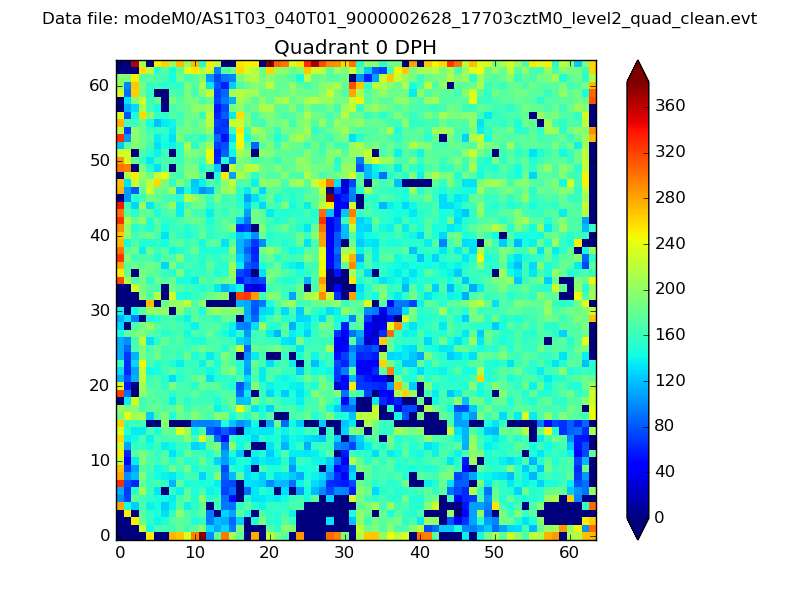 |
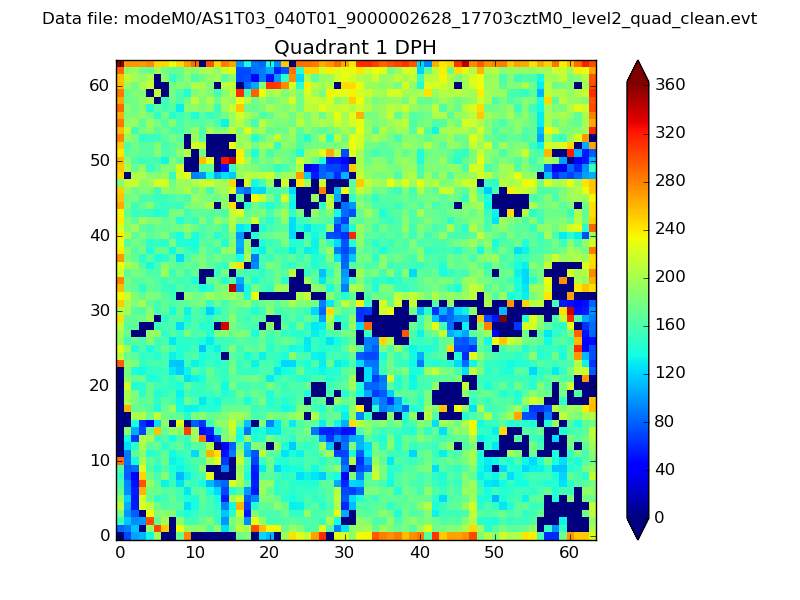 |
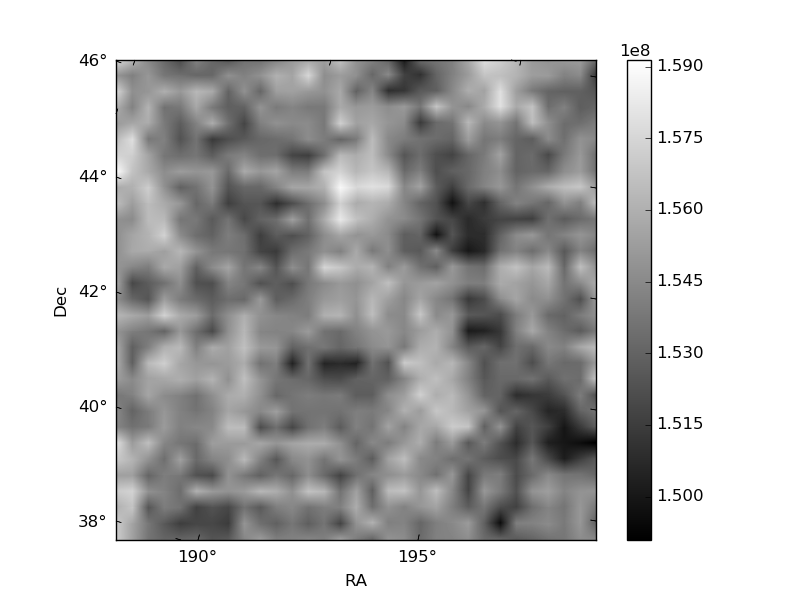
Quadrant B |
|---|---|---|---|
| Quadrant D | 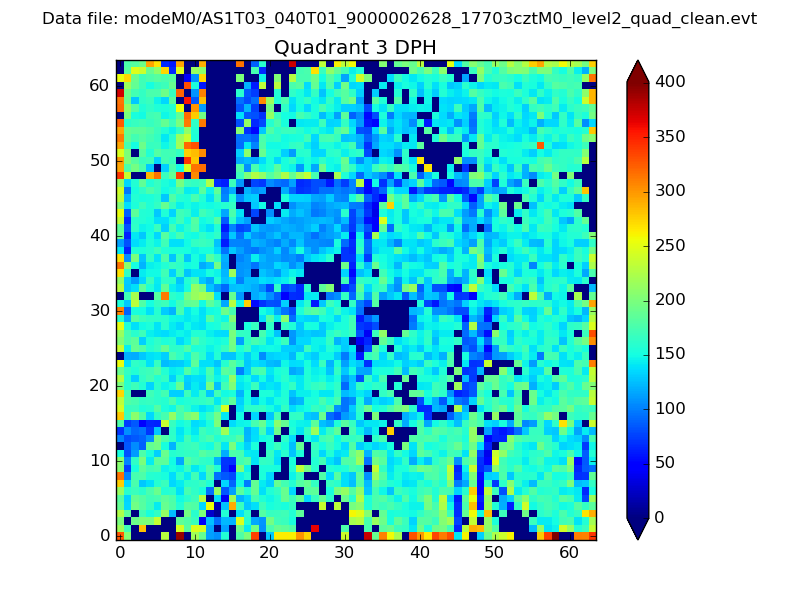 |
 |
Quadrant C |
| Plot type | Count rate plots | Images |
|---|---|---|
| Comparison with Poisson distribution Blue bars denote a histogram of data divided into 1 sec bins. Red curve is a Poisson curve with rate = median count rate of data. |
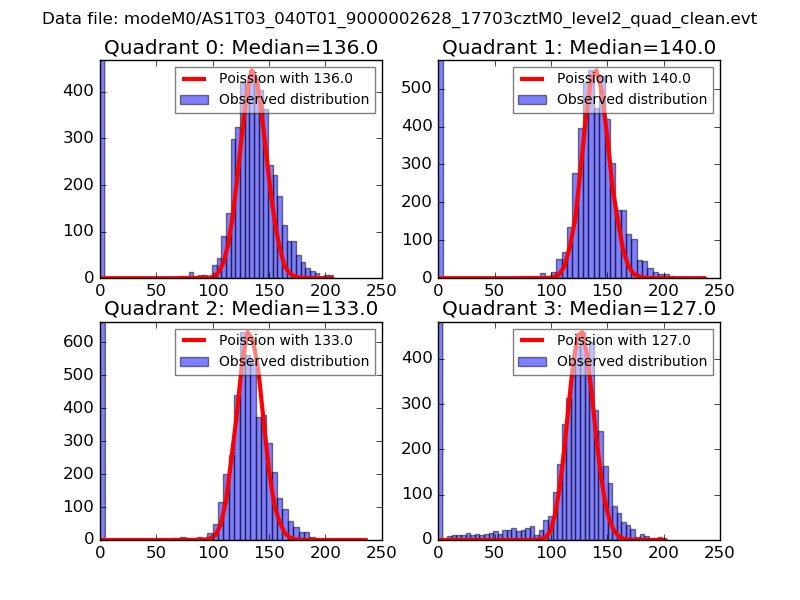 |
 |
| Quadrant-wise count rates Data is divided into 100 sec bins |
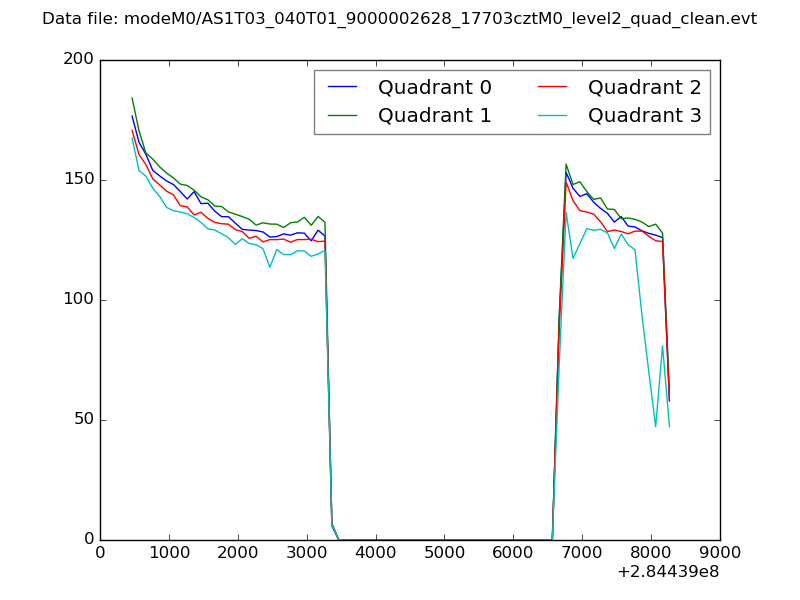 |
|
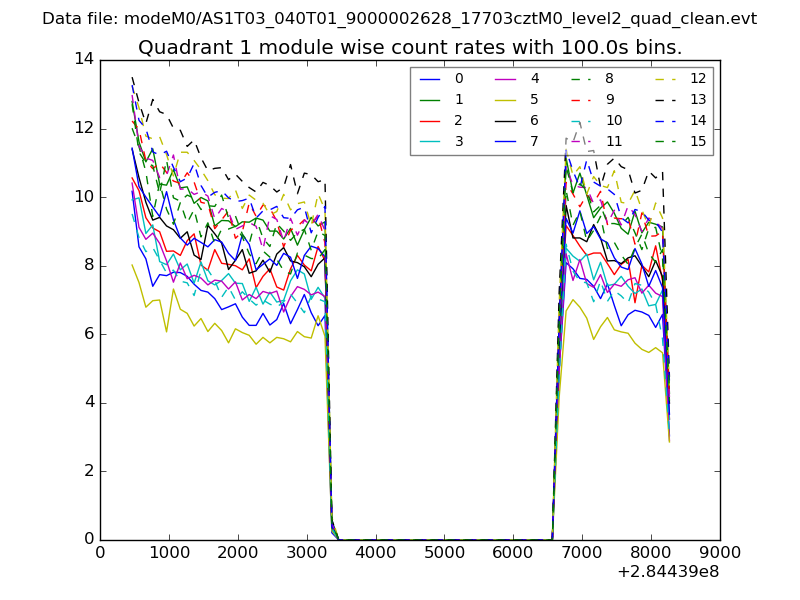
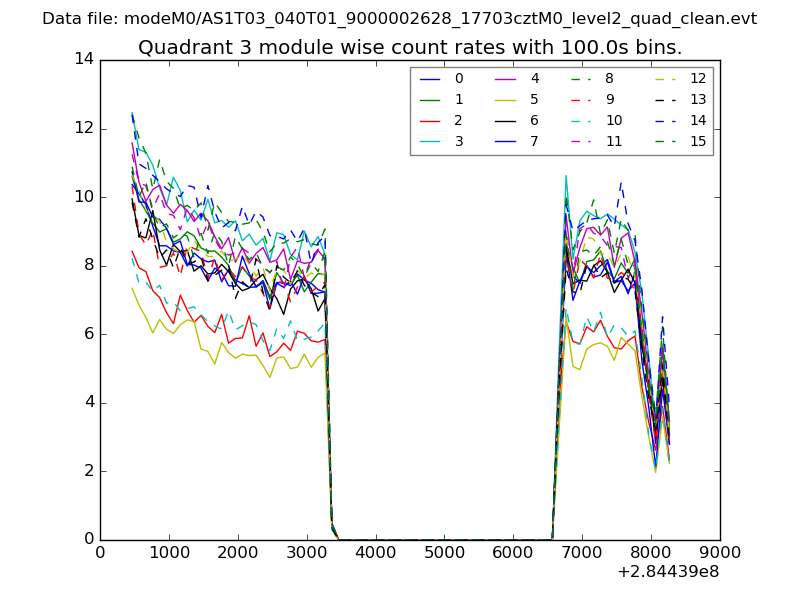
| Module-wise count rates for Quadrant A Data is divided into 100 sec bins |
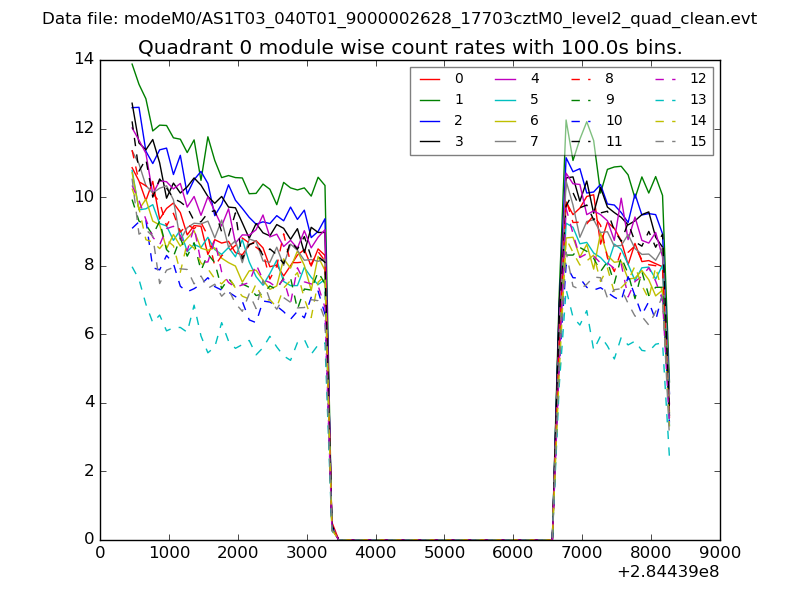 |
 |
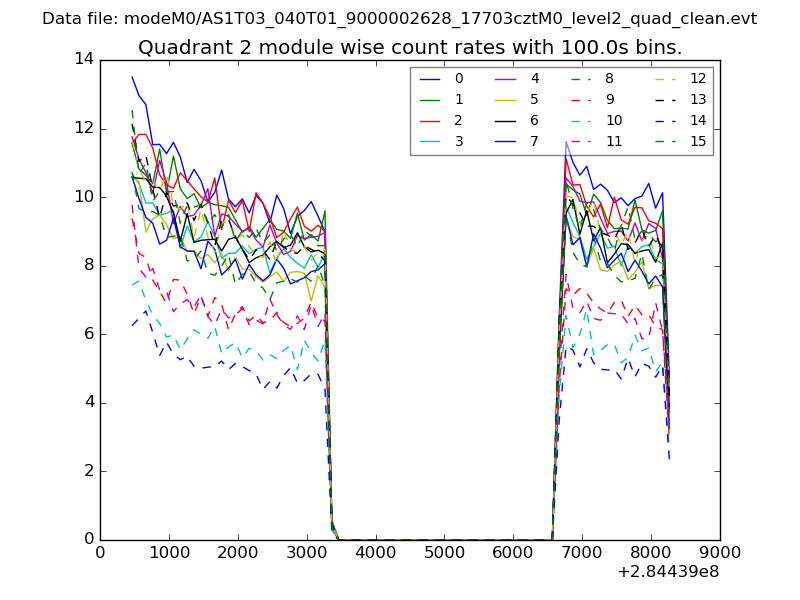
| Module-wise count rates for Quadrant B Data is divided into 100 sec bins |
 |
 |
| Module-wise count rates for Quadrant C Data is divided into 100 sec bins |
 |
 |
| Module-wise count rates for Quadrant D Data is divided into 100 sec bins |
 |
 |
| Parameter | Plot |
|---|---|
| CZT HV Monitor | 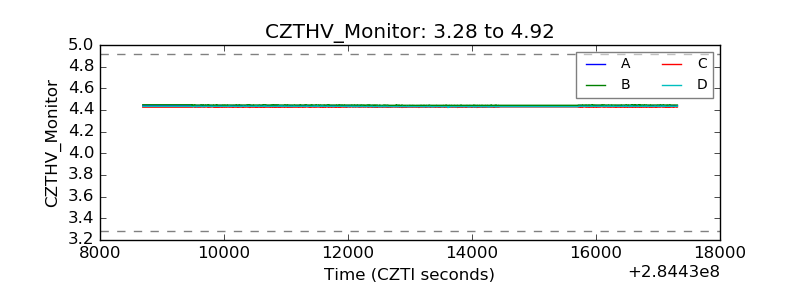 |
| D_VDD | 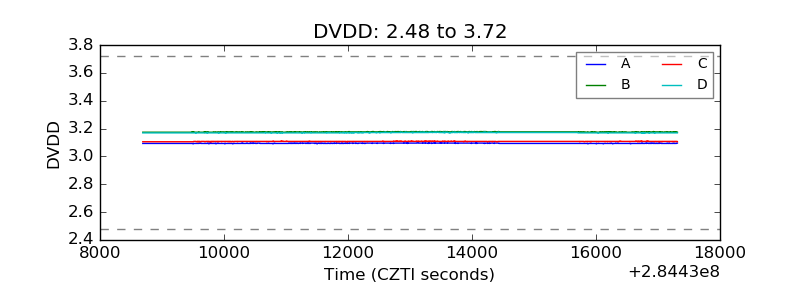 |
| Temperature 1 | 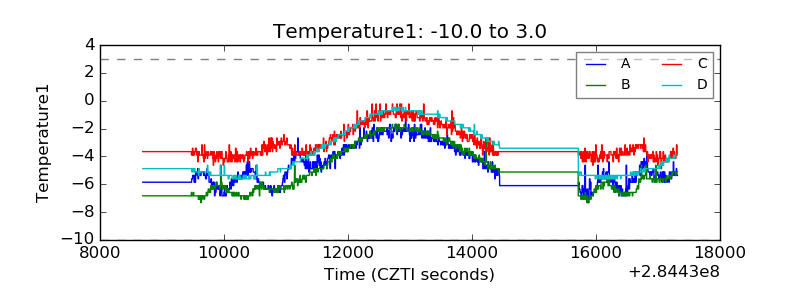 |
| Veto HV Monitor | 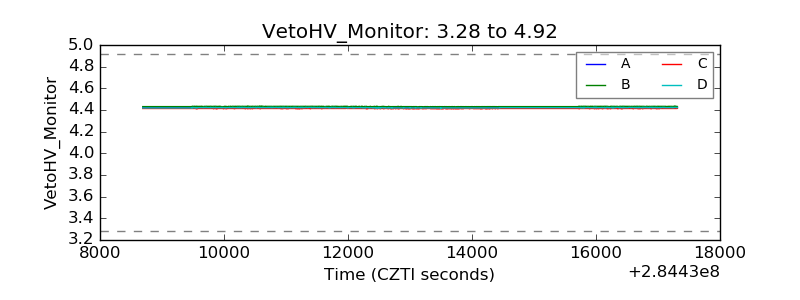 |
| Veto LLD | 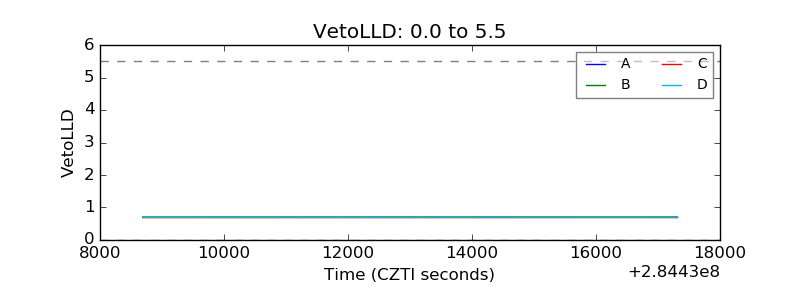 |
| Alpha Counter | 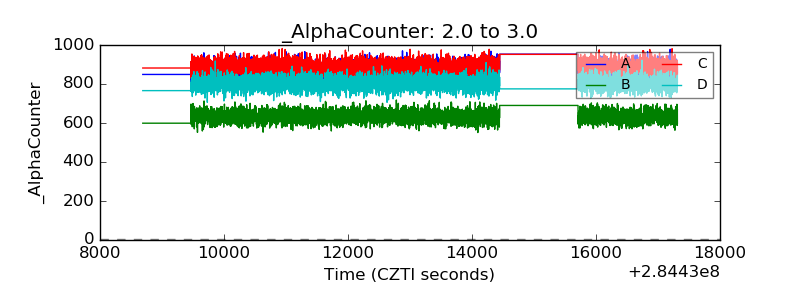 |
| _CPM_Rate | 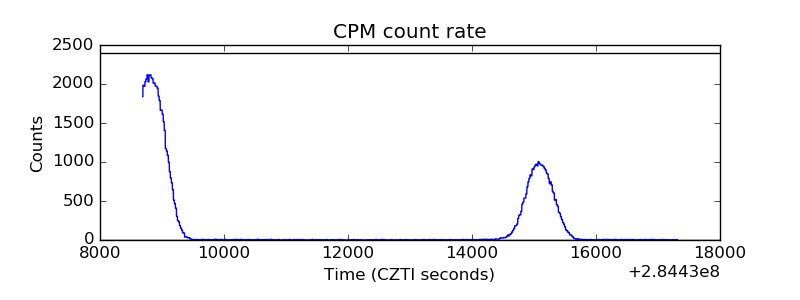 |
| CZT Counter | 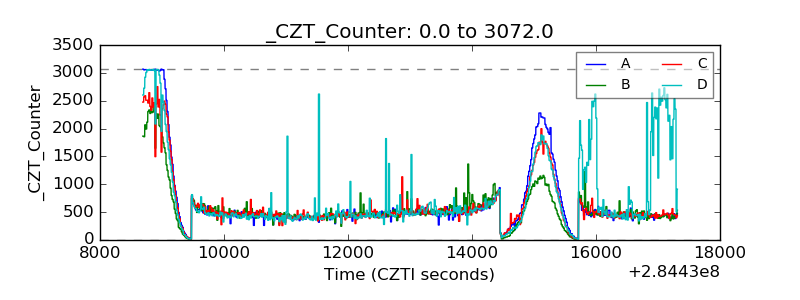 |
| +2.5 Volts monitor | 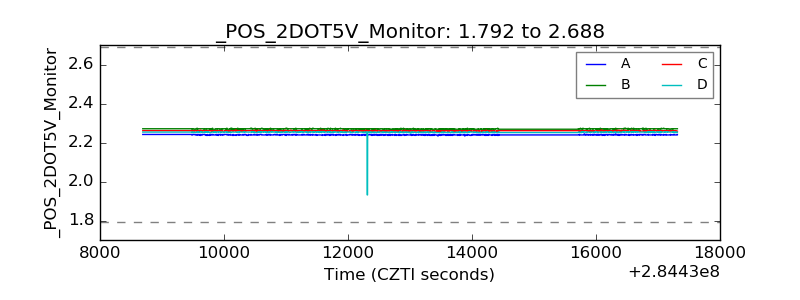 |
| +5 Volts monitor |  |
| _ROLL_ROT | 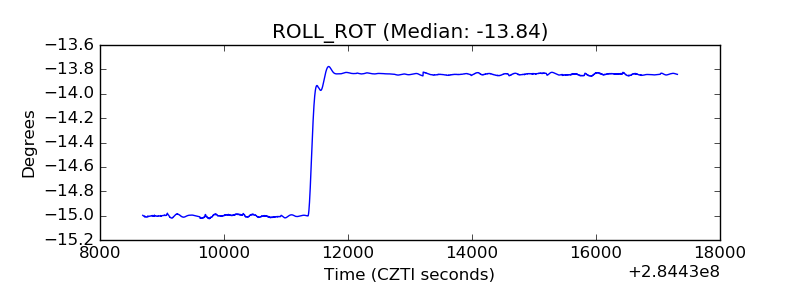 |
| _Roll_DEC | 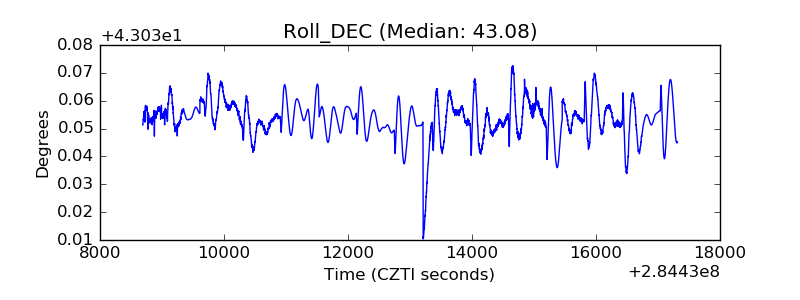 |
| _Roll_RA | 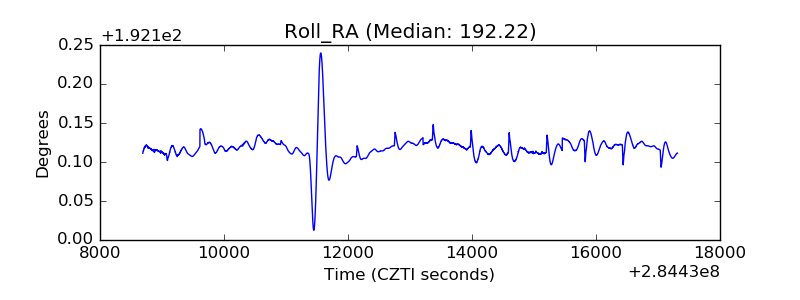 |
| Veto Counter | 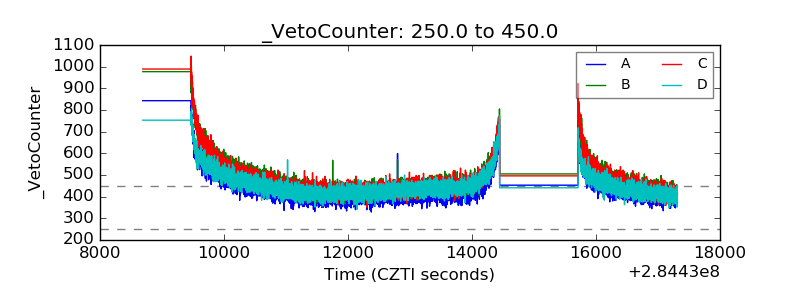 |