| Param | Original file | Final file |
|---|---|---|
| Filename | modeM0/AS1T03_040T01_9000002628_17705cztM0_level2.evt | modeM0/AS1T03_040T01_9000002628_17705cztM0_level2_quad_clean.evt |
| Size (bytes) | 510,791,040 | 82,324,800 |
| Size | 487.1 MB | 78.5 MB |
| Events in quadrant A | 3,025,826 | 527,071 |
| Events in quadrant B | 3,215,824 | 539,259 |
| Events in quadrant C | 3,384,366 | 514,857 |
| Events in quadrant D | 5,413,808 | 469,921 |
| Mode SS | |||
|---|---|---|---|
| Quadrant | BADHDUFLAG | Total packets | Discarded packets |
| A | 0 | 130 | 0 |
| B | 0 | 130 | 0 |
| C | 0 | 130 | 0 |
| D | 0 | 130 | 0 |
| Mode M0 | |||
|---|---|---|---|
| Quadrant | BADHDUFLAG | Total packets | Discarded packets |
| A | 0 | 13273 | 1 |
| B | 0 | 13616 | 1 |
| C | 0 | 13862 | 1 |
| D | 0 | 20319 | 1 |
| Mode M9 | |||
|---|---|---|---|
| Quadrant | BADHDUFLAG | Total packets | Discarded packets |
| A | 0 | 6 | 0 |
| B | 0 | 6 | 0 |
| C | 0 | 6 | 0 |
| D | 0 | 6 | 0 |
| Quadrant | Total seconds | Saturated seconds | Saturation percentage |
|---|---|---|---|
| A | 6321 | 133 | 2.104097% |
| B | 6322 | 148 | 2.341031% |
| C | 6322 | 124 | 1.961405% |
| D | 6322 | 640 | 10.123379% |
Noise dominated data is calculated using 1-second bins in cleaned event files. If a bin has >2000 counts, and if more than 50% of those come from <1% of pixels, then it is considered to be noise-dominated and hence unusable.
| Quadrant | # 1 sec bins | Bins with >0 counts | Bins with >2000 counts | High rate bins dominated by noise | Noise dominated (total time) | Noise dominated (detector-on time) | Marked lightcurve |
|---|---|---|---|---|---|---|---|
| A | 6936 | 6322 | 21 | 21 | 0.30% | 0.33% | 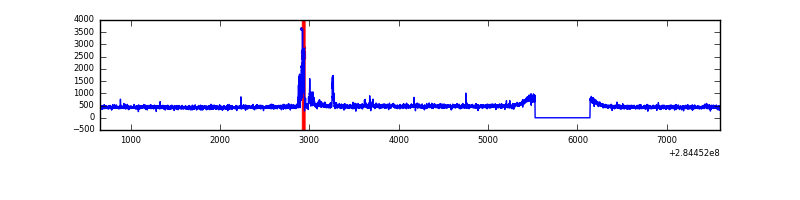 |
| B | 6937 | 6323 | 40 | 40 | 0.58% | 0.63% | 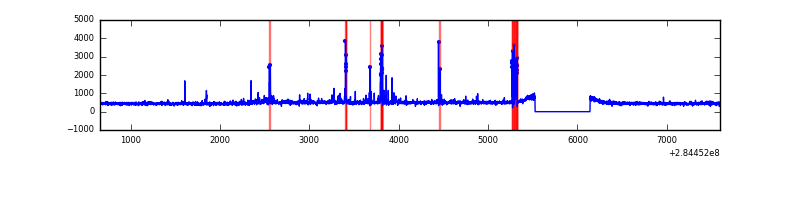 |
| C | 6937 | 6323 | 0 | 0 | 0.00% | 0.00% | 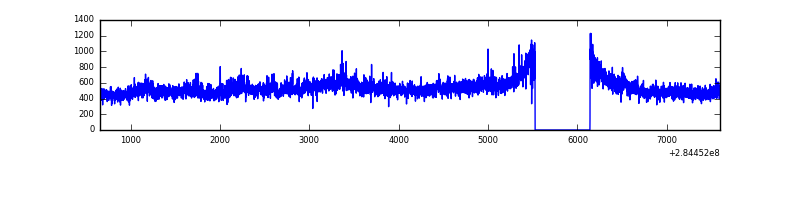 |
| D | 6937 | 6323 | 502 | 502 | 7.24% | 7.94% | 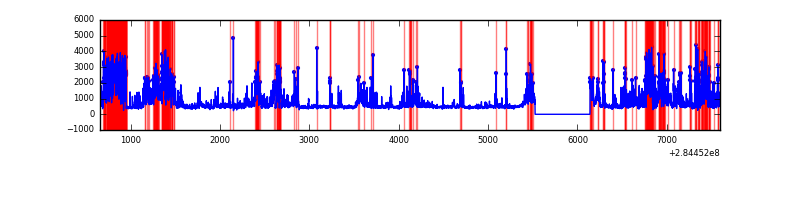 |
Top three noisy pixels from each quadrant. If the there are fewer than three noisy pixels in the level2.evt file, extra rows are filled as -1
| Pixel properties | Quadrant properties | ||||||
|---|---|---|---|---|---|---|---|
| Quadrant | DetID | PixID | Counts | Sigma | Mean | Median | Sigma |
| A | 15 | 174 | 141553 | 920.03 | 750 | 732 | 153.1 |
| A | 0 | 226 | 6675 | 38.83 | 750 | 732 | 153.1 |
| A | 3 | 137 | 5582 | 31.69 | 750 | 732 | 153.1 |
| B | 7 | 220 | 75398 | 517.39 | 747 | 727 | 144.3 |
| B | 0 | 189 | 74664 | 512.3 | 747 | 727 | 144.3 |
| B | 10 | 245 | 64387 | 441.09 | 747 | 727 | 144.3 |
| C | 3 | 233 | 435160 | 2600.63 | 714 | 718 | 167.1 |
| C | 14 | 238 | 109637 | 652.0 | 714 | 718 | 167.1 |
| C | 5 | 218 | 40075 | 235.6 | 714 | 718 | 167.1 |
| D | 7 | 238 | 2642751 | 15546.55 | 700 | 678 | 169.9 |
| D | 13 | 232 | 35612 | 205.56 | 700 | 678 | 169.9 |
| D | 2 | 234 | 22993 | 131.31 | 700 | 678 | 169.9 |
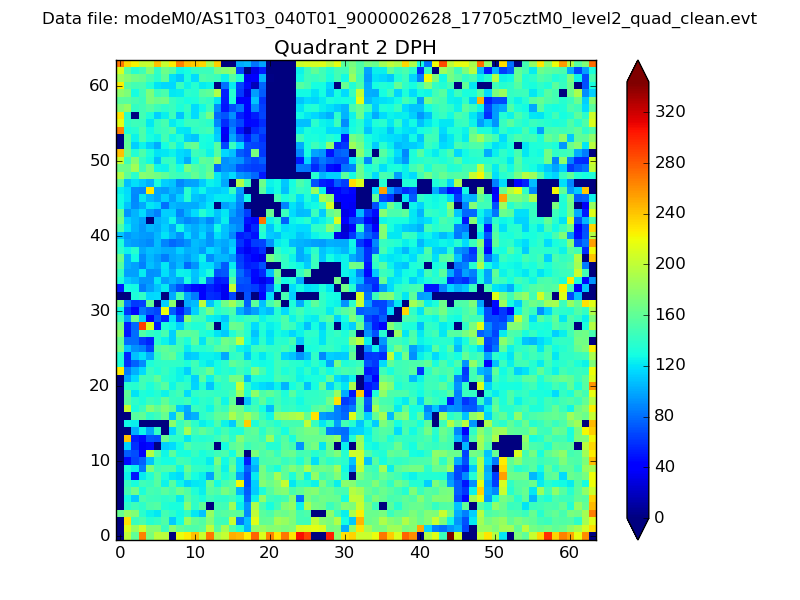
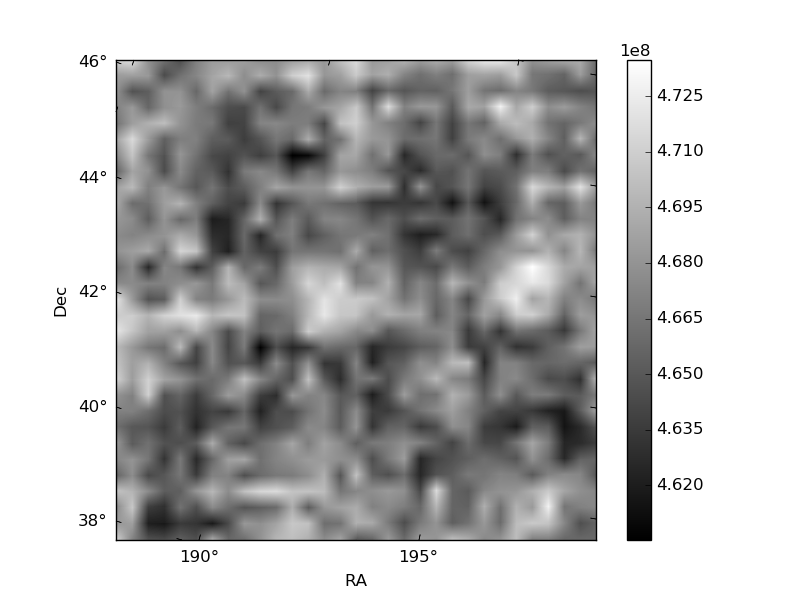
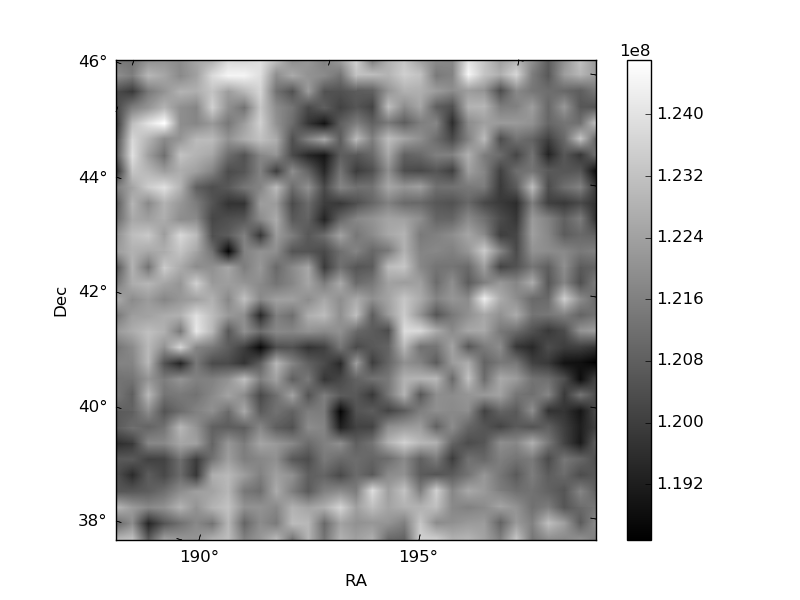
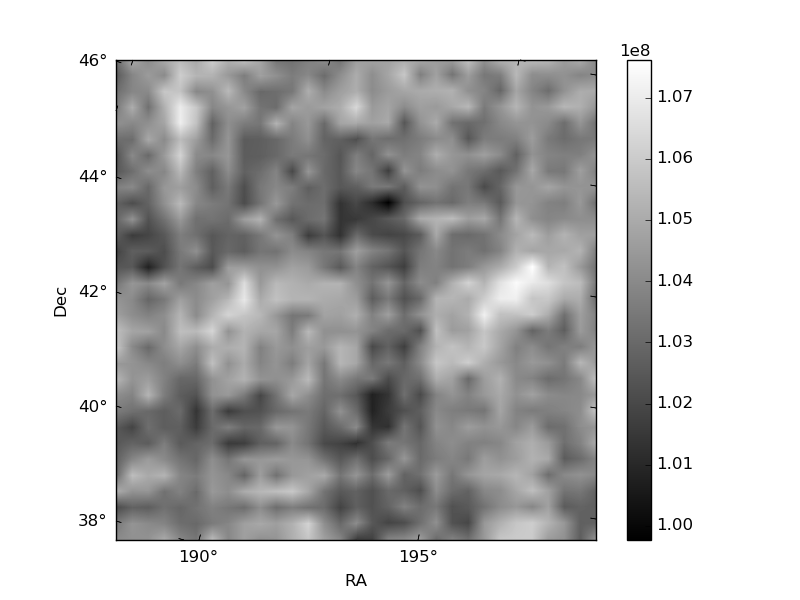
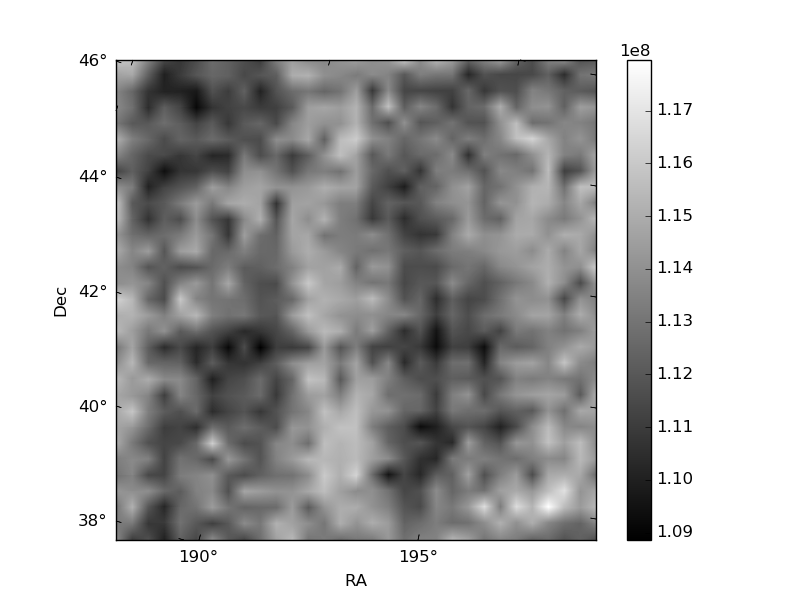
Histogram calculated using DETX and DETY for each event in the final _common_clean file
| Quadrant A | 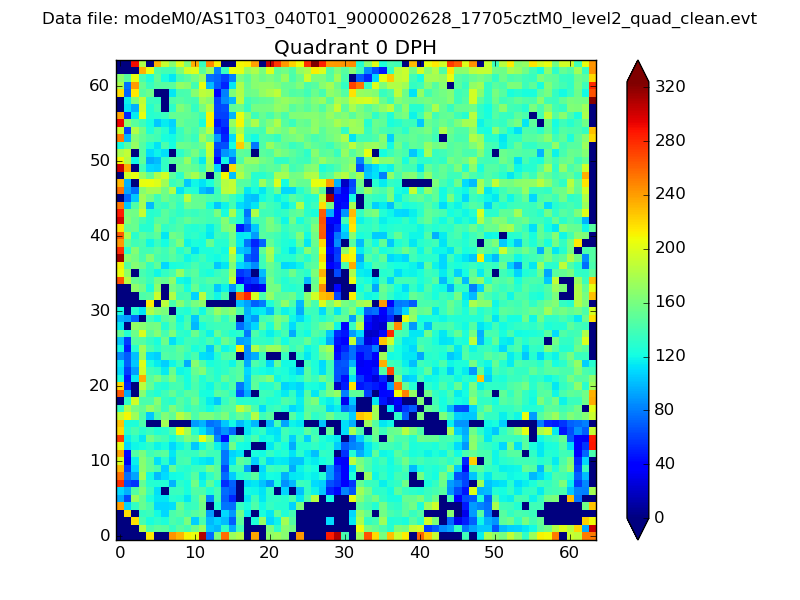 |
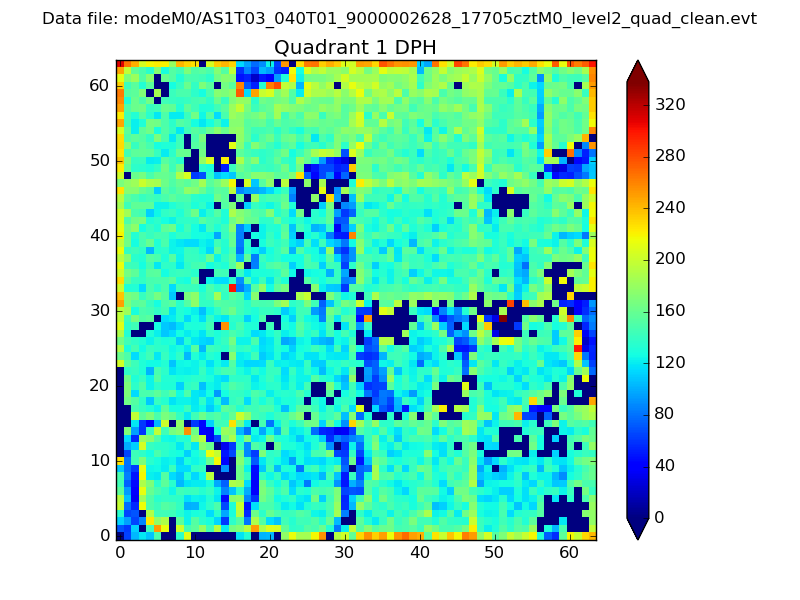 |
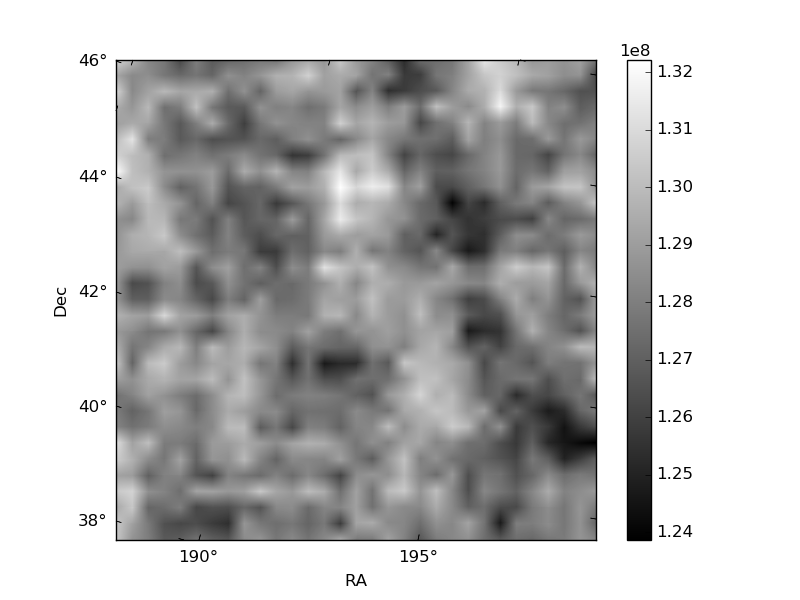
Quadrant B |
|---|---|---|---|
| Quadrant D | 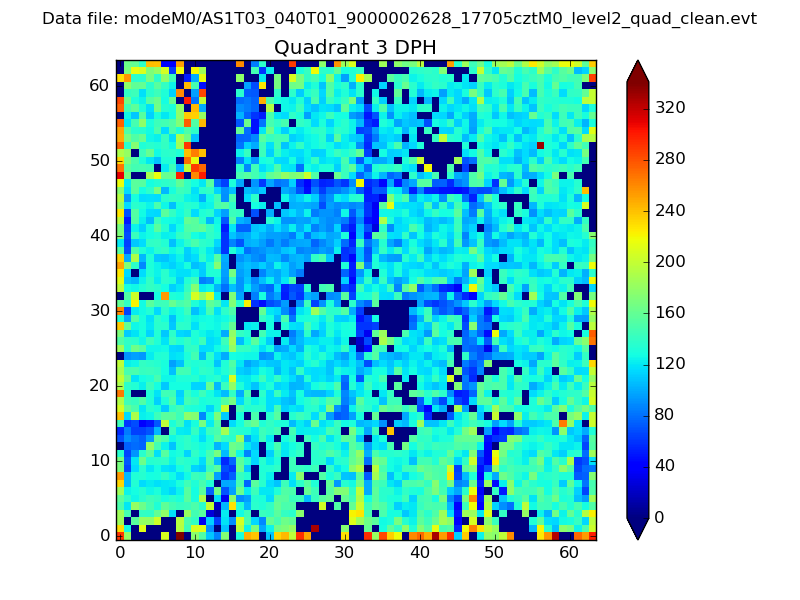 |
 |
Quadrant C |
| Plot type | Count rate plots | Images |
|---|---|---|
| Comparison with Poisson distribution Blue bars denote a histogram of data divided into 1 sec bins. Red curve is a Poisson curve with rate = median count rate of data. |
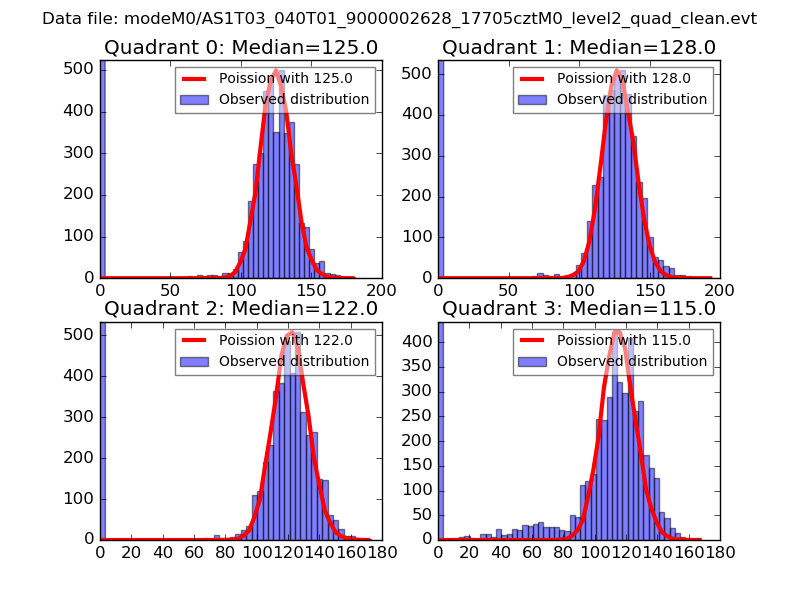 |
 |
| Quadrant-wise count rates Data is divided into 100 sec bins |
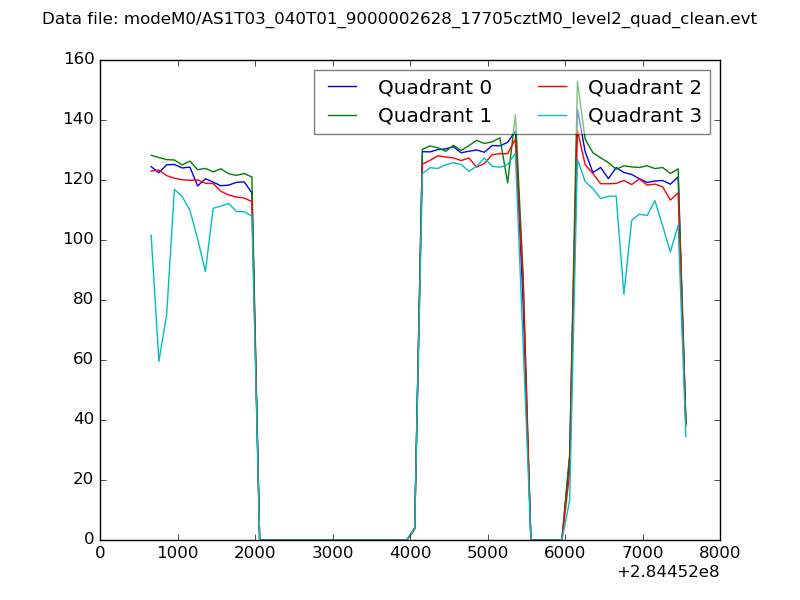 |
|
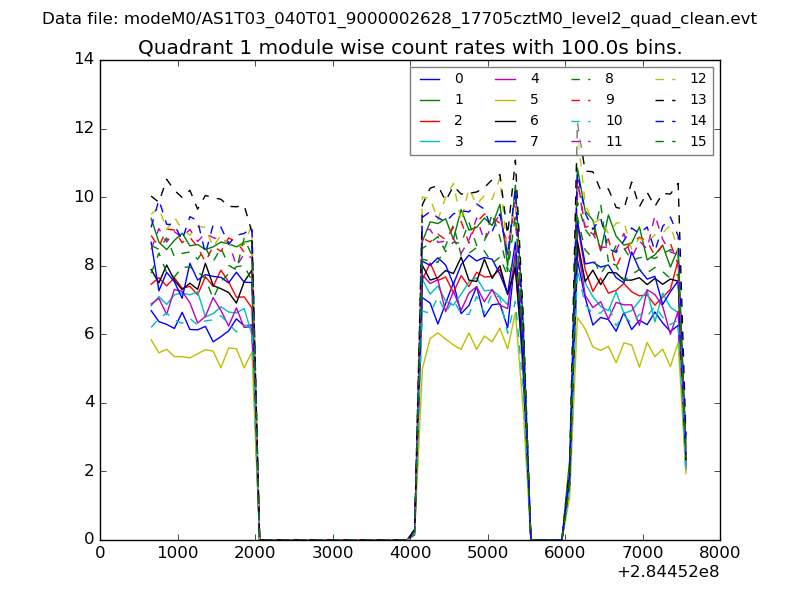
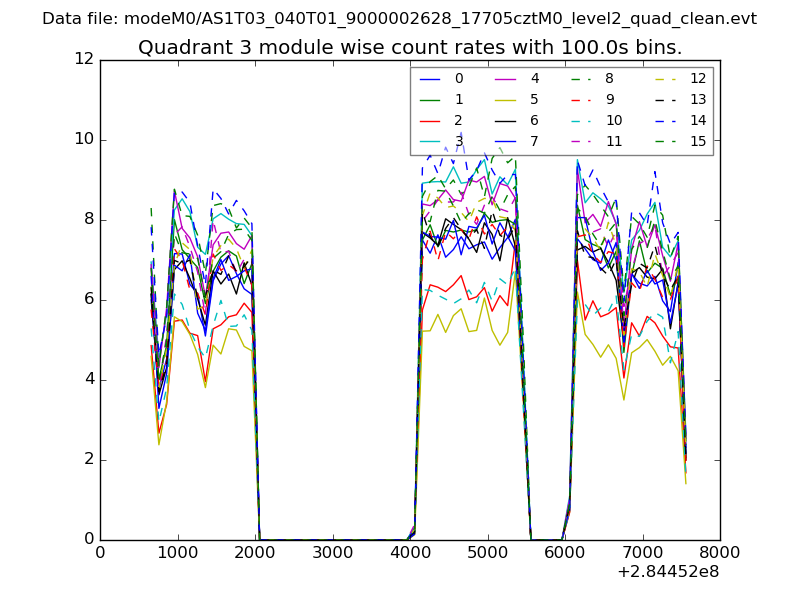
| Module-wise count rates for Quadrant A Data is divided into 100 sec bins |
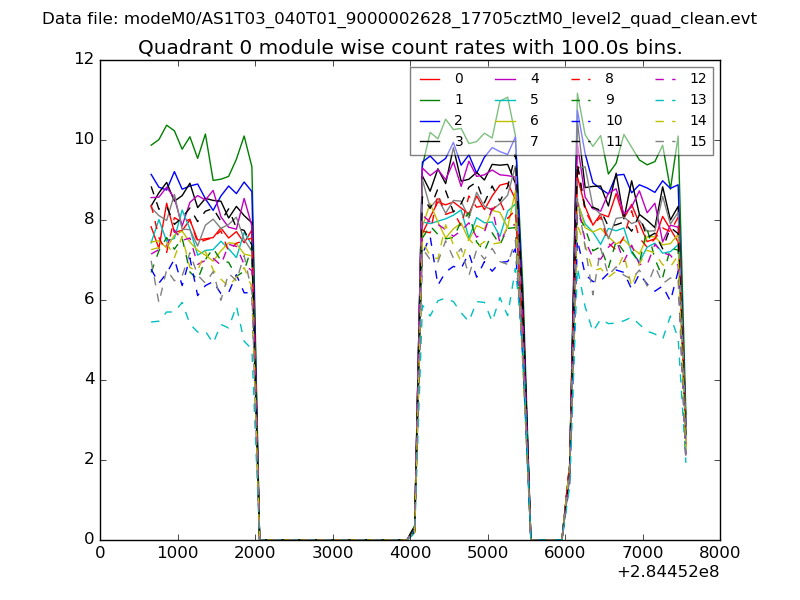 |
 |
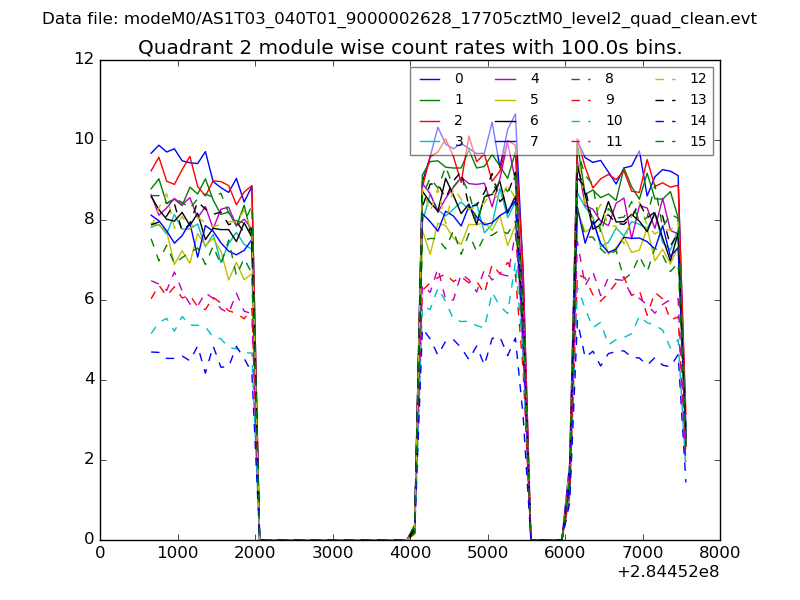
| Module-wise count rates for Quadrant B Data is divided into 100 sec bins |
 |
 |
| Module-wise count rates for Quadrant C Data is divided into 100 sec bins |
 |
 |
| Module-wise count rates for Quadrant D Data is divided into 100 sec bins |
 |
 |
| Parameter | Plot |
|---|---|
| CZT HV Monitor |  |
| D_VDD | 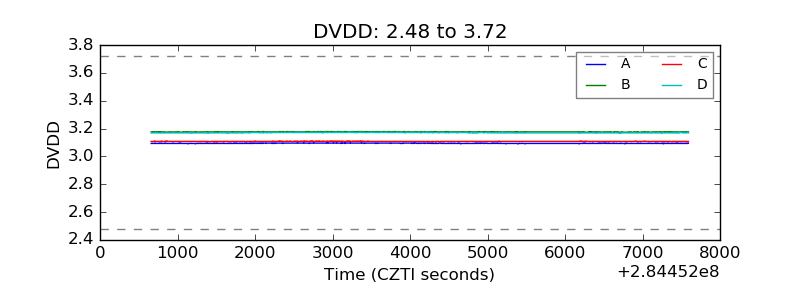 |
| Temperature 1 | 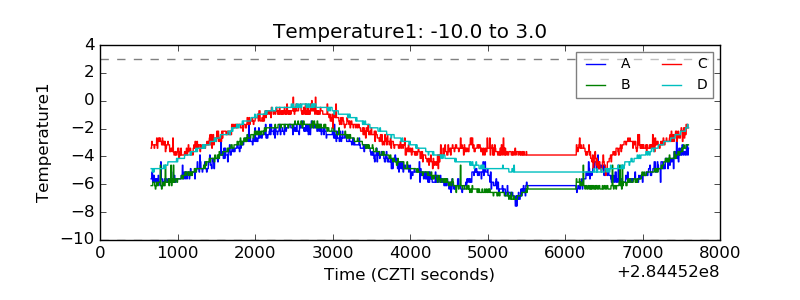 |
| Veto HV Monitor | 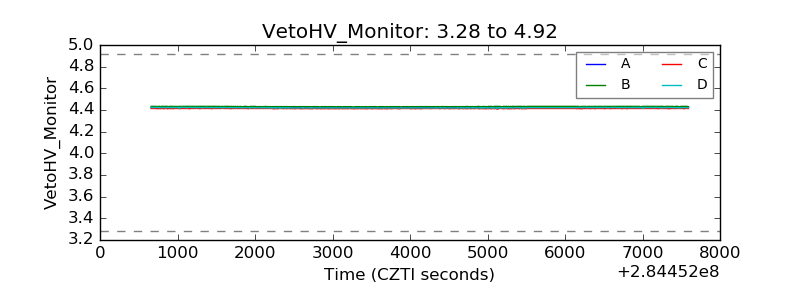 |
| Veto LLD | 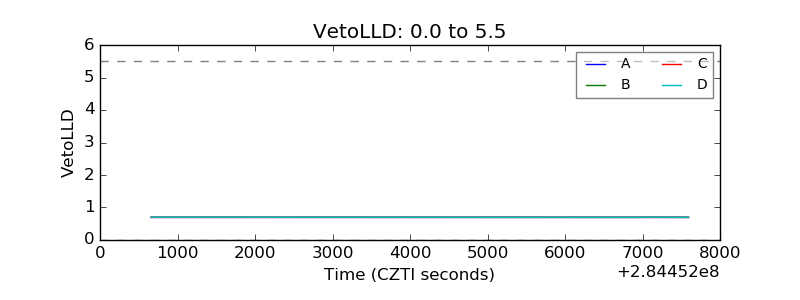 |
| Alpha Counter | 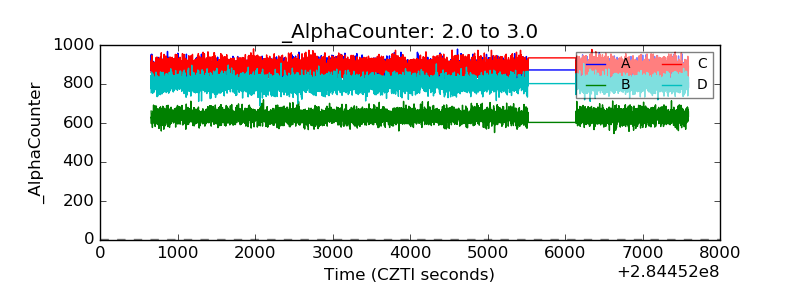 |
| _CPM_Rate | 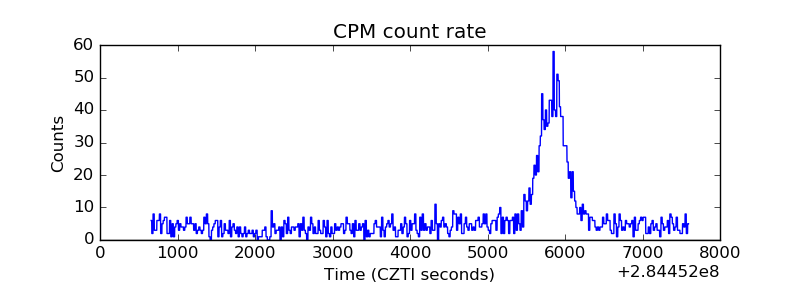 |
| CZT Counter | 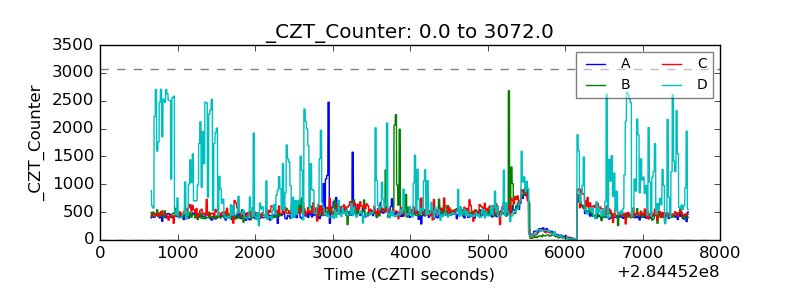 |
| +2.5 Volts monitor |  |
| +5 Volts monitor |  |
| _ROLL_ROT | 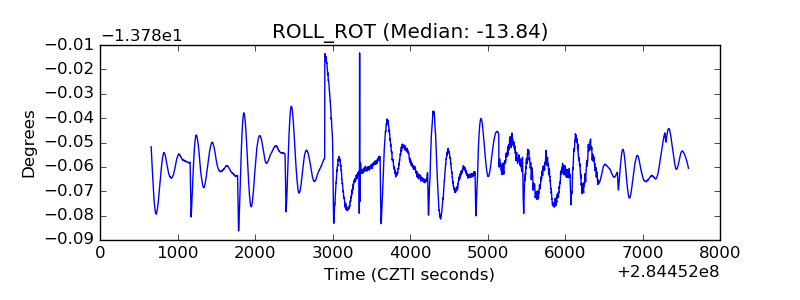 |
| _Roll_DEC | 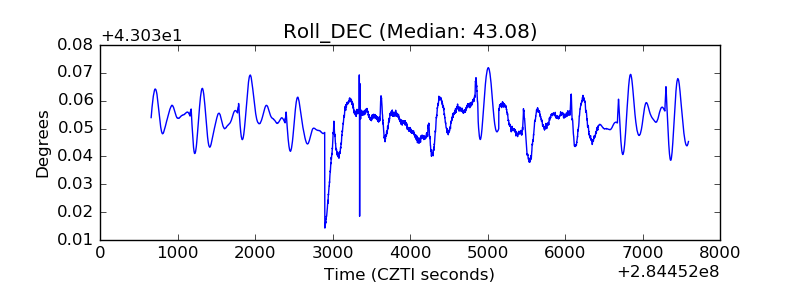 |
| _Roll_RA | 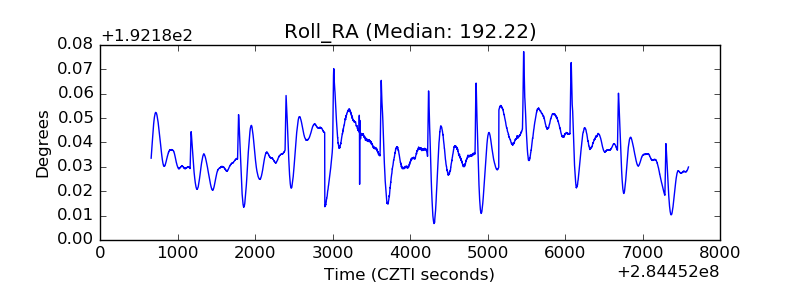 |
| Veto Counter | 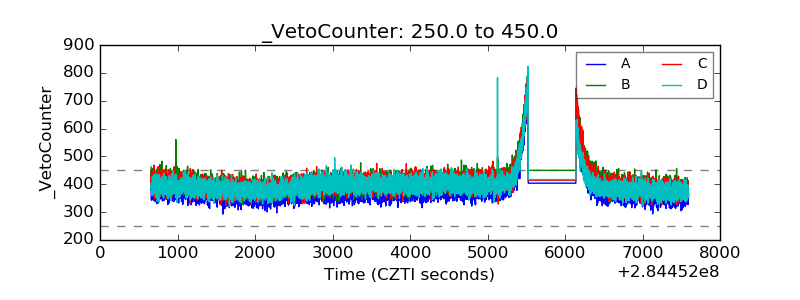 |