| Param | Original file | Final file |
|---|---|---|
| Filename | modeM0/AS1T03_040T01_9000002628_17706cztM0_level2.evt | modeM0/AS1T03_040T01_9000002628_17706cztM0_level2_quad_clean.evt |
| Size (bytes) | 603,714,240 | 95,287,680 |
| Size | 575.7 MB | 90.9 MB |
| Events in quadrant A | 3,247,236 | 615,442 |
| Events in quadrant B | 3,515,787 | 628,885 |
| Events in quadrant C | 3,577,566 | 599,703 |
| Events in quadrant D | 7,457,147 | 542,340 |
| Mode SS | |||
|---|---|---|---|
| Quadrant | BADHDUFLAG | Total packets | Discarded packets |
| A | 0 | 148 | 0 |
| B | 0 | 148 | 0 |
| C | 0 | 148 | 0 |
| D | 0 | 148 | 0 |
| Mode M0 | |||
|---|---|---|---|
| Quadrant | BADHDUFLAG | Total packets | Discarded packets |
| A | 0 | 14615 | 2 |
| B | 0 | 15127 | 2 |
| C | 0 | 14861 | 2 |
| D | 0 | 27090 | 2 |
| Mode M9 | |||
|---|---|---|---|
| Quadrant | BADHDUFLAG | Total packets | Discarded packets |
| A | 0 | 1 | 0 |
| B | 0 | 1 | 0 |
| C | 0 | 1 | 0 |
| D | 0 | 1 | 0 |
| Quadrant | Total seconds | Saturated seconds | Saturation percentage |
|---|---|---|---|
| A | 7151 | 153 | 2.139561% |
| B | 7152 | 175 | 2.446868% |
| C | 7152 | 176 | 2.460850% |
| D | 7152 | 1287 | 17.994966% |
Noise dominated data is calculated using 1-second bins in cleaned event files. If a bin has >2000 counts, and if more than 50% of those come from <1% of pixels, then it is considered to be noise-dominated and hence unusable.
| Quadrant | # 1 sec bins | Bins with >0 counts | Bins with >2000 counts | High rate bins dominated by noise | Noise dominated (total time) | Noise dominated (detector-on time) | Marked lightcurve |
|---|---|---|---|---|---|---|---|
| A | 7351 | 7153 | 0 | 0 | 0.00% | 0.00% | 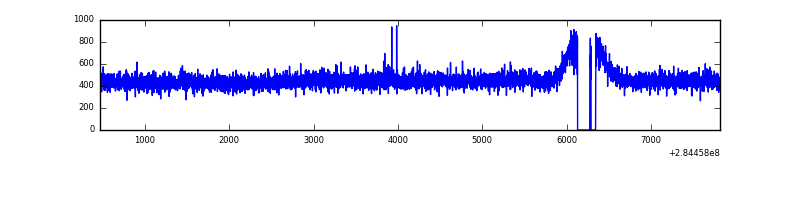 |
| B | 7352 | 7154 | 11 | 11 | 0.15% | 0.15% | 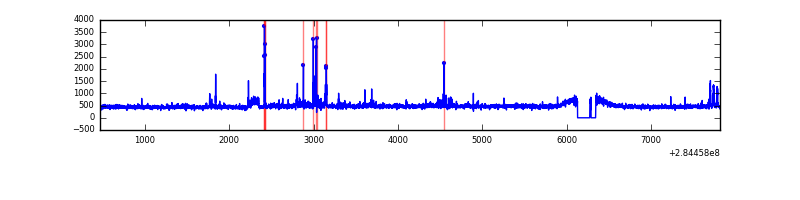 |
| C | 7352 | 7154 | 0 | 0 | 0.00% | 0.00% | 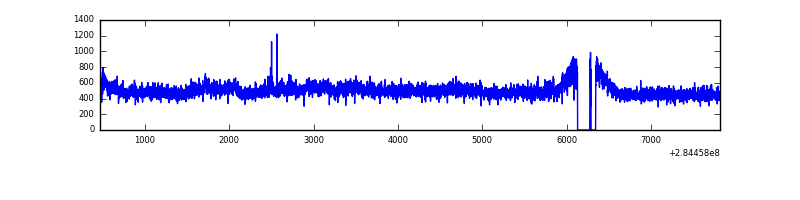 |
| D | 7352 | 7153 | 969 | 969 | 13.18% | 13.55% | 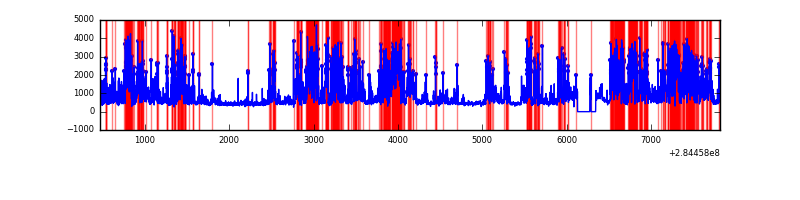 |
Top three noisy pixels from each quadrant. If the there are fewer than three noisy pixels in the level2.evt file, extra rows are filled as -1
| Pixel properties | Quadrant properties | ||||||
|---|---|---|---|---|---|---|---|
| Quadrant | DetID | PixID | Counts | Sigma | Mean | Median | Sigma |
| A | 0 | 226 | 7419 | 38.26 | 844 | 824 | 172.4 |
| A | 12 | 194 | 6320 | 31.89 | 844 | 824 | 172.4 |
| A | 3 | 137 | 6284 | 31.68 | 844 | 824 | 172.4 |
| B | 0 | 189 | 62617 | 380.02 | 843 | 818 | 162.6 |
| B | 0 | 197 | 47016 | 284.08 | 843 | 818 | 162.6 |
| B | 0 | 230 | 34511 | 207.19 | 843 | 818 | 162.6 |
| C | 3 | 233 | 245334 | 1299.19 | 803 | 805 | 188.2 |
| C | 14 | 238 | 125064 | 660.19 | 803 | 805 | 188.2 |
| C | 5 | 218 | 50690 | 265.04 | 803 | 805 | 188.2 |
| D | 7 | 238 | 4478649 | 23889.18 | 766 | 742 | 187.4 |
| D | 2 | 234 | 25646 | 132.86 | 766 | 742 | 187.4 |
| D | 10 | 70 | 24745 | 128.05 | 766 | 742 | 187.4 |
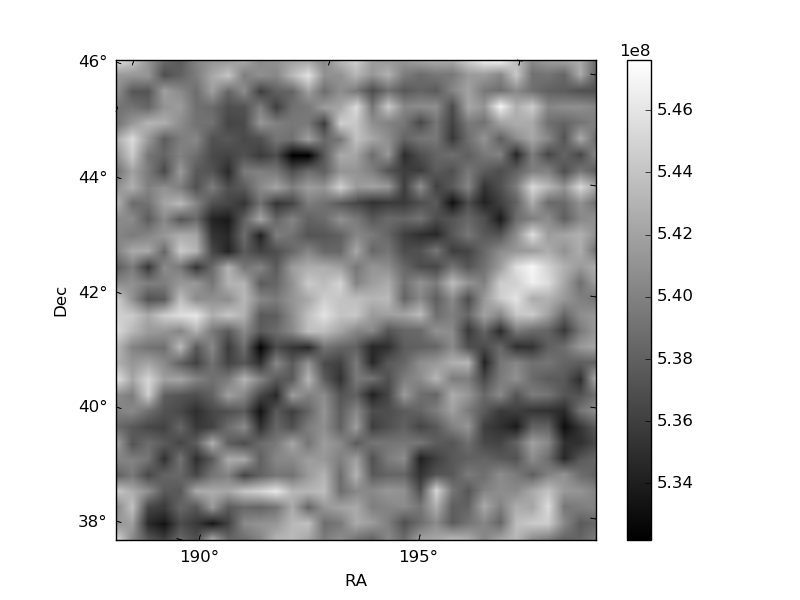
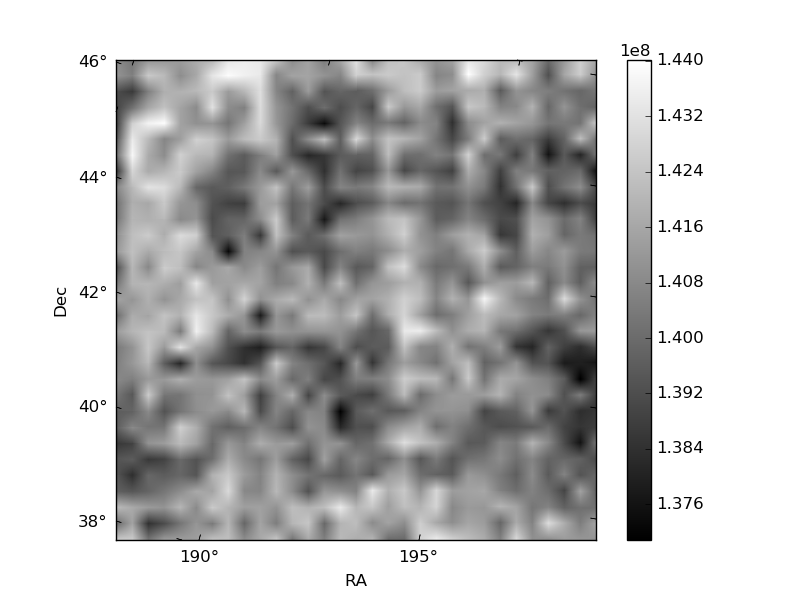
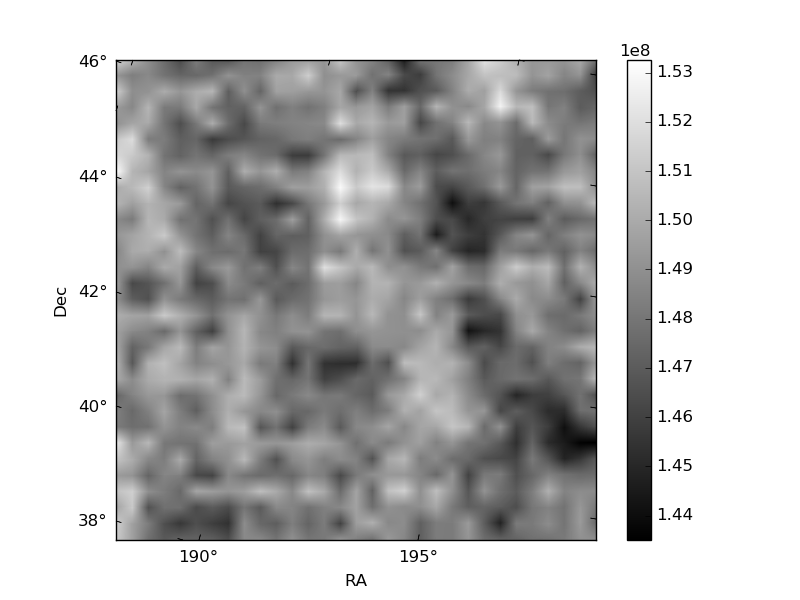
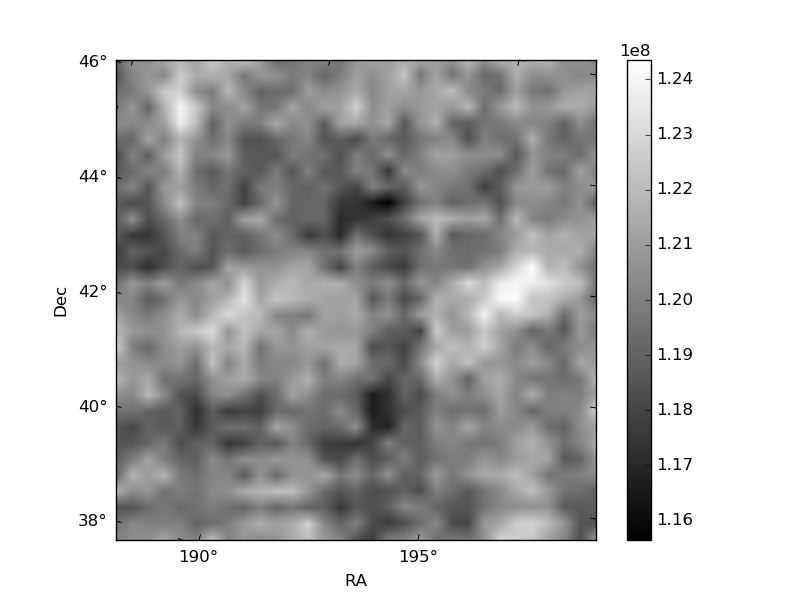
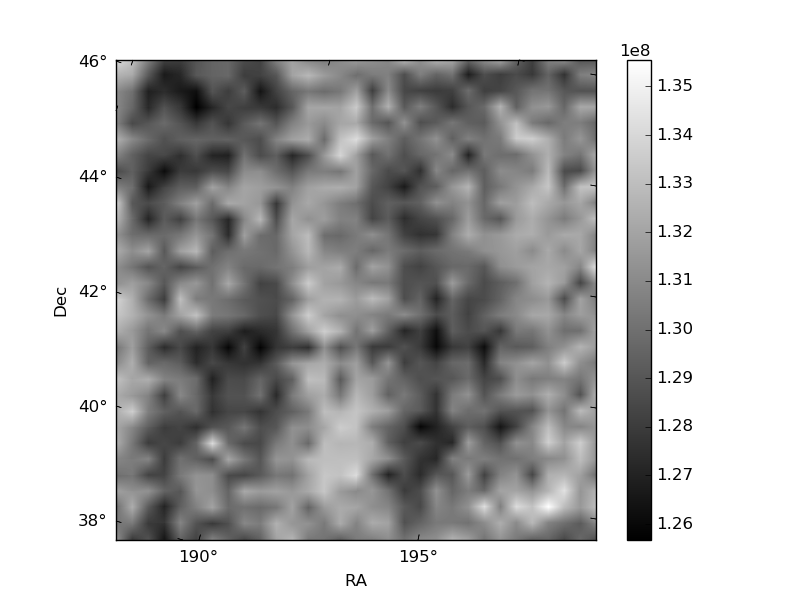
Histogram calculated using DETX and DETY for each event in the final _common_clean file
| Quadrant A | 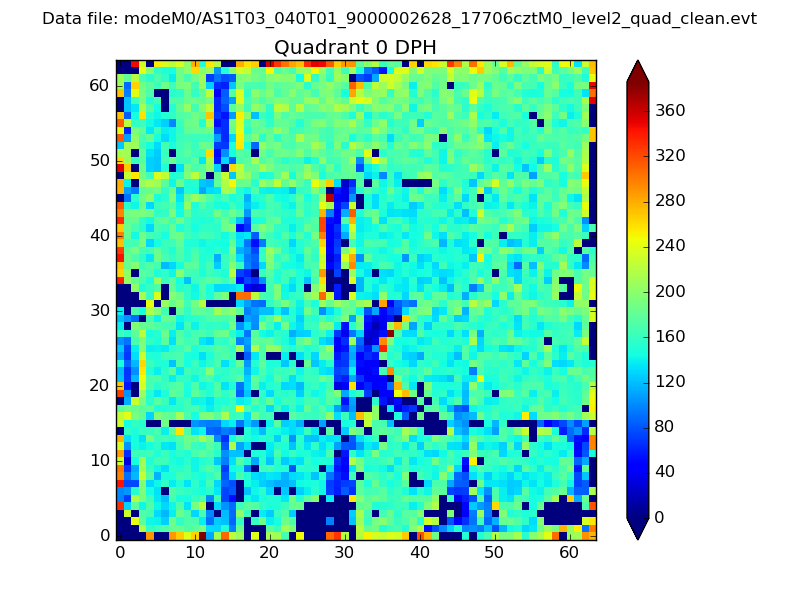 |
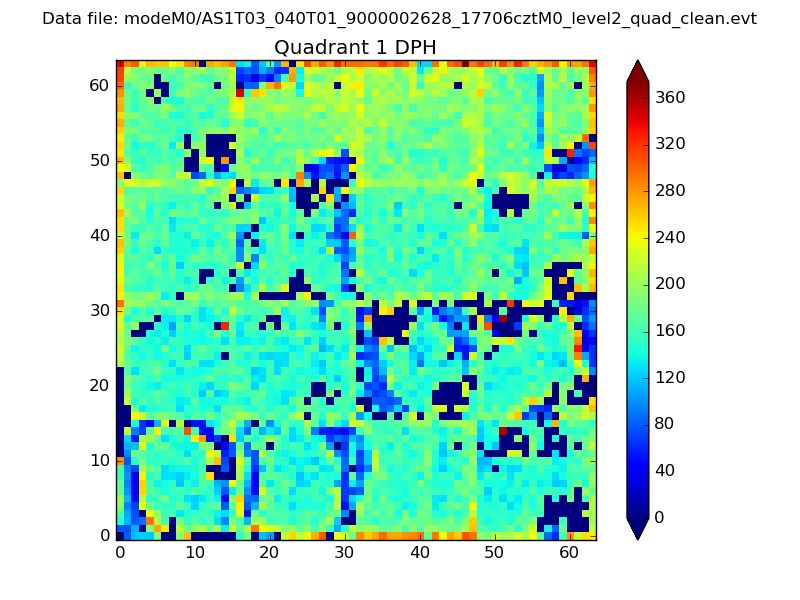 |
Quadrant B |
|---|---|---|---|
| Quadrant D | 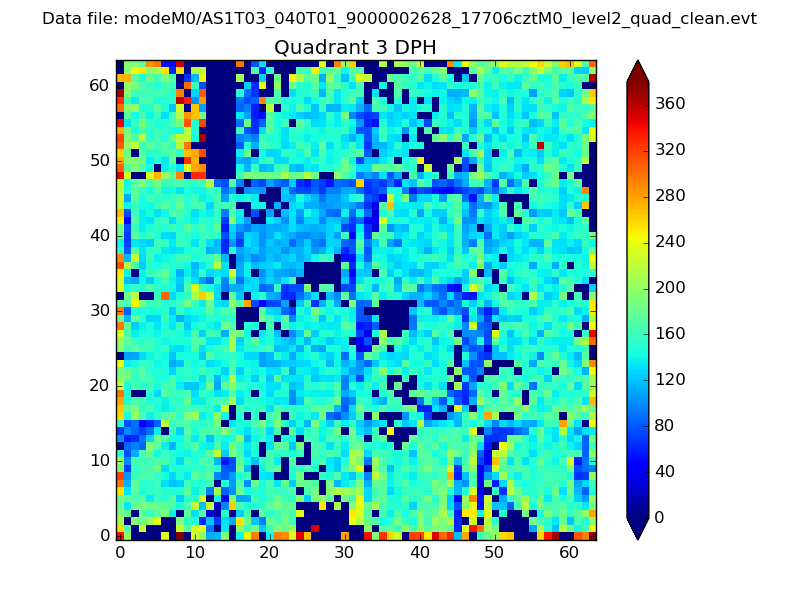 |
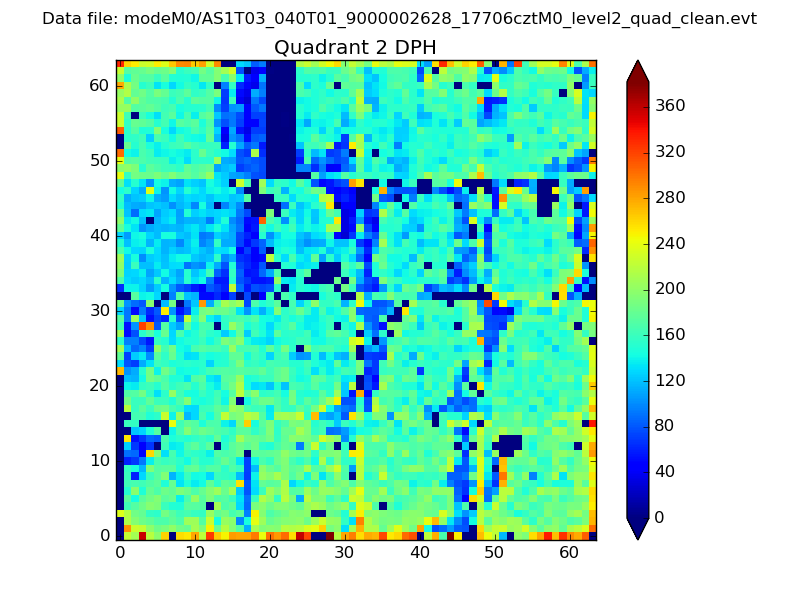 |
Quadrant C |
| Plot type | Count rate plots | Images |
|---|---|---|
| Comparison with Poisson distribution Blue bars denote a histogram of data divided into 1 sec bins. Red curve is a Poisson curve with rate = median count rate of data. |
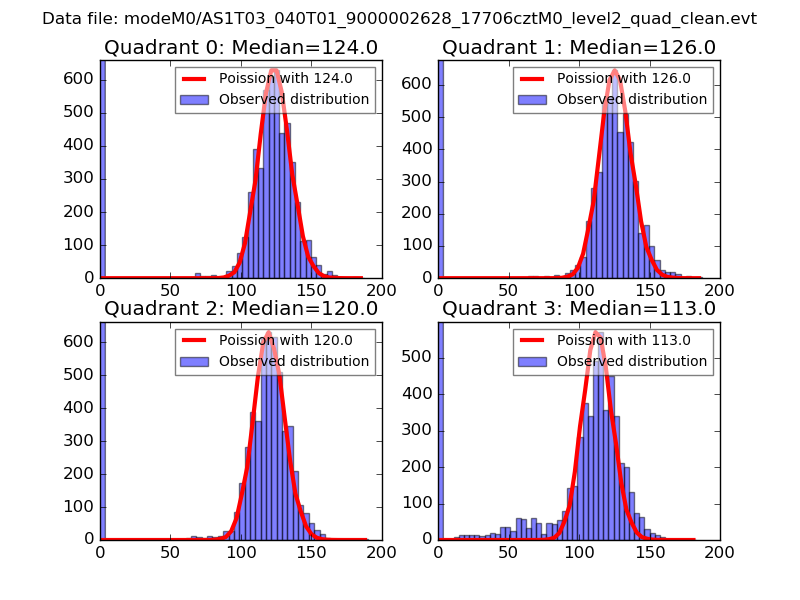 |
 |
| Quadrant-wise count rates Data is divided into 100 sec bins |
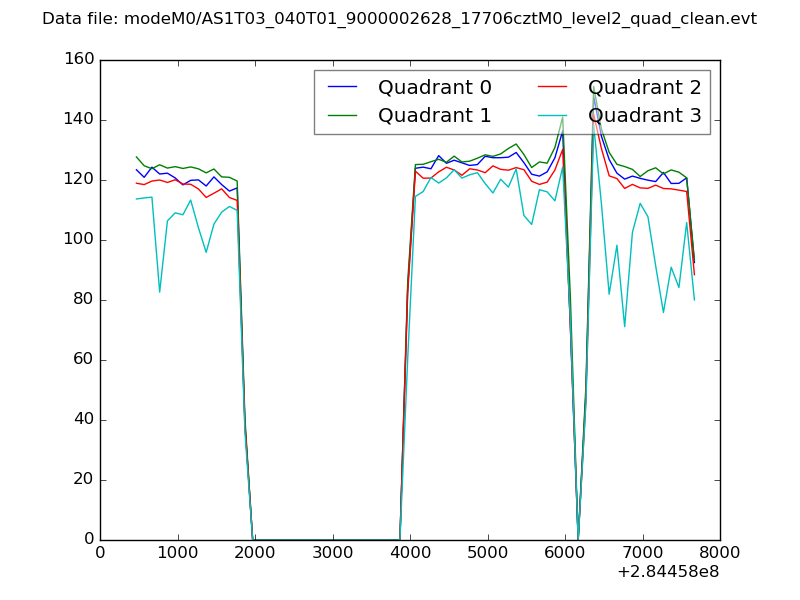 |
|
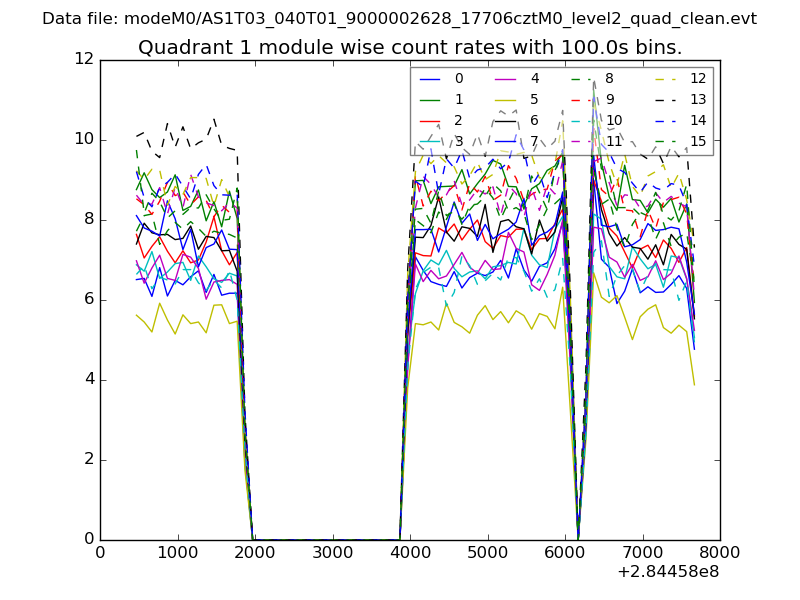
| Module-wise count rates for Quadrant A Data is divided into 100 sec bins |
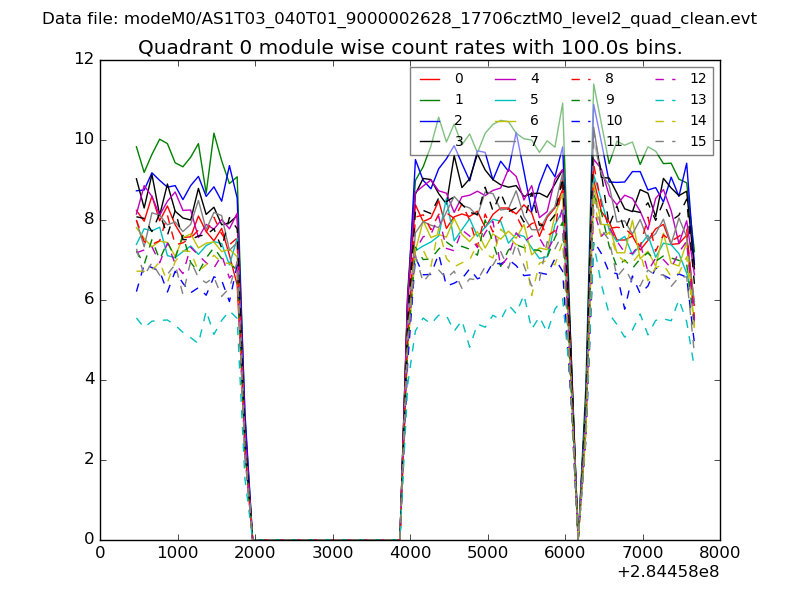 |
 |
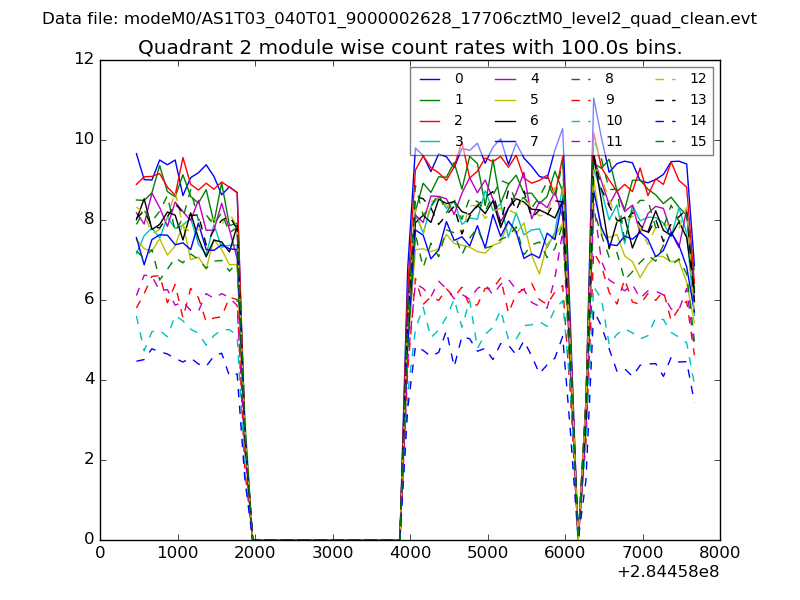
| Module-wise count rates for Quadrant B Data is divided into 100 sec bins |
 |
 |
| Module-wise count rates for Quadrant C Data is divided into 100 sec bins |
 |
 |
| Module-wise count rates for Quadrant D Data is divided into 100 sec bins |
 |
 |
| Parameter | Plot |
|---|---|
| CZT HV Monitor | 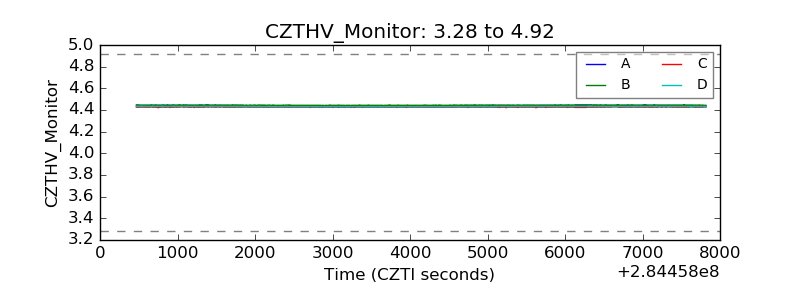 |
| D_VDD | 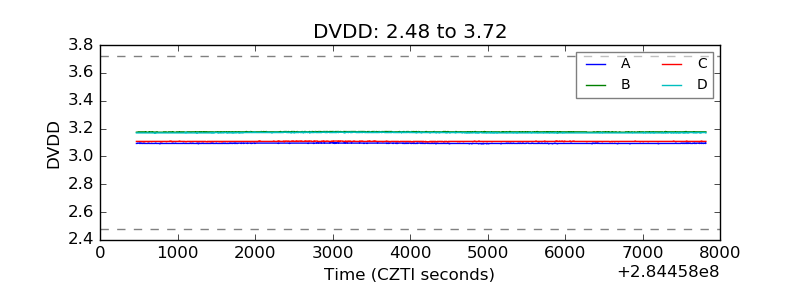 |
| Temperature 1 | 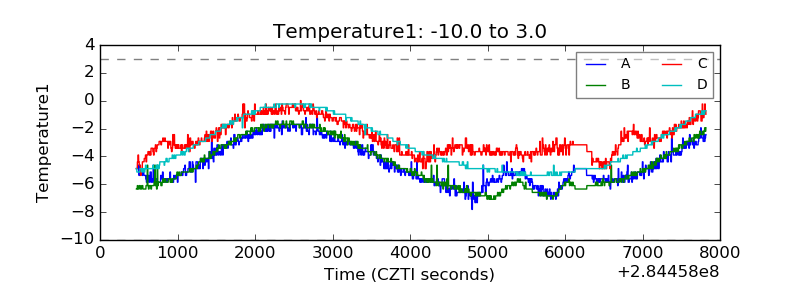 |
| Veto HV Monitor | 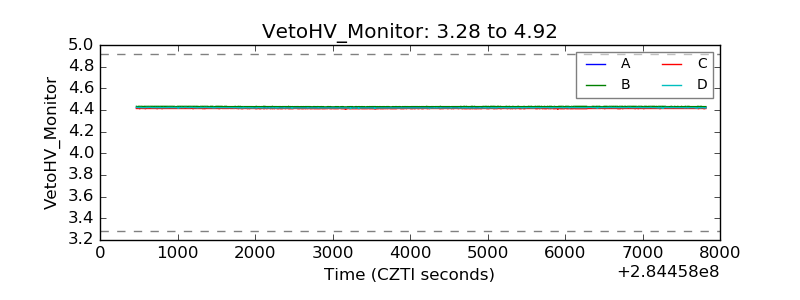 |
| Veto LLD | 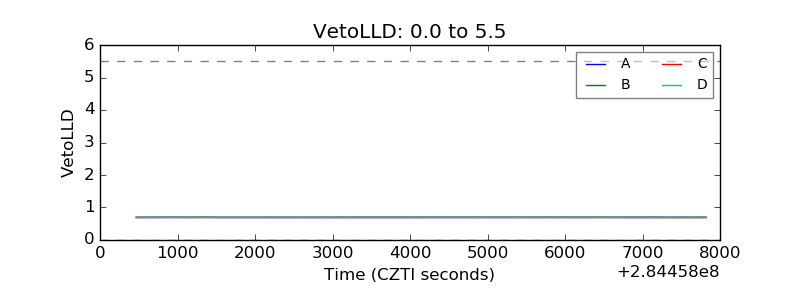 |
| Alpha Counter | 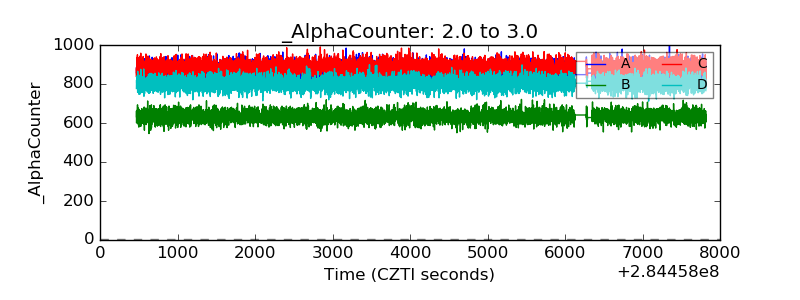 |
| _CPM_Rate | 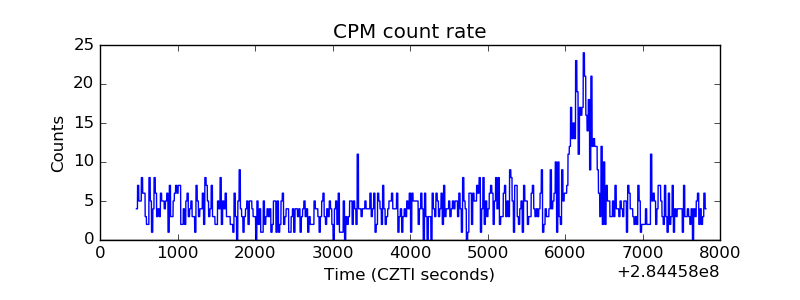 |
| CZT Counter | 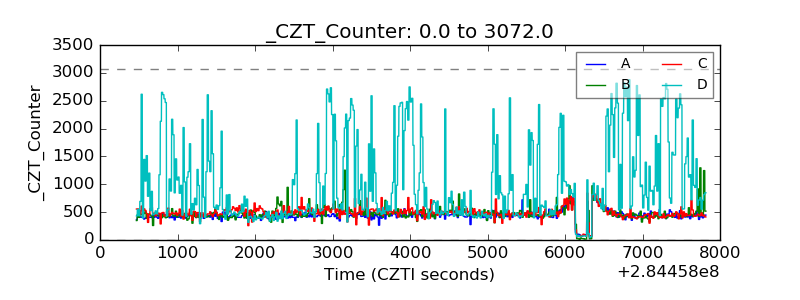 |
| +2.5 Volts monitor |  |
| +5 Volts monitor |  |
| _ROLL_ROT |  |
| _Roll_DEC | 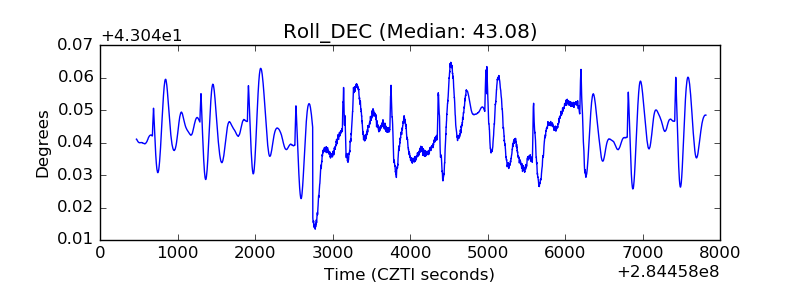 |
| _Roll_RA | 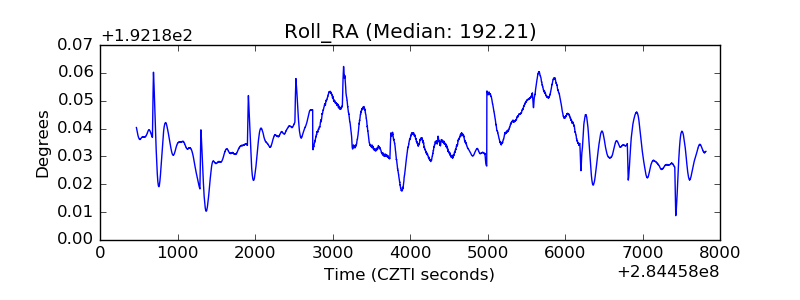 |
| Veto Counter | 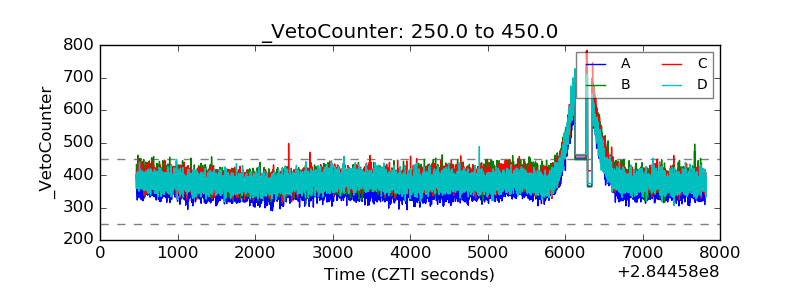 |