| Param | Original file | Final file |
|---|---|---|
| Filename | modeM0/AS1T03_040T01_9000002628_17707cztM0_level2.evt | modeM0/AS1T03_040T01_9000002628_17707cztM0_level2_quad_clean.evt |
| Size (bytes) | 626,829,120 | 84,078,720 |
| Size | 597.8 MB | 80.2 MB |
| Events in quadrant A | 3,333,154 | 539,710 |
| Events in quadrant B | 3,894,048 | 547,943 |
| Events in quadrant C | 3,467,271 | 525,507 |
| Events in quadrant D | 7,798,574 | 428,525 |
| Mode SS | |||
|---|---|---|---|
| Quadrant | BADHDUFLAG | Total packets | Discarded packets |
| A | 0 | 146 | 0 |
| B | 0 | 146 | 0 |
| C | 0 | 146 | 0 |
| D | 0 | 146 | 0 |
| Mode M0 | |||
|---|---|---|---|
| Quadrant | BADHDUFLAG | Total packets | Discarded packets |
| A | 0 | 14862 | 2 |
| B | 0 | 16300 | 1 |
| C | 0 | 14862 | 1 |
| D | 0 | 28069 | 1 |
| Mode M9 | |||
|---|---|---|---|
| Quadrant | BADHDUFLAG | Total packets | Discarded packets |
| A | 0 | 2 | 0 |
| B | 0 | 2 | 0 |
| C | 0 | 2 | 0 |
| D | 0 | 2 | 0 |
| Quadrant | Total seconds | Saturated seconds | Saturation percentage |
|---|---|---|---|
| A | 7232 | 159 | 2.198562% |
| B | 7233 | 235 | 3.248998% |
| C | 7233 | 185 | 2.557722% |
| D | 7233 | 1602 | 22.148486% |
Noise dominated data is calculated using 1-second bins in cleaned event files. If a bin has >2000 counts, and if more than 50% of those come from <1% of pixels, then it is considered to be noise-dominated and hence unusable.
| Quadrant | # 1 sec bins | Bins with >0 counts | Bins with >2000 counts | High rate bins dominated by noise | Noise dominated (total time) | Noise dominated (detector-on time) | Marked lightcurve |
|---|---|---|---|---|---|---|---|
| A | 7417 | 7234 | 0 | 0 | 0.00% | 0.00% | 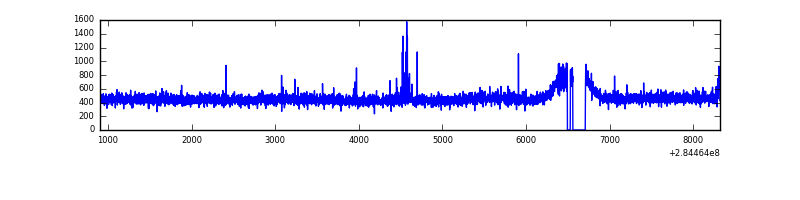 |
| B | 7418 | 7235 | 53 | 53 | 0.71% | 0.73% | 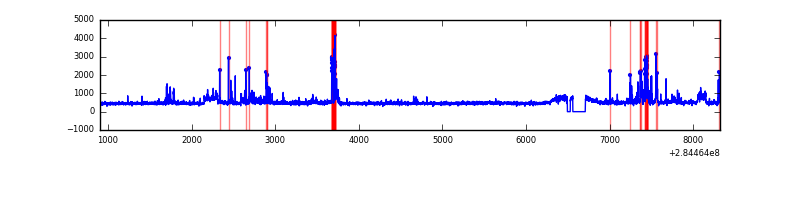 |
| C | 7418 | 7235 | 2 | 2 | 0.03% | 0.03% | 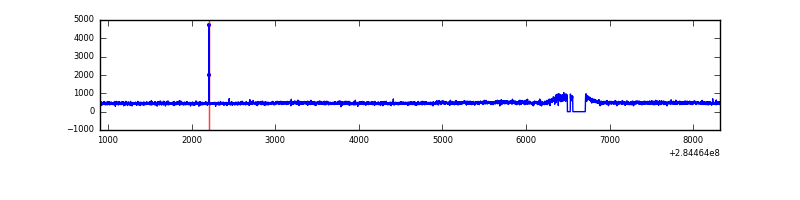 |
| D | 7418 | 7233 | 1219 | 1219 | 16.43% | 16.85% | 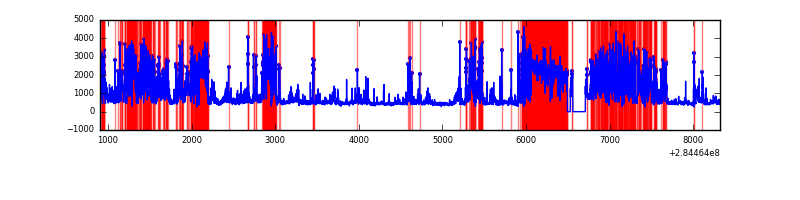 |
Top three noisy pixels from each quadrant. If the there are fewer than three noisy pixels in the level2.evt file, extra rows are filled as -1
| Pixel properties | Quadrant properties | ||||||
|---|---|---|---|---|---|---|---|
| Quadrant | DetID | PixID | Counts | Sigma | Mean | Median | Sigma |
| A | 15 | 174 | 32390 | 179.2 | 858 | 839 | 176.1 |
| A | 0 | 226 | 7406 | 37.3 | 858 | 839 | 176.1 |
| A | 3 | 137 | 6590 | 32.66 | 858 | 839 | 176.1 |
| B | 10 | 245 | 235815 | 1422.8 | 853 | 829 | 165.2 |
| B | 0 | 189 | 116451 | 700.07 | 853 | 829 | 165.2 |
| B | 5 | 172 | 80944 | 485.08 | 853 | 829 | 165.2 |
| C | 14 | 238 | 124827 | 643.23 | 817 | 821 | 192.8 |
| C | 3 | 233 | 90096 | 463.07 | 817 | 821 | 192.8 |
| C | 5 | 218 | 49801 | 254.06 | 817 | 821 | 192.8 |
| D | 7 | 238 | 4992473 | 28140.61 | 725 | 703 | 177.4 |
| D | 2 | 234 | 27958 | 153.65 | 725 | 703 | 177.4 |
| D | 10 | 70 | 19975 | 108.64 | 725 | 703 | 177.4 |
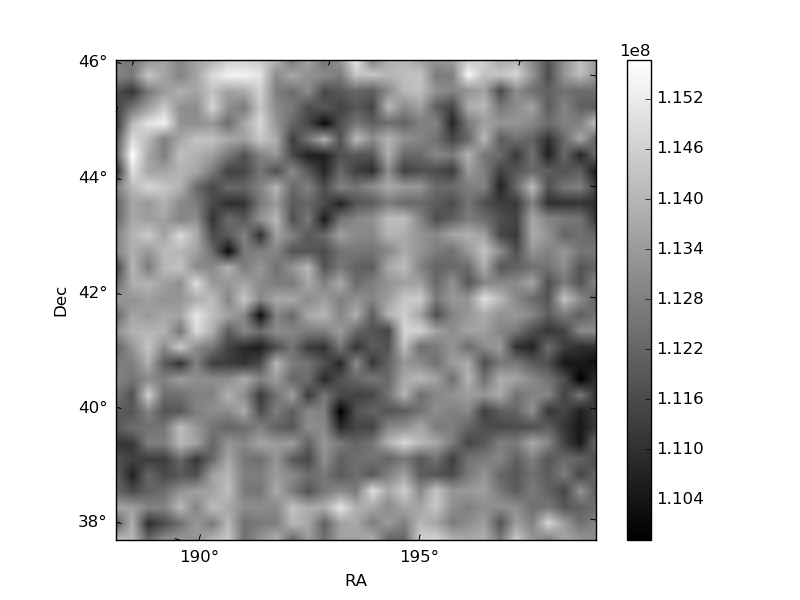
Histogram calculated using DETX and DETY for each event in the final _common_clean file
| Quadrant A | 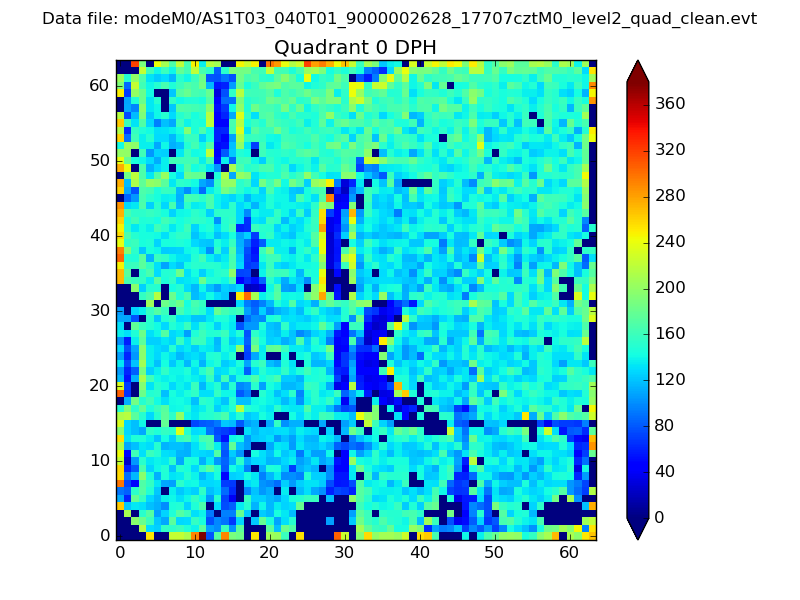 |
 |
Quadrant B |
|---|---|---|---|
| Quadrant D | 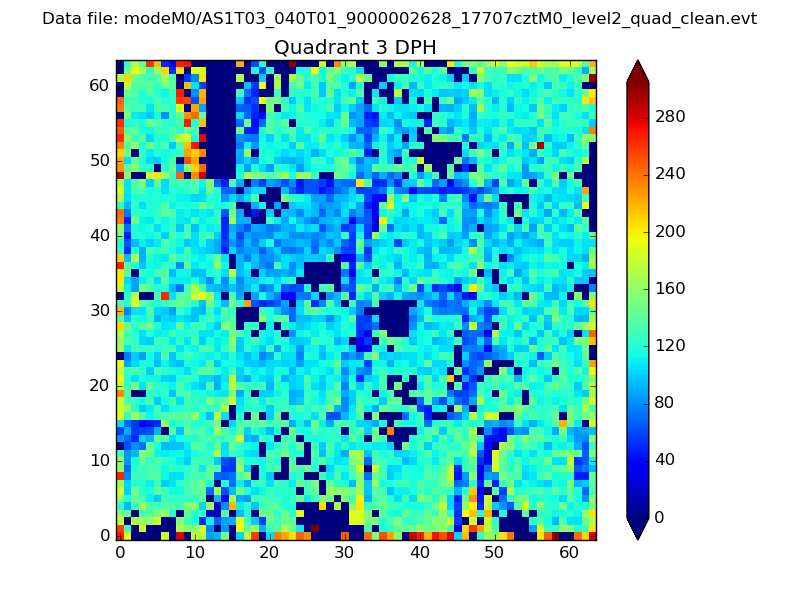 |
 |
Quadrant C |
| Plot type | Count rate plots | Images |
|---|---|---|
| Comparison with Poisson distribution Blue bars denote a histogram of data divided into 1 sec bins. Red curve is a Poisson curve with rate = median count rate of data. |
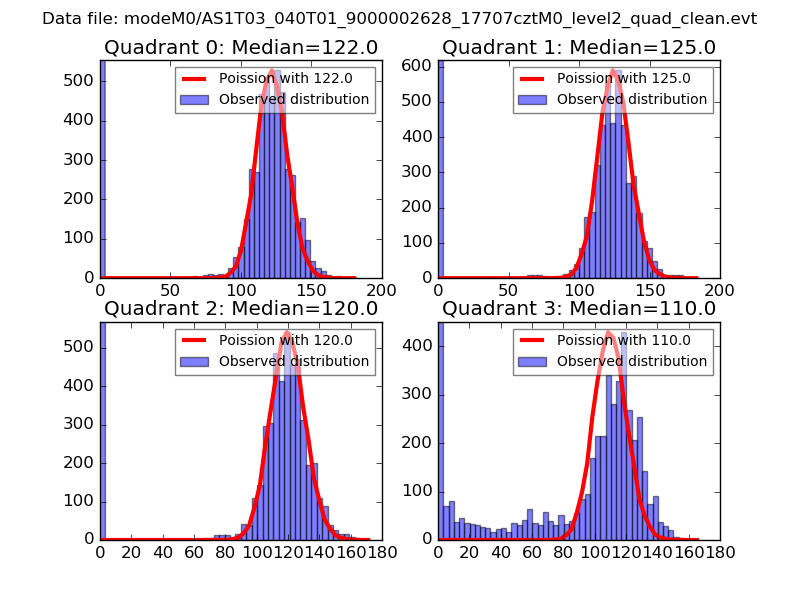 |
 |
| Quadrant-wise count rates Data is divided into 100 sec bins |
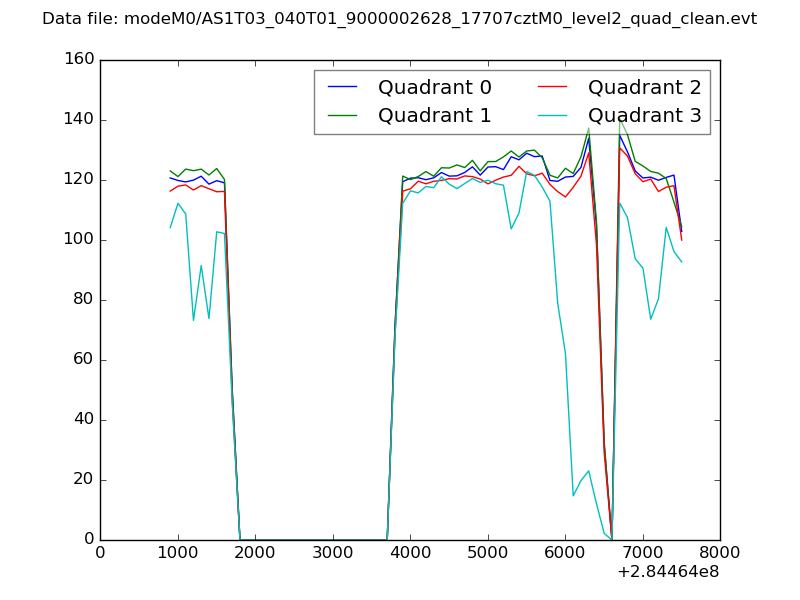 |
|
| Module-wise count rates for Quadrant A Data is divided into 100 sec bins |
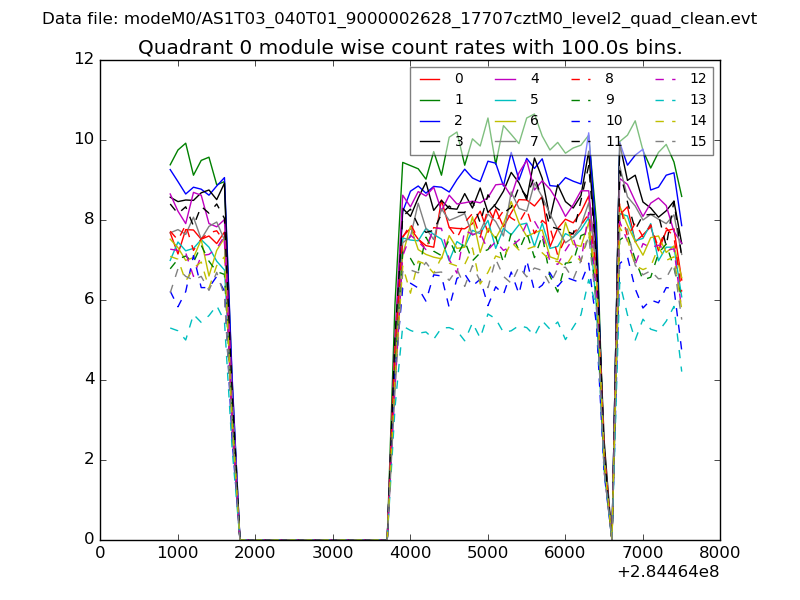 |
 |
| Module-wise count rates for Quadrant B Data is divided into 100 sec bins |
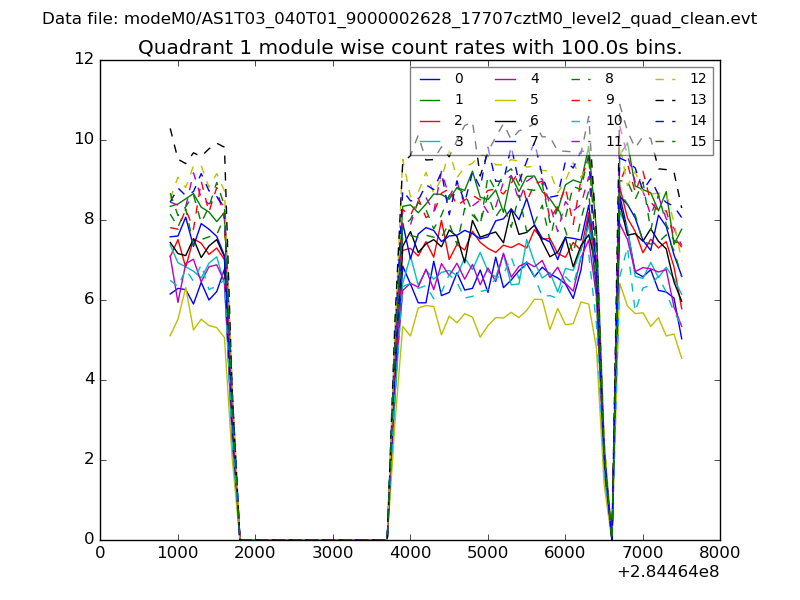 |
 |
| Module-wise count rates for Quadrant C Data is divided into 100 sec bins |
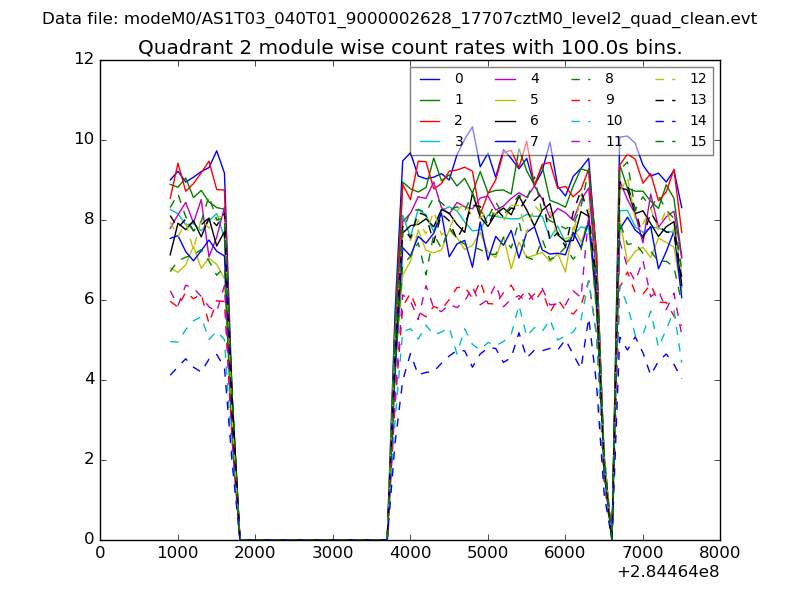 |
 |
| Module-wise count rates for Quadrant D Data is divided into 100 sec bins |
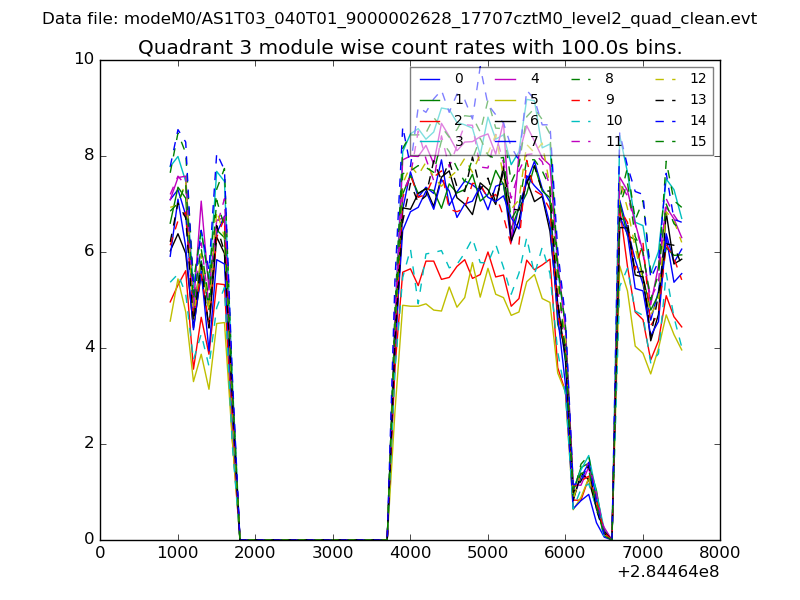 |
 |
| Parameter | Plot |
|---|---|
| CZT HV Monitor | 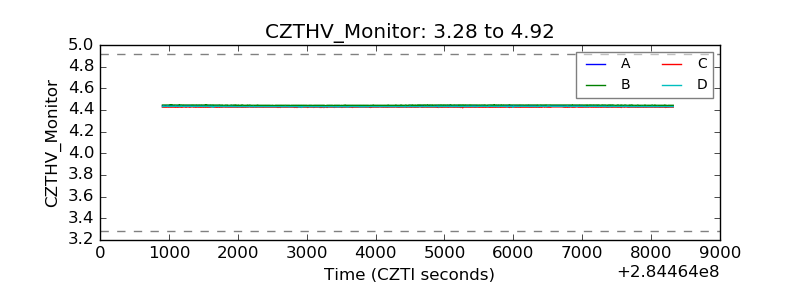 |
| D_VDD | 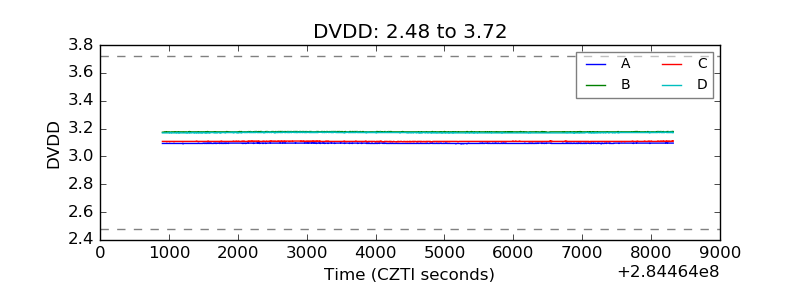 |
| Temperature 1 | 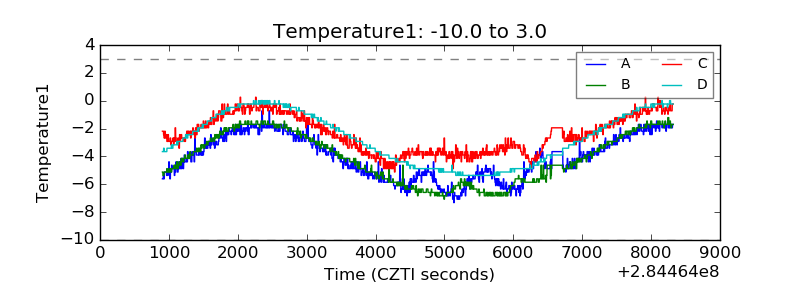 |
| Veto HV Monitor | 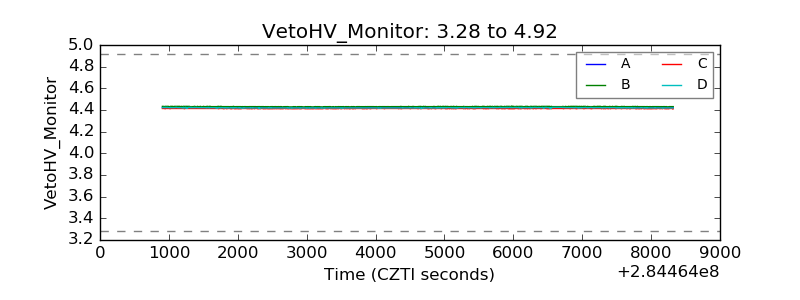 |
| Veto LLD | 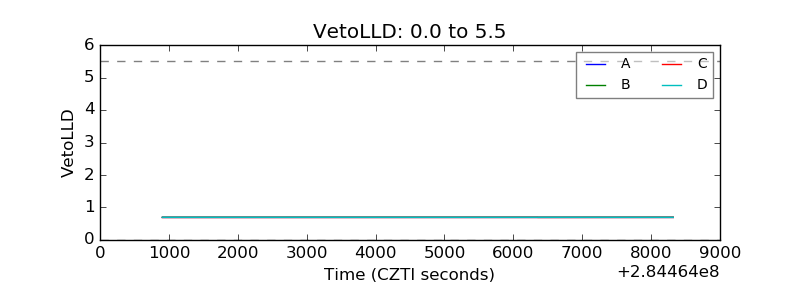 |
| Alpha Counter | 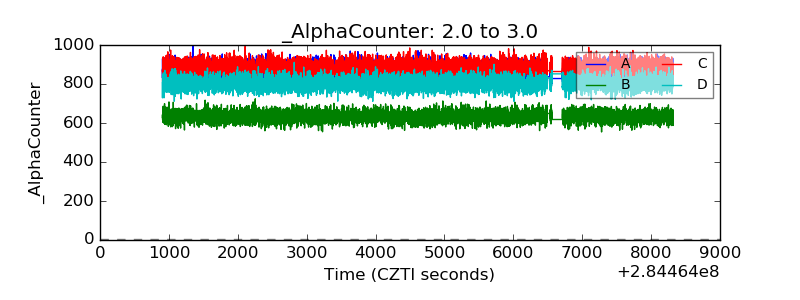 |
| _CPM_Rate | 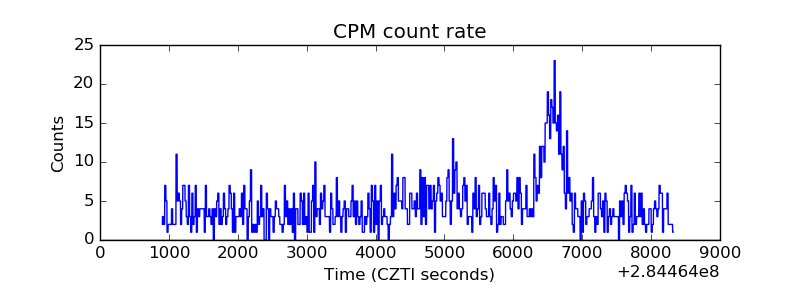 |
| CZT Counter |  |
| +2.5 Volts monitor |  |
| +5 Volts monitor |  |
| _ROLL_ROT | 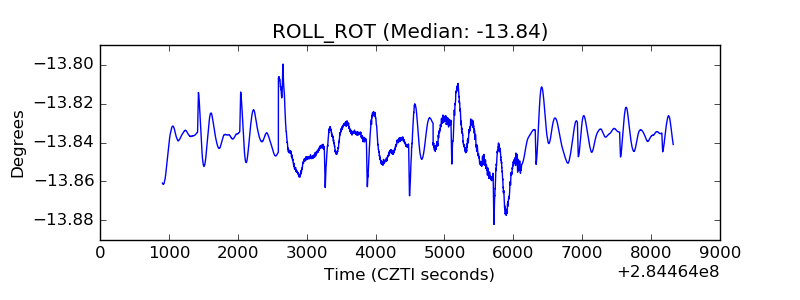 |
| _Roll_DEC | 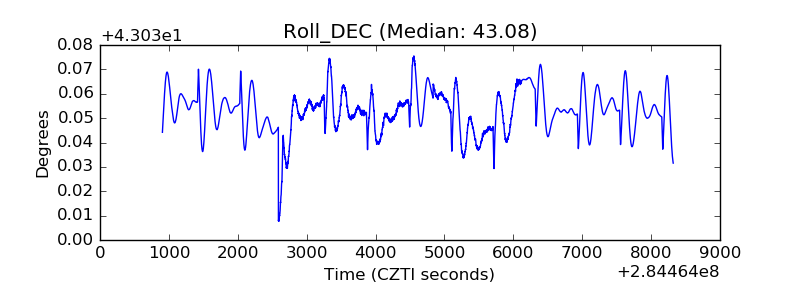 |
| _Roll_RA | 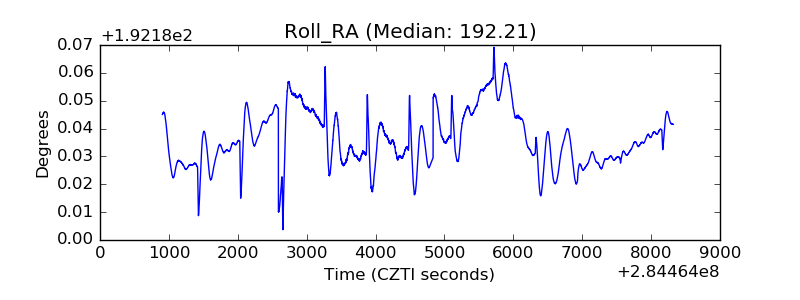 |
| Veto Counter | 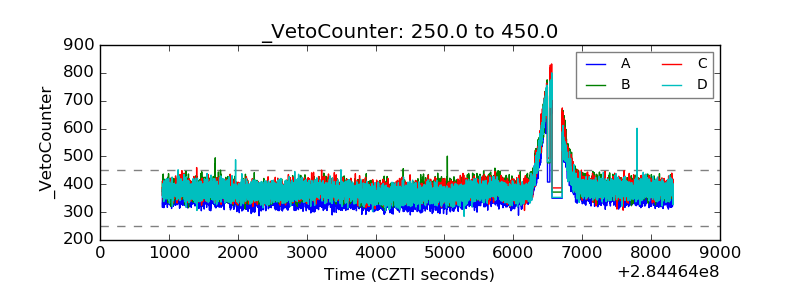 |