| Param | Original file | Final file |
|---|---|---|
| Filename | modeM0/AS1T03_040T01_9000002628_17708cztM0_level2.evt | modeM0/AS1T03_040T01_9000002628_17708cztM0_level2_quad_clean.evt |
| Size (bytes) | 653,423,040 | 82,414,080 |
| Size | 623.2 MB | 78.6 MB |
| Events in quadrant A | 3,506,141 | 516,832 |
| Events in quadrant B | 4,031,347 | 523,494 |
| Events in quadrant C | 3,776,264 | 504,198 |
| Events in quadrant D | 7,962,207 | 423,627 |
| Mode SS | |||
|---|---|---|---|
| Quadrant | BADHDUFLAG | Total packets | Discarded packets |
| A | 0 | 156 | 0 |
| B | 0 | 156 | 0 |
| C | 0 | 156 | 0 |
| D | 0 | 156 | 0 |
| Mode M0 | |||
|---|---|---|---|
| Quadrant | BADHDUFLAG | Total packets | Discarded packets |
| A | 0 | 15489 | 2 |
| B | 0 | 16763 | 2 |
| C | 0 | 15893 | 2 |
| D | 0 | 28834 | 2 |
| Mode M9 | |||
|---|---|---|---|
| Quadrant | BADHDUFLAG | Total packets | Discarded packets |
| A | 0 | 6 | 0 |
| B | 0 | 6 | 0 |
| C | 0 | 6 | 0 |
| D | 0 | 6 | 0 |
| Quadrant | Total seconds | Saturated seconds | Saturation percentage |
|---|---|---|---|
| A | 7569 | 102 | 1.347602% |
| B | 7570 | 173 | 2.285337% |
| C | 7569 | 125 | 1.651473% |
| D | 7569 | 1469 | 19.408112% |
Noise dominated data is calculated using 1-second bins in cleaned event files. If a bin has >2000 counts, and if more than 50% of those come from <1% of pixels, then it is considered to be noise-dominated and hence unusable.
| Quadrant | # 1 sec bins | Bins with >0 counts | Bins with >2000 counts | High rate bins dominated by noise | Noise dominated (total time) | Noise dominated (detector-on time) | Marked lightcurve |
|---|---|---|---|---|---|---|---|
| A | 8165 | 7571 | 2 | 2 | 0.02% | 0.03% | 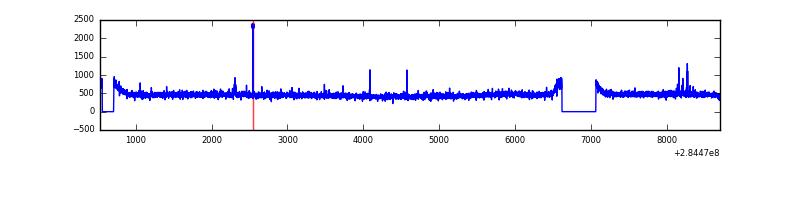 |
| B | 8166 | 7572 | 41 | 41 | 0.50% | 0.54% | 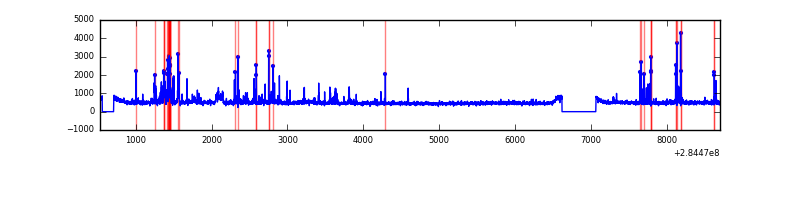 |
| C | 8165 | 7571 | 0 | 0 | 0.00% | 0.00% | 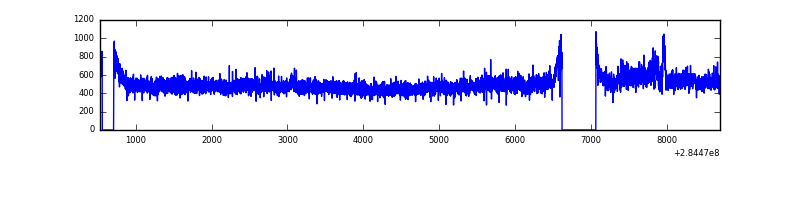 |
| D | 8165 | 7569 | 1081 | 1081 | 13.24% | 14.28% | 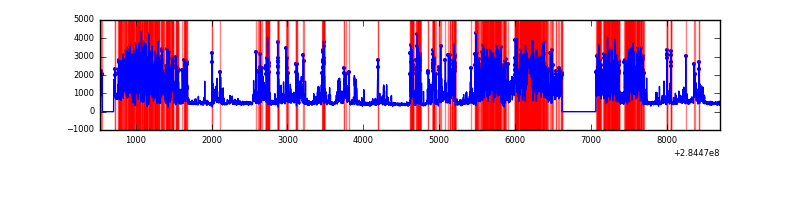 |
Top three noisy pixels from each quadrant. If the there are fewer than three noisy pixels in the level2.evt file, extra rows are filled as -1
| Pixel properties | Quadrant properties | ||||||
|---|---|---|---|---|---|---|---|
| Quadrant | DetID | PixID | Counts | Sigma | Mean | Median | Sigma |
| A | 15 | 174 | 16513 | 84.57 | 904 | 883 | 184.8 |
| A | 14 | 234 | 10265 | 50.77 | 904 | 883 | 184.8 |
| A | 0 | 226 | 7769 | 37.26 | 904 | 883 | 184.8 |
| B | 10 | 245 | 267789 | 1536.6 | 898 | 875 | 173.7 |
| B | 0 | 189 | 73758 | 419.58 | 898 | 875 | 173.7 |
| B | 7 | 220 | 58122 | 329.57 | 898 | 875 | 173.7 |
| C | 3 | 233 | 228292 | 1121.04 | 860 | 863 | 202.9 |
| C | 14 | 238 | 133533 | 653.96 | 860 | 863 | 202.9 |
| C | 5 | 218 | 46799 | 226.43 | 860 | 863 | 202.9 |
| D | 7 | 238 | 4797471 | 24476.22 | 803 | 777 | 196.0 |
| D | 10 | 70 | 88585 | 448.06 | 803 | 777 | 196.0 |
| D | 2 | 234 | 29894 | 148.58 | 803 | 777 | 196.0 |
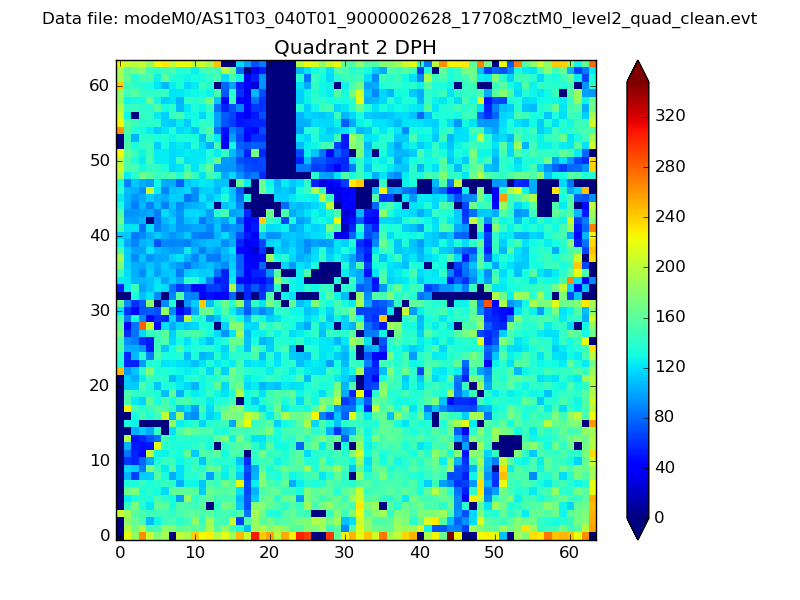
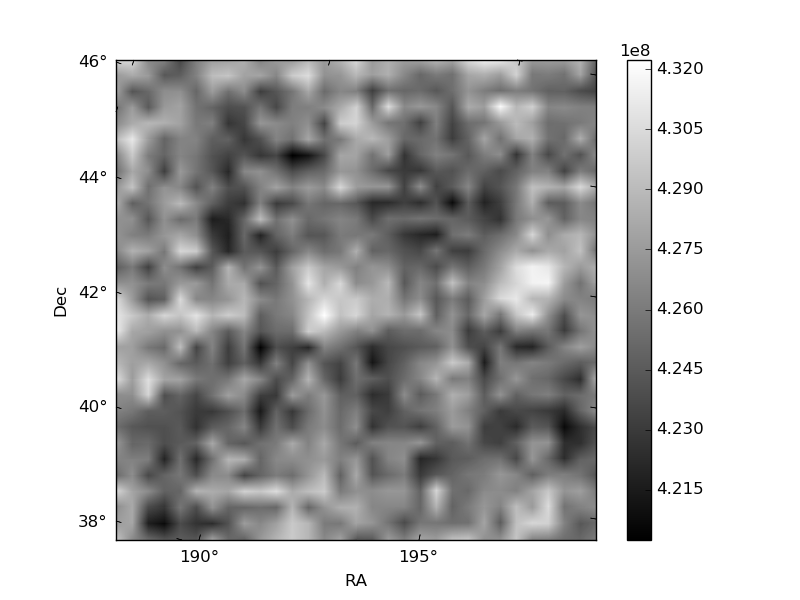
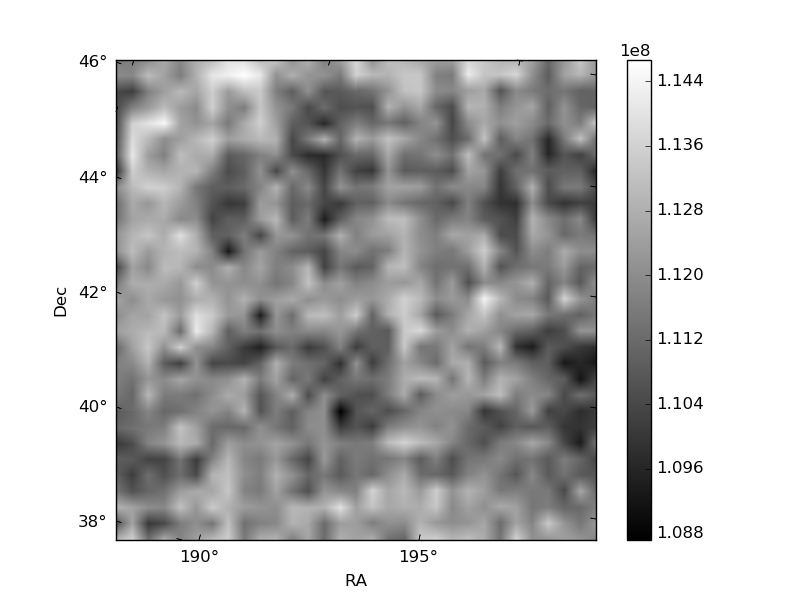
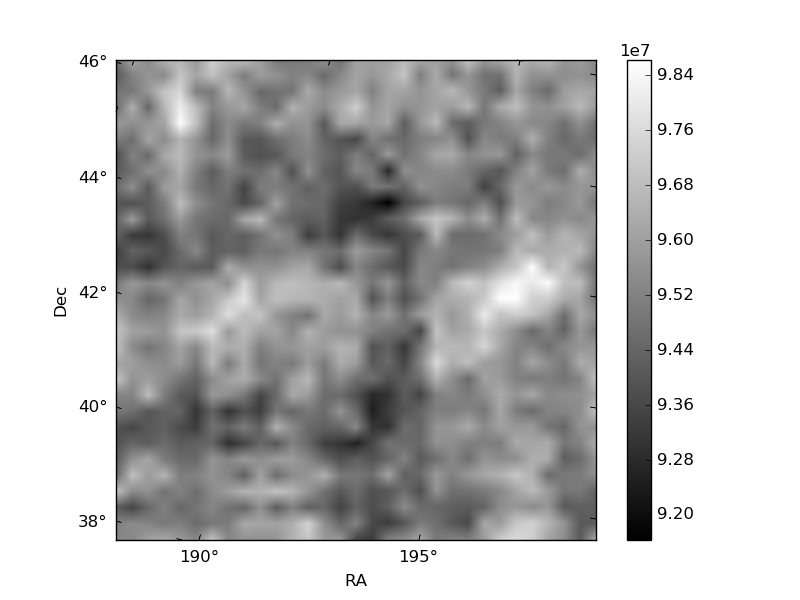
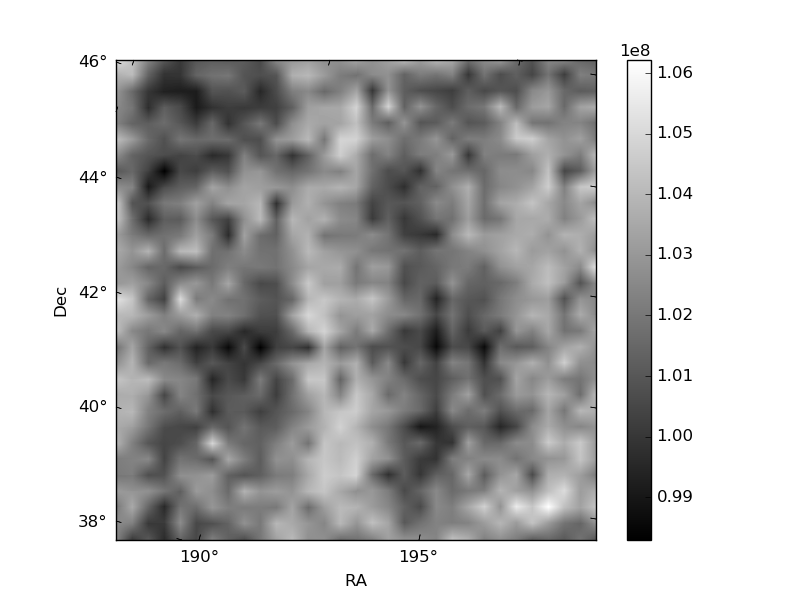
Histogram calculated using DETX and DETY for each event in the final _common_clean file
| Quadrant A | 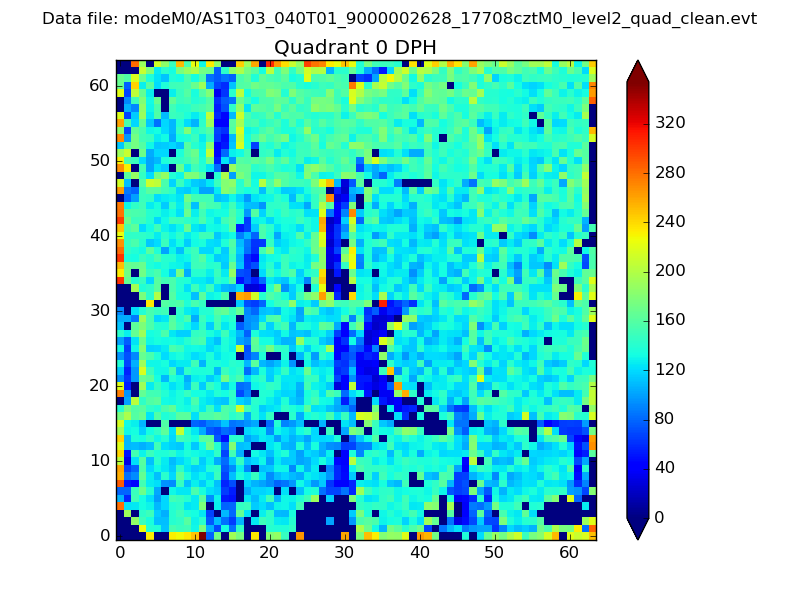 |
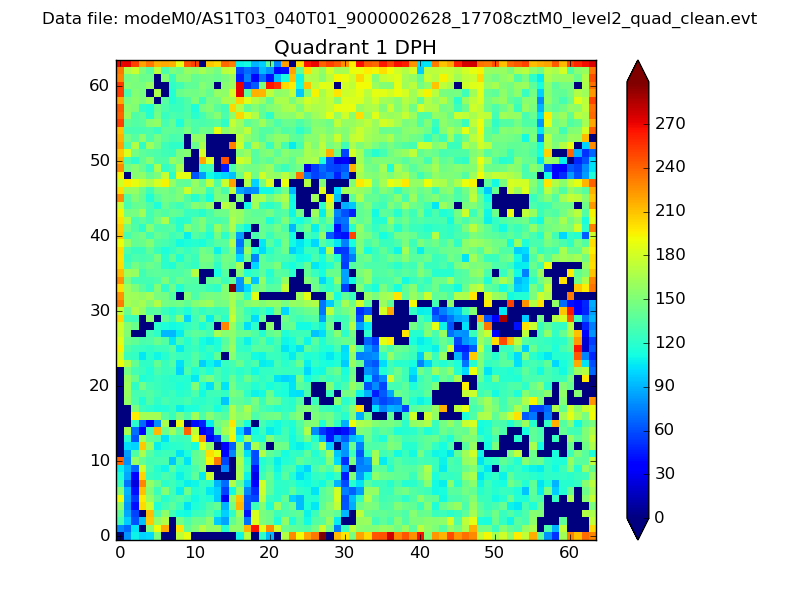 |
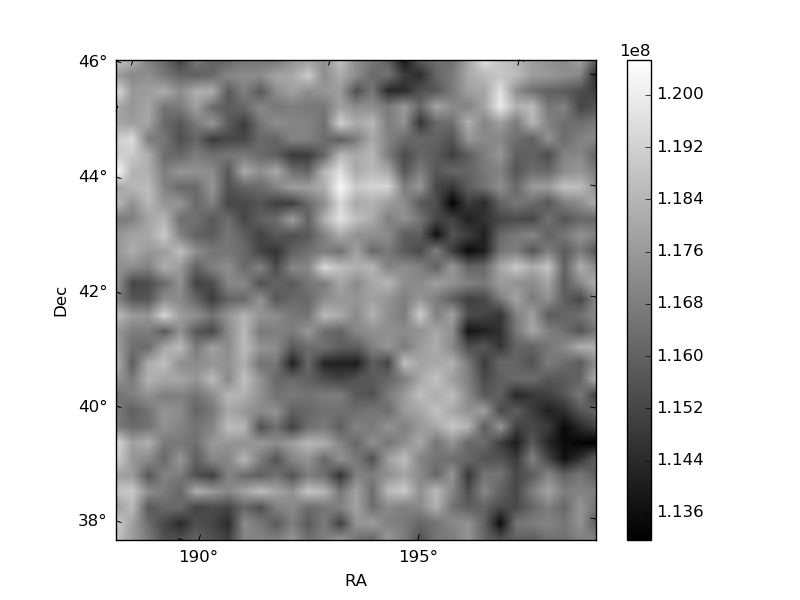
Quadrant B |
|---|---|---|---|
| Quadrant D | 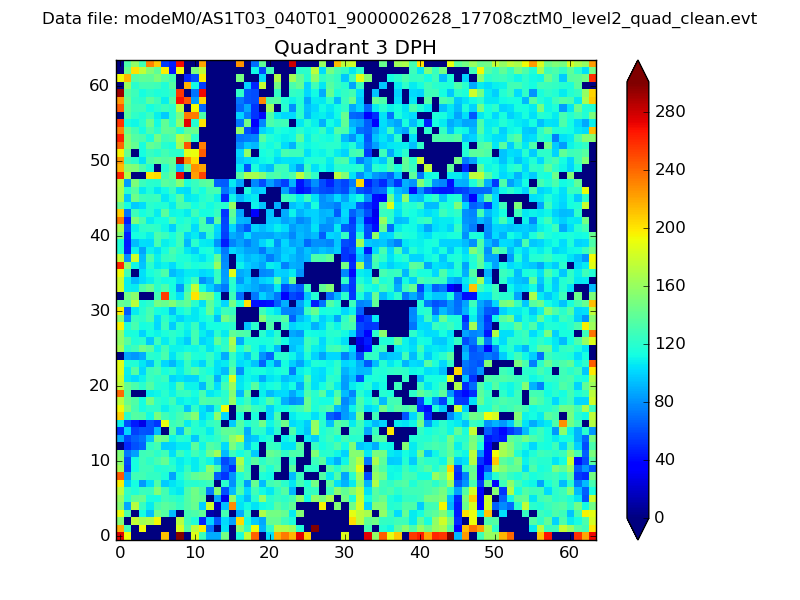 |
 |
Quadrant C |
| Plot type | Count rate plots | Images |
|---|---|---|
| Comparison with Poisson distribution Blue bars denote a histogram of data divided into 1 sec bins. Red curve is a Poisson curve with rate = median count rate of data. |
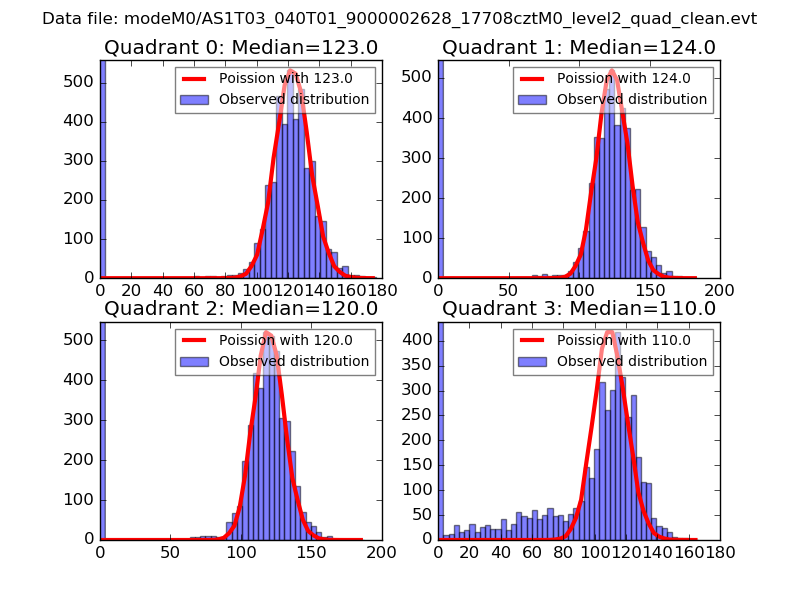 |
 |
| Quadrant-wise count rates Data is divided into 100 sec bins |
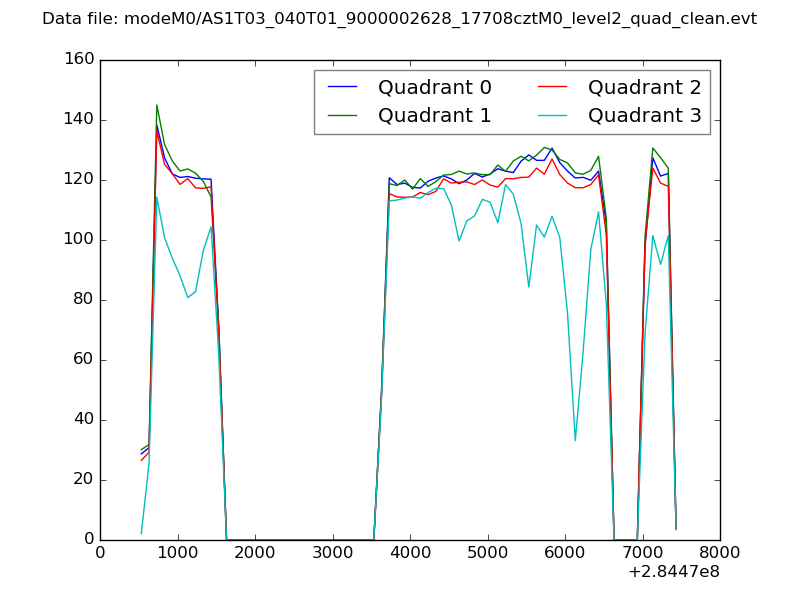 |
|
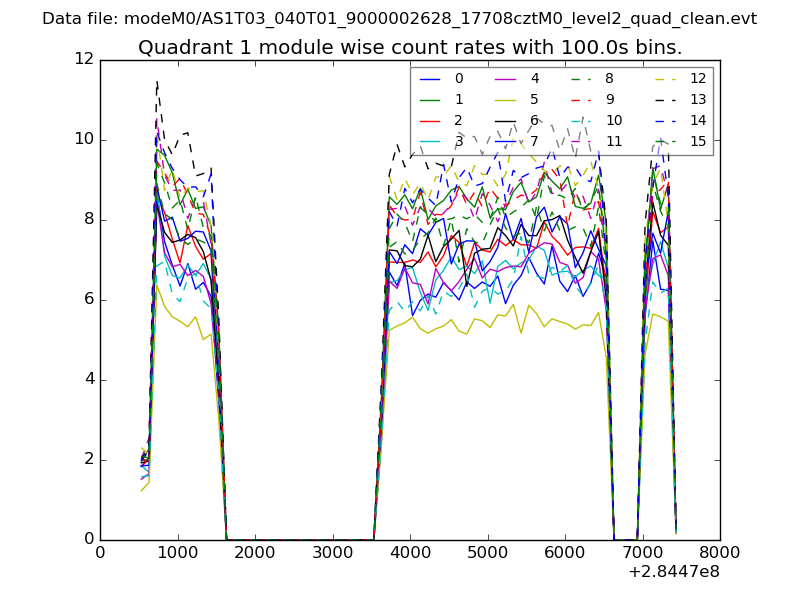
| Module-wise count rates for Quadrant A Data is divided into 100 sec bins |
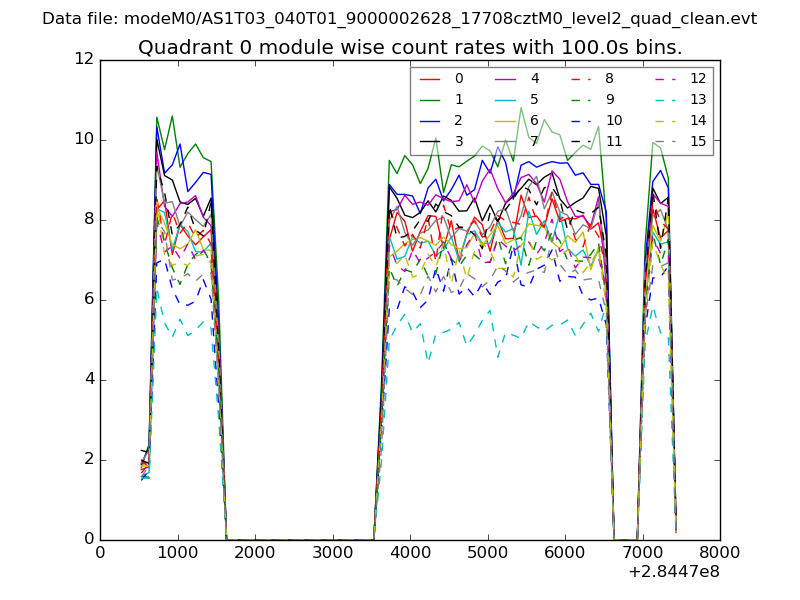 |
 |
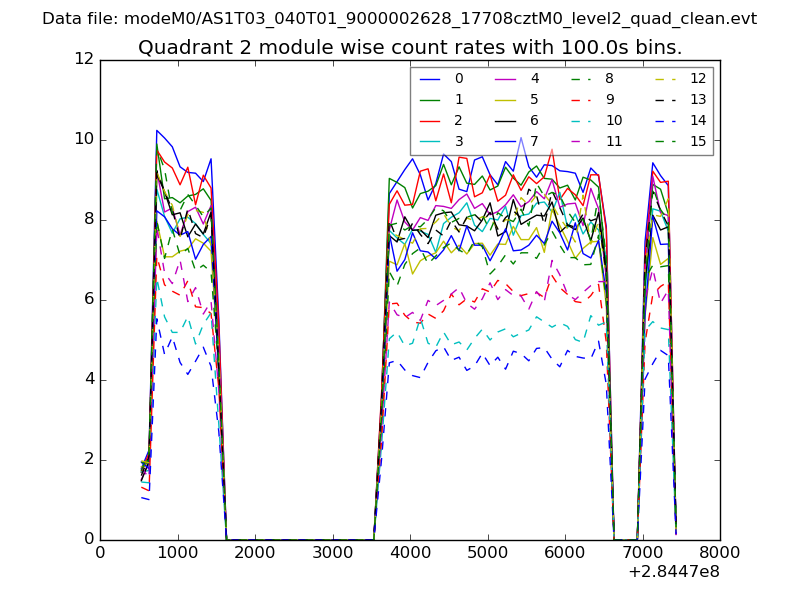
| Module-wise count rates for Quadrant B Data is divided into 100 sec bins |
 |
 |
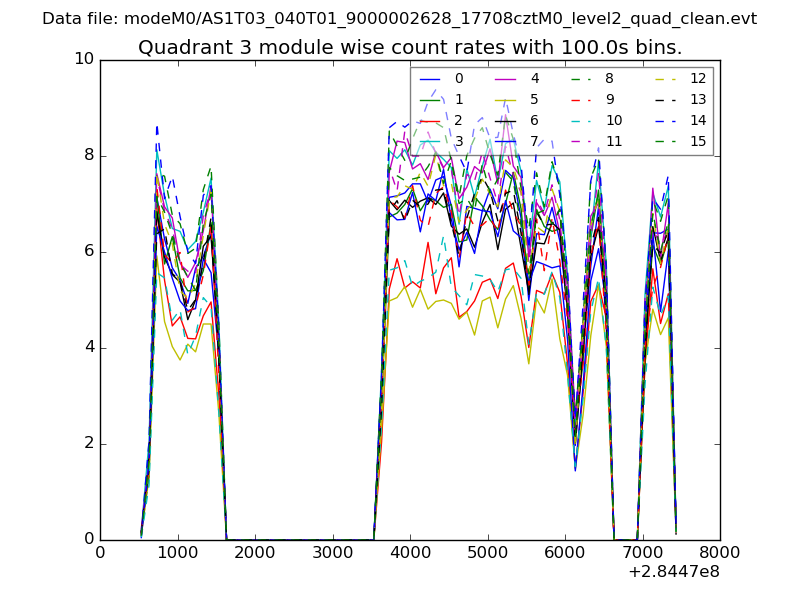
| Module-wise count rates for Quadrant C Data is divided into 100 sec bins |
 |
 |
| Module-wise count rates for Quadrant D Data is divided into 100 sec bins |
 |
 |
| Parameter | Plot |
|---|---|
| CZT HV Monitor | 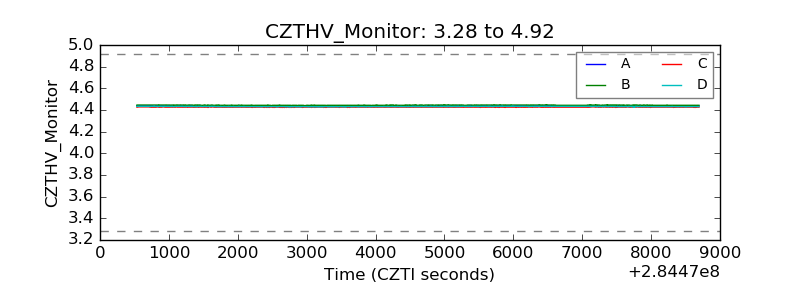 |
| D_VDD | 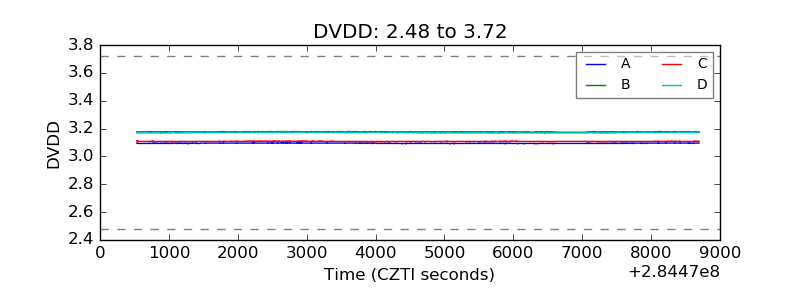 |
| Temperature 1 | 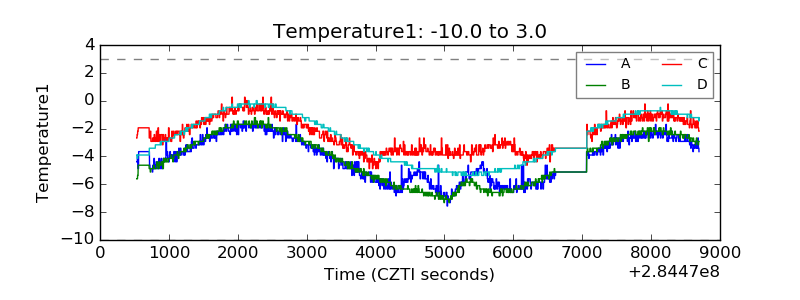 |
| Veto HV Monitor | 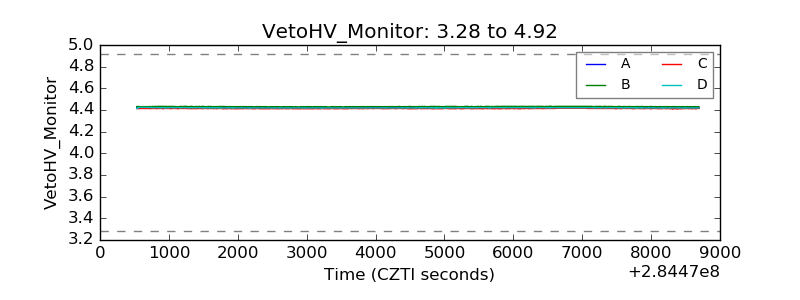 |
| Veto LLD | 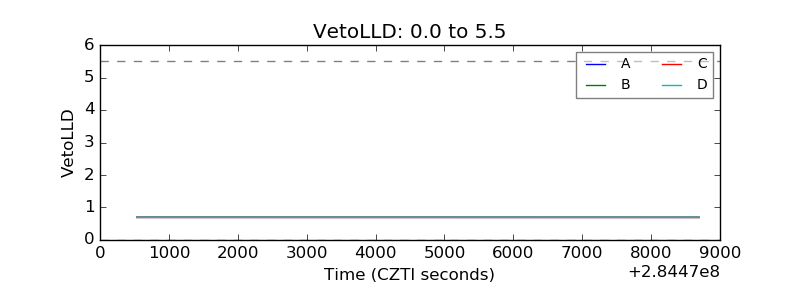 |
| Alpha Counter | 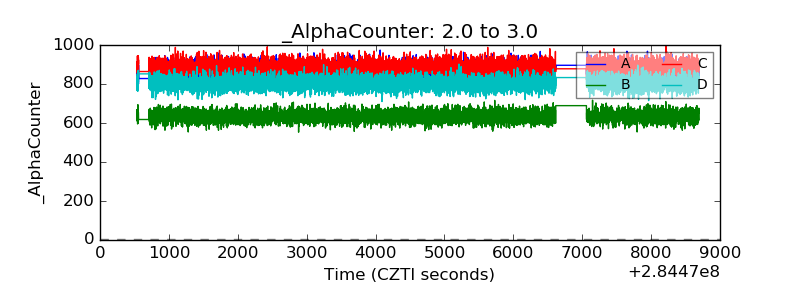 |
| _CPM_Rate | 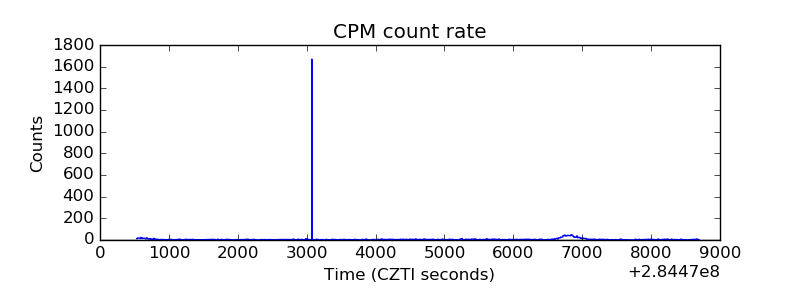 |
| CZT Counter | 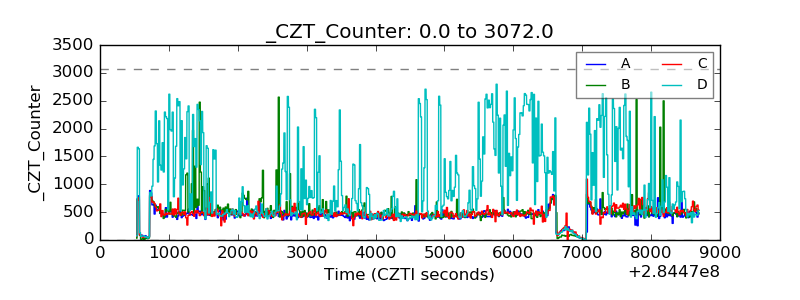 |
| +2.5 Volts monitor |  |
| +5 Volts monitor |  |
| _ROLL_ROT | 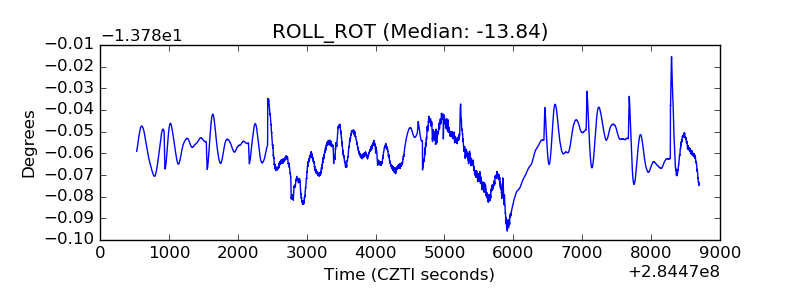 |
| _Roll_DEC | 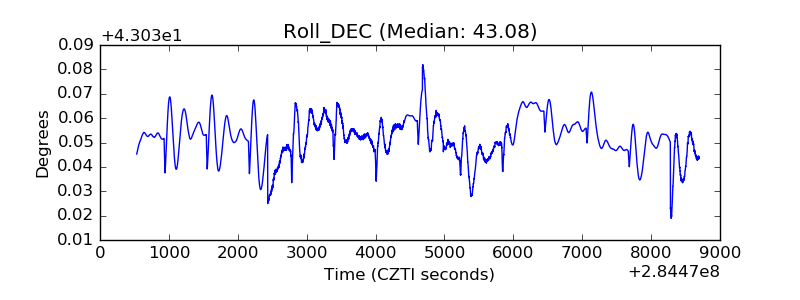 |
| _Roll_RA | 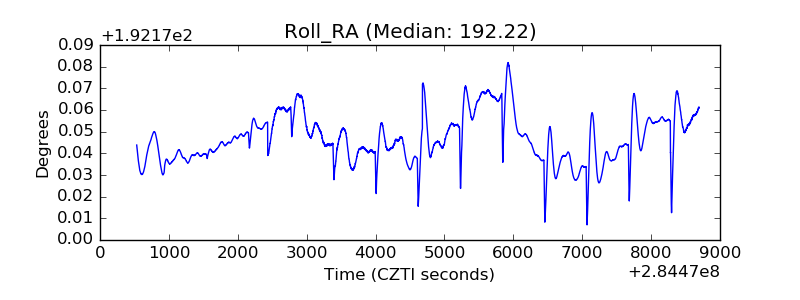 |
| Veto Counter | 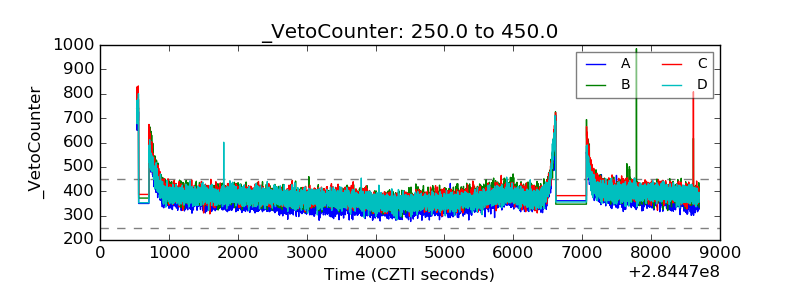 |