| Param | Original file | Final file |
|---|---|---|
| Filename | modeM0/AS1T03_040T01_9000002628_17710cztM0_level2.evt | modeM0/AS1T03_040T01_9000002628_17710cztM0_level2_quad_clean.evt |
| Size (bytes) | 1,045,800,000 | 138,245,760 |
| Size | 997.4 MB | 131.8 MB |
| Events in quadrant A | 5,890,370 | 855,529 |
| Events in quadrant B | 6,330,800 | 864,319 |
| Events in quadrant C | 6,389,504 | 832,172 |
| Events in quadrant D | 12,202,409 | 755,883 |
| Mode SS | |||
|---|---|---|---|
| Quadrant | BADHDUFLAG | Total packets | Discarded packets |
| A | 0 | 260 | 0 |
| B | 0 | 260 | 0 |
| C | 0 | 260 | 0 |
| D | 0 | 260 | 0 |
| Mode M0 | |||
|---|---|---|---|
| Quadrant | BADHDUFLAG | Total packets | Discarded packets |
| A | 0 | 26076 | 3 |
| B | 0 | 27043 | 3 |
| C | 0 | 26598 | 3 |
| D | 0 | 45101 | 3 |
| Mode M9 | |||
|---|---|---|---|
| Quadrant | BADHDUFLAG | Total packets | Discarded packets |
| A | 0 | 13 | 0 |
| B | 0 | 13 | 0 |
| C | 0 | 13 | 0 |
| D | 0 | 13 | 0 |
| Quadrant | Total seconds | Saturated seconds | Saturation percentage |
|---|---|---|---|
| A | 12700 | 87 | 0.685039% |
| B | 12700 | 146 | 1.149606% |
| C | 12701 | 150 | 1.181009% |
| D | 12701 | 2078 | 16.360916% |
Noise dominated data is calculated using 1-second bins in cleaned event files. If a bin has >2000 counts, and if more than 50% of those come from <1% of pixels, then it is considered to be noise-dominated and hence unusable.
| Quadrant | # 1 sec bins | Bins with >0 counts | Bins with >2000 counts | High rate bins dominated by noise | Noise dominated (total time) | Noise dominated (detector-on time) | Marked lightcurve |
|---|---|---|---|---|---|---|---|
| A | 14060 | 12702 | 6 | 6 | 0.04% | 0.05% | 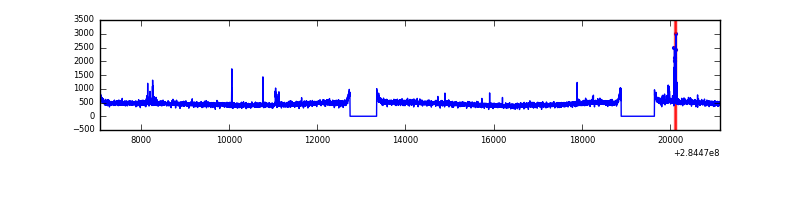 |
| B | 14060 | 12701 | 30 | 30 | 0.21% | 0.24% | 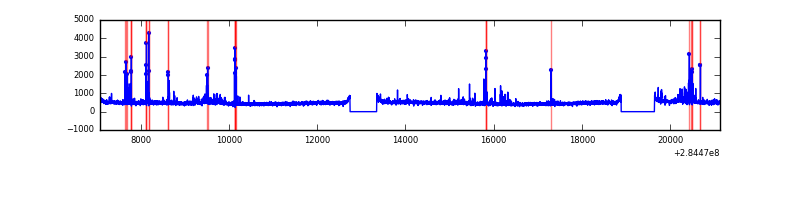 |
| C | 14061 | 12702 | 0 | 0 | 0.00% | 0.00% | 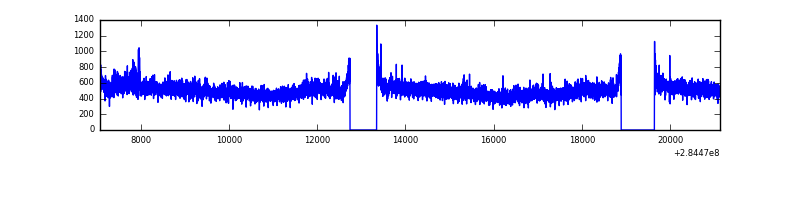 |
| D | 14061 | 12701 | 1615 | 1615 | 11.49% | 12.72% | 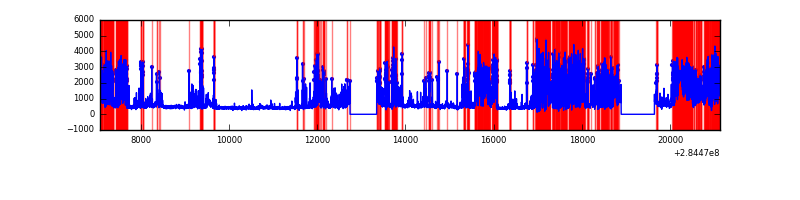 |
Top three noisy pixels from each quadrant. If the there are fewer than three noisy pixels in the level2.evt file, extra rows are filled as -1
| Pixel properties | Quadrant properties | ||||||
|---|---|---|---|---|---|---|---|
| Quadrant | DetID | PixID | Counts | Sigma | Mean | Median | Sigma |
| A | 15 | 174 | 81223 | 260.01 | 1510 | 1475 | 306.7 |
| A | 0 | 226 | 13149 | 38.06 | 1510 | 1475 | 306.7 |
| A | 3 | 137 | 11662 | 33.21 | 1510 | 1475 | 306.7 |
| B | 10 | 245 | 152116 | 520.84 | 1506 | 1464 | 289.3 |
| B | 0 | 189 | 111313 | 379.77 | 1506 | 1464 | 289.3 |
| B | 0 | 197 | 72182 | 244.49 | 1506 | 1464 | 289.3 |
| C | 3 | 233 | 459293 | 1351.86 | 1446 | 1454 | 338.7 |
| C | 14 | 238 | 221964 | 651.1 | 1446 | 1454 | 338.7 |
| C | 5 | 218 | 62572 | 180.46 | 1446 | 1454 | 338.7 |
| D | 7 | 238 | 6868461 | 20374.7 | 1371 | 1328 | 337.0 |
| D | 13 | 168 | 52338 | 151.35 | 1371 | 1328 | 337.0 |
| D | 2 | 234 | 50073 | 144.63 | 1371 | 1328 | 337.0 |
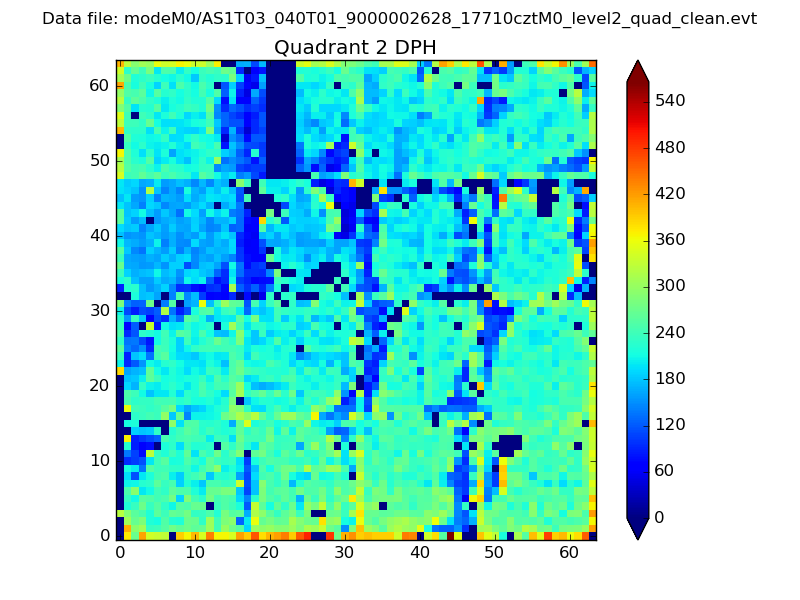
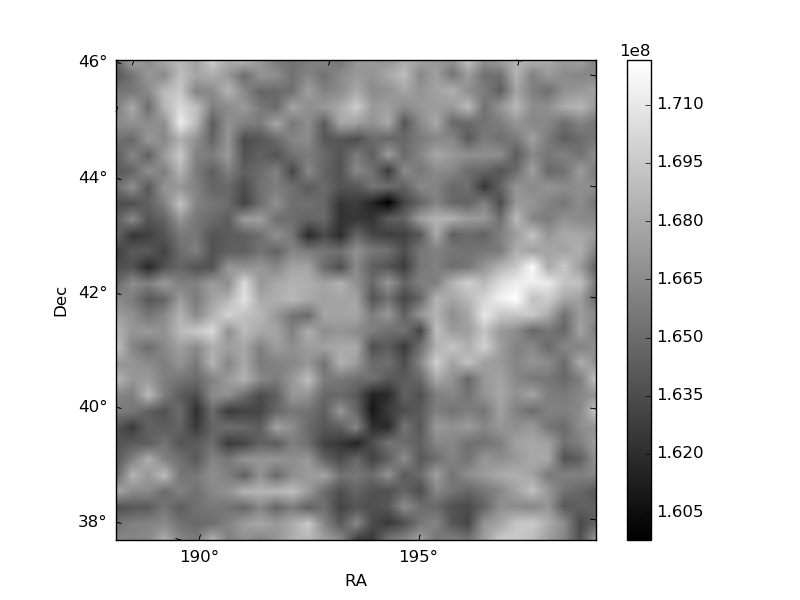
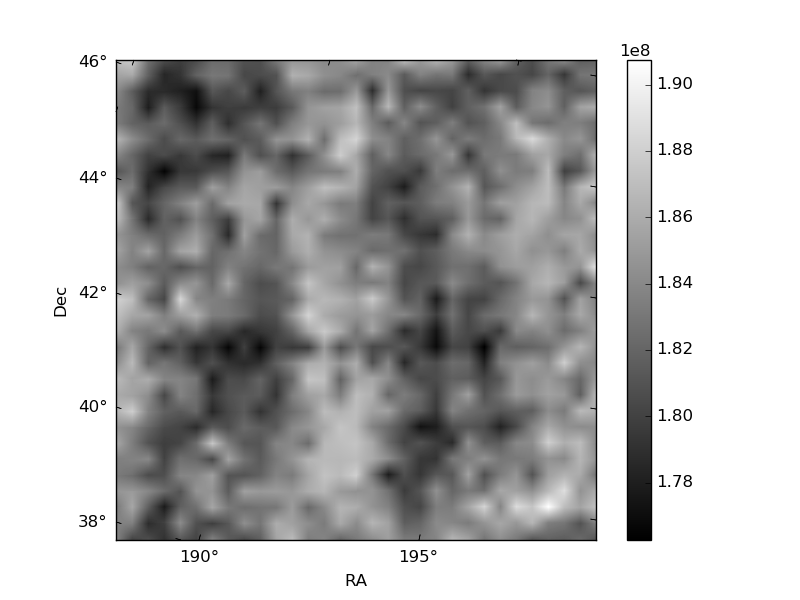
Histogram calculated using DETX and DETY for each event in the final _common_clean file
| Quadrant A | 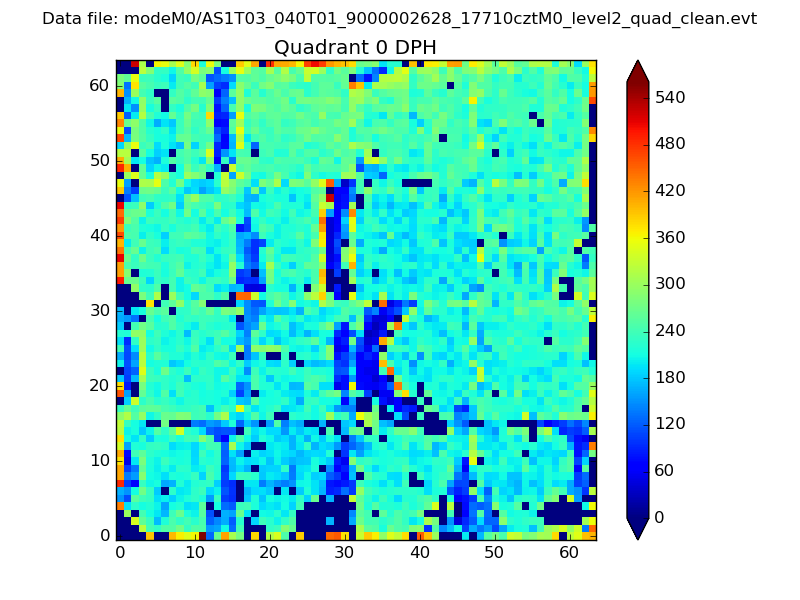 |
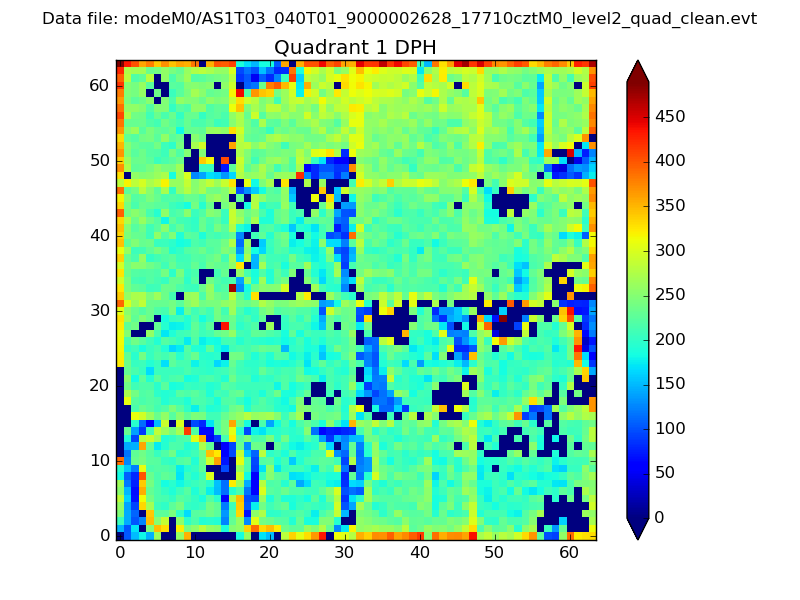 |
Quadrant B |
|---|---|---|---|
| Quadrant D | 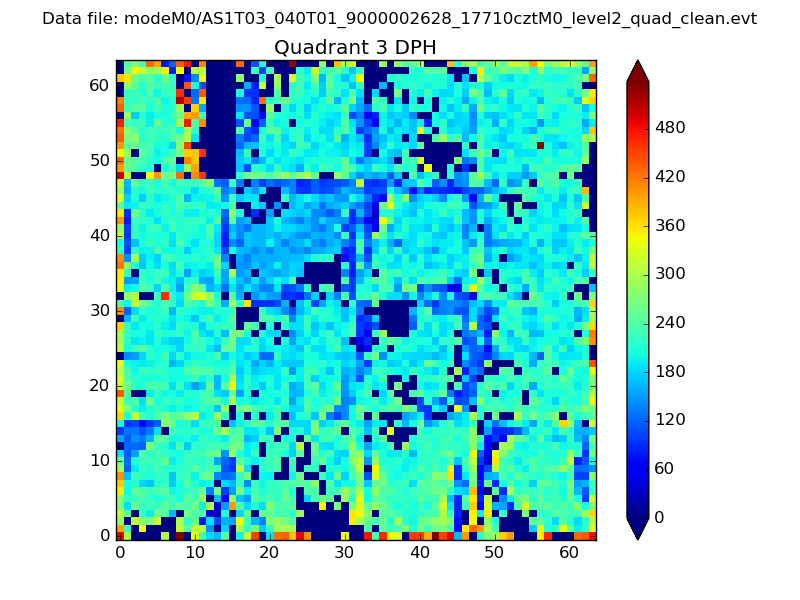 |
 |
Quadrant C |
| Plot type | Count rate plots | Images |
|---|---|---|
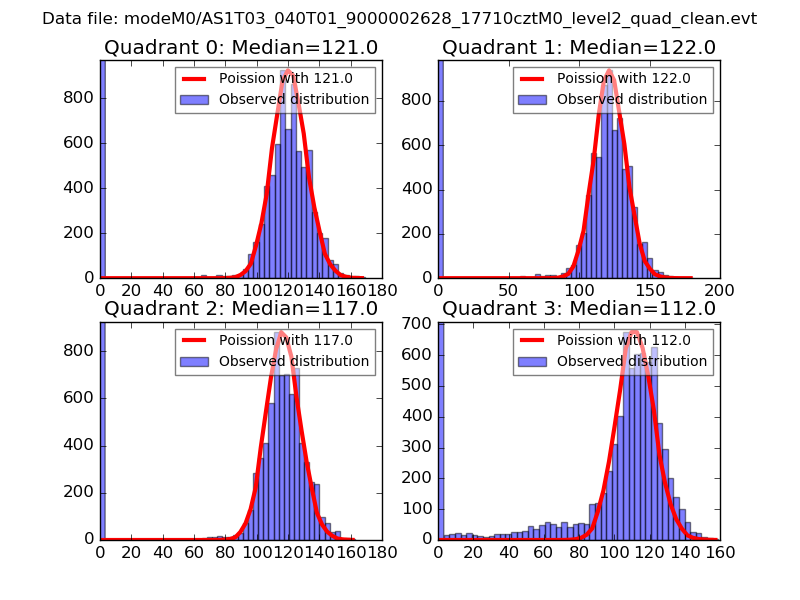
| Comparison with Poisson distribution Blue bars denote a histogram of data divided into 1 sec bins. Red curve is a Poisson curve with rate = median count rate of data. |
 |
 |
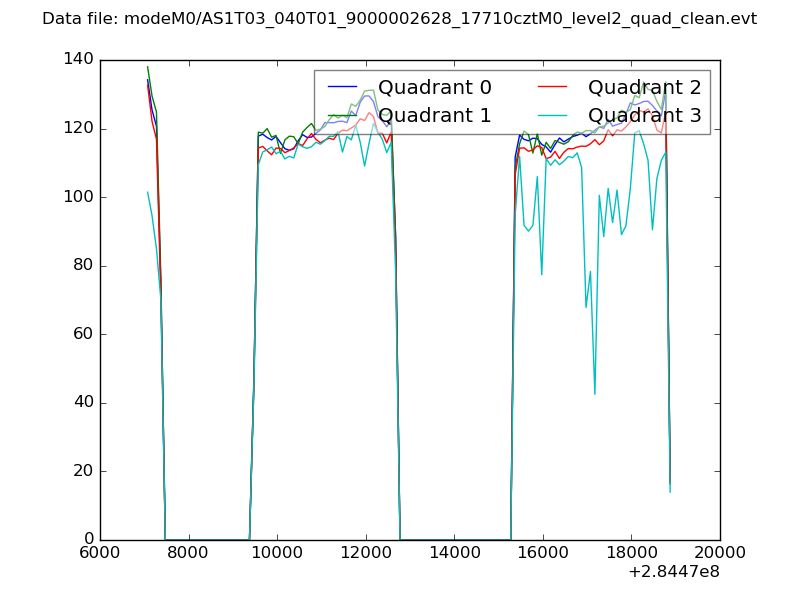
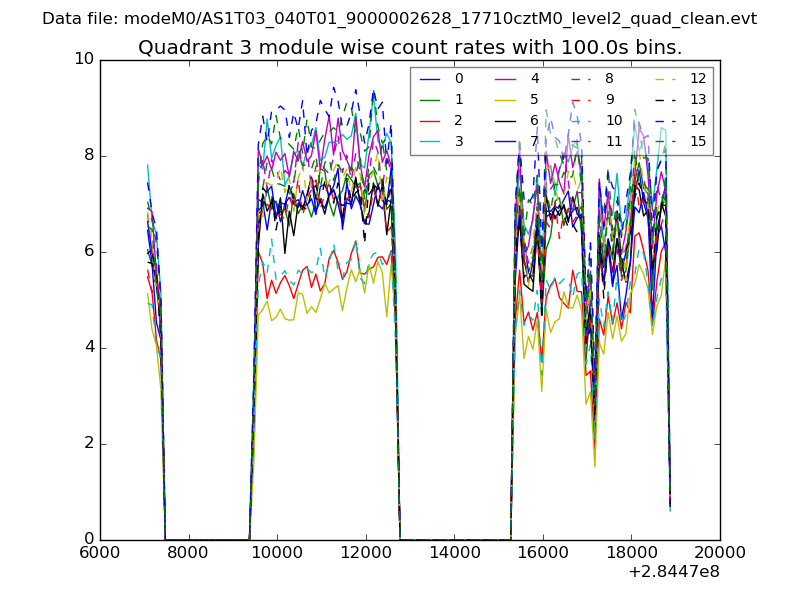
| Quadrant-wise count rates Data is divided into 100 sec bins |
 |
|
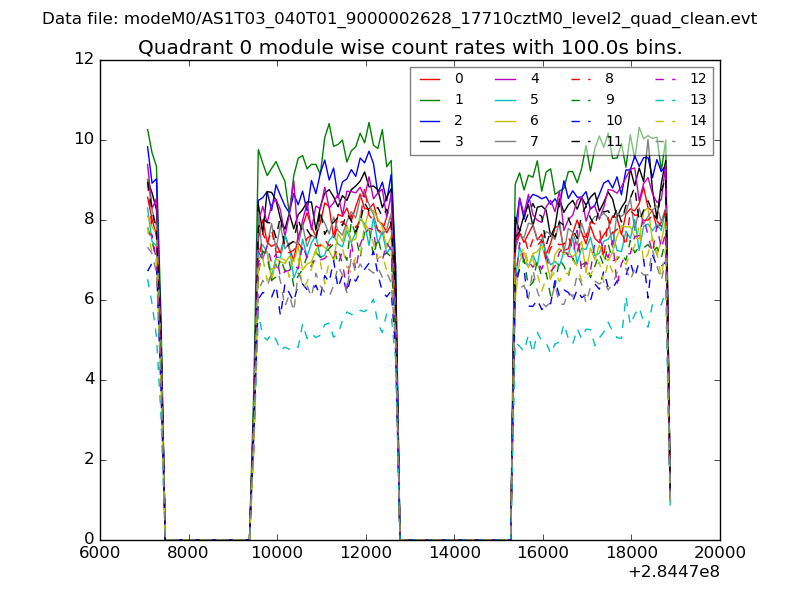
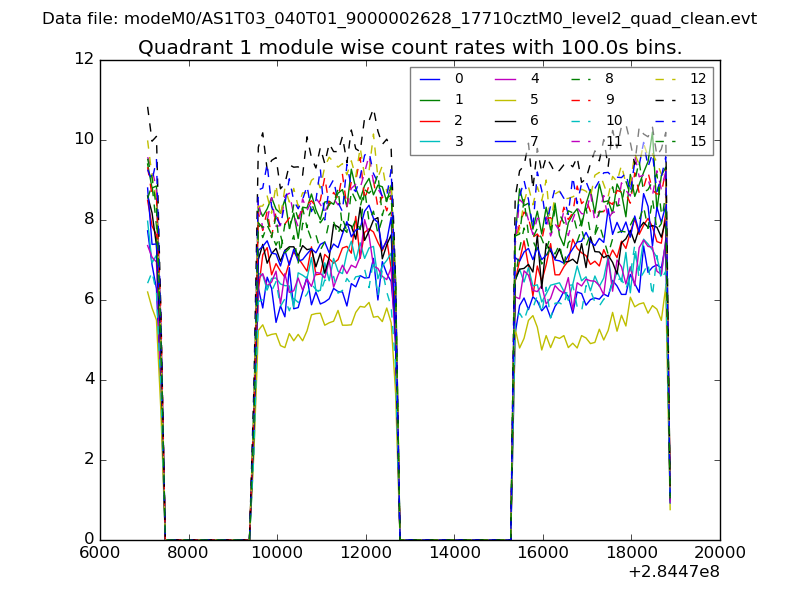
| Module-wise count rates for Quadrant A Data is divided into 100 sec bins |
 |
 |
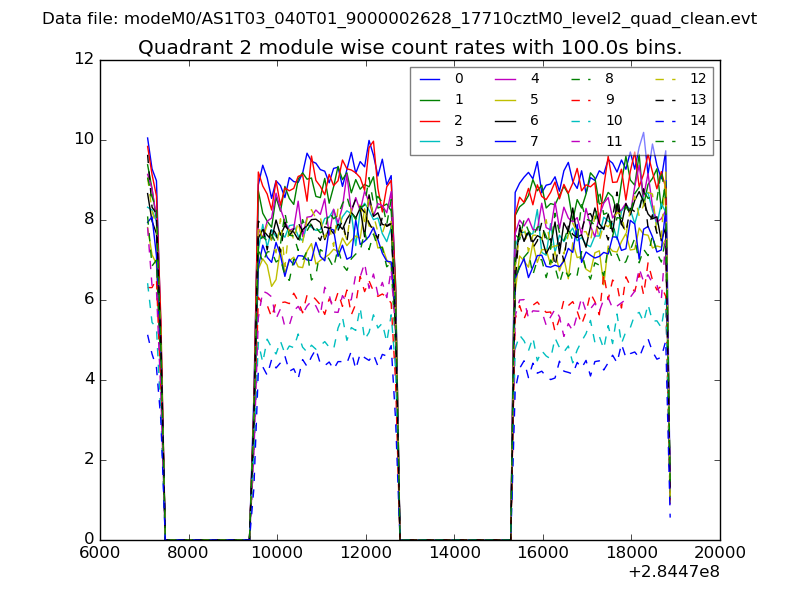
| Module-wise count rates for Quadrant B Data is divided into 100 sec bins |
 |
 |
| Module-wise count rates for Quadrant C Data is divided into 100 sec bins |
 |
 |
| Module-wise count rates for Quadrant D Data is divided into 100 sec bins |
 |
 |
| Parameter | Plot |
|---|---|
| CZT HV Monitor | 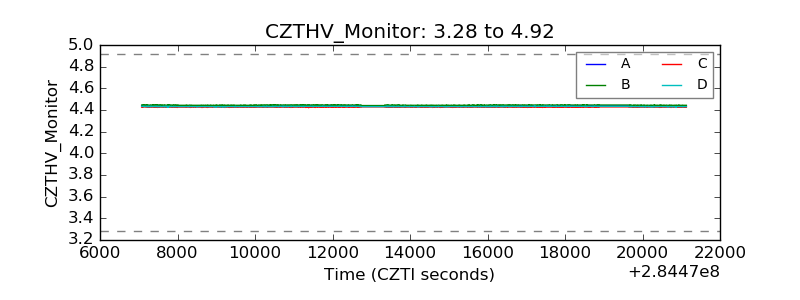 |
| D_VDD | 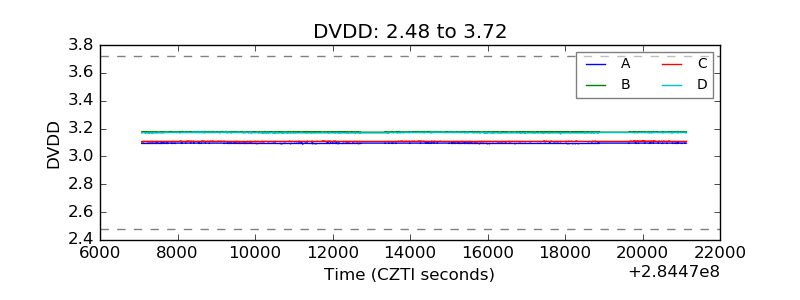 |
| Temperature 1 | 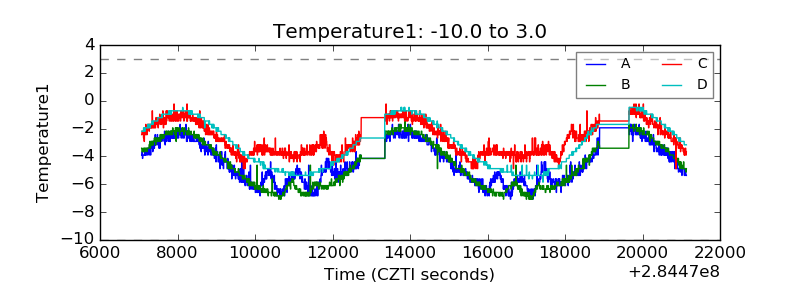 |
| Veto HV Monitor | 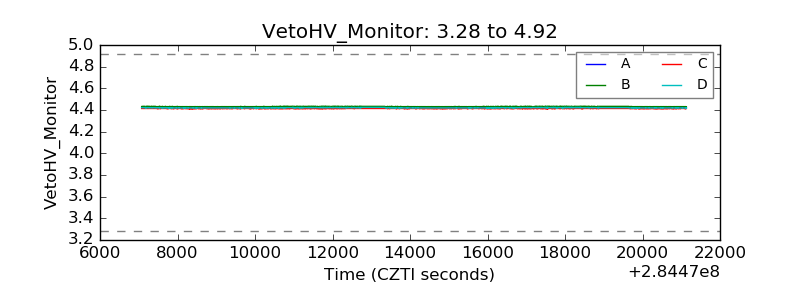 |
| Veto LLD | 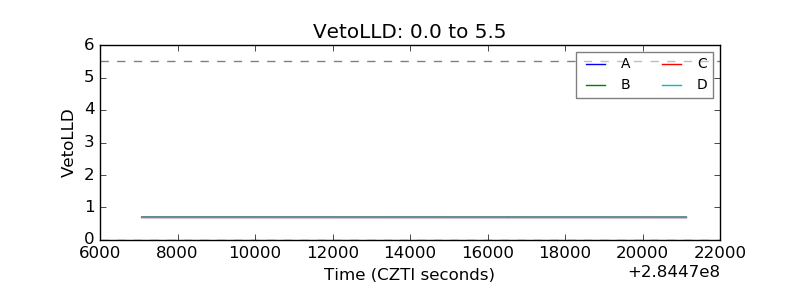 |
| Alpha Counter | 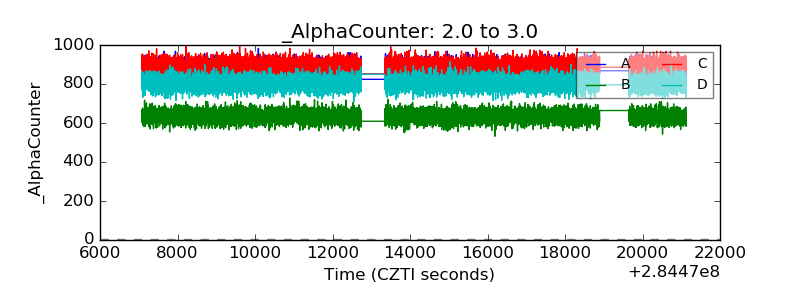 |
| _CPM_Rate | 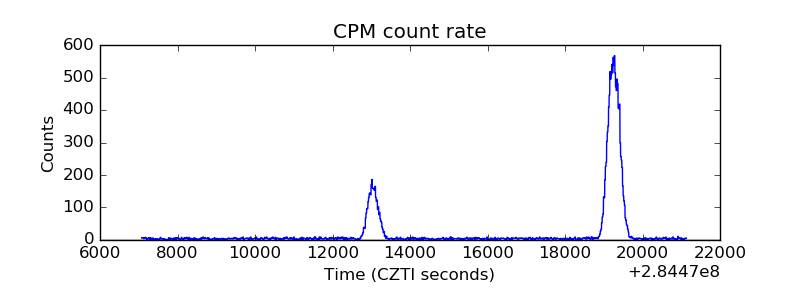 |
| CZT Counter | 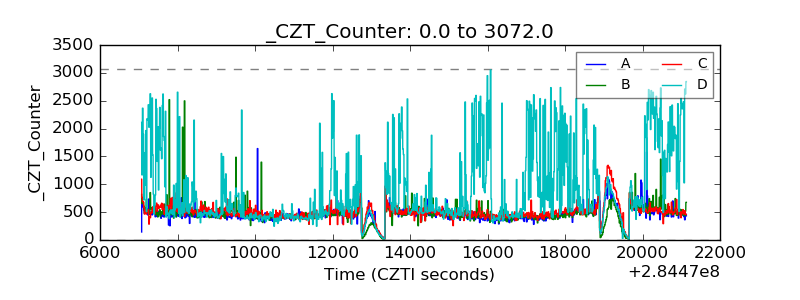 |
| +2.5 Volts monitor |  |
| +5 Volts monitor |  |
| _ROLL_ROT | 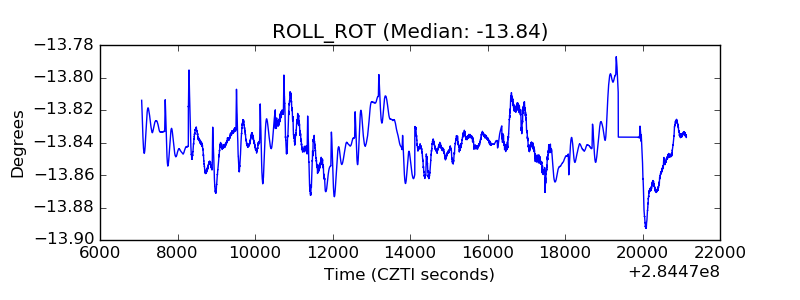 |
| _Roll_DEC | 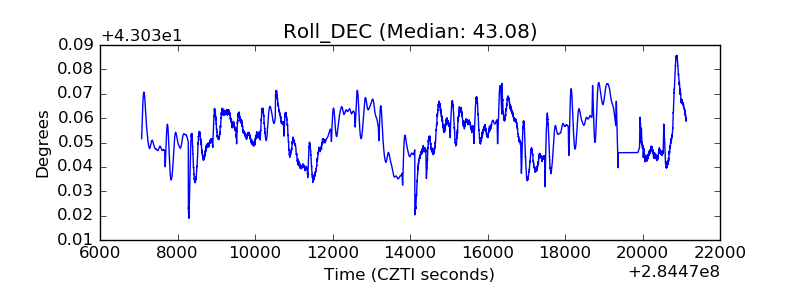 |
| _Roll_RA | 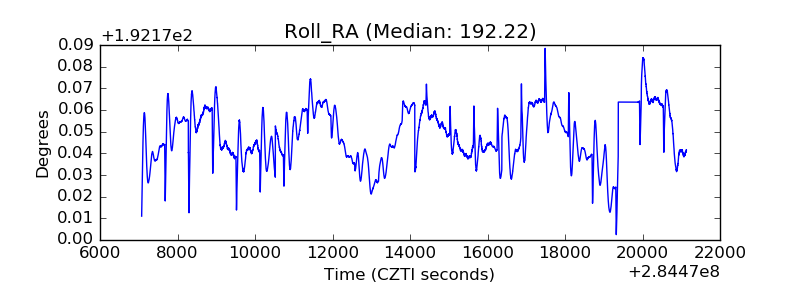 |
| Veto Counter | 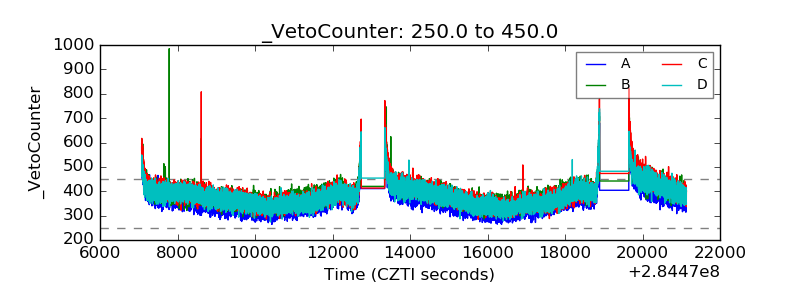 |