| Param | Original file | Final file |
|---|---|---|
| Filename | modeM0/AS1T03_042T01_9000002630cztM0_level2.fits | modeM0/AS1T03_042T01_9000002630cztM0_level2_quad_clean.evt |
| Size (bytes) | 1,125,198,720 | 1,083,867,840 |
| Size | 1.0 GB | 1.0 GB |
| Events in quadrant A | 6,963,282 | 6,600,075 |
| Events in quadrant B | 6,801,066 | 6,736,012 |
| Events in quadrant C | 6,902,496 | 6,380,635 |
| Events in quadrant D | 5,217,310 | 4,927,667 |
| Mode M9 | |||
|---|---|---|---|
| Quadrant | BADHDUFLAG | Total packets | Discarded packets |
| A | 0 | 204 | 0 |
| B | 0 | 204 | 0 |
| C | 0 | 204 | 0 |
| D | 0 | 204 | 0 |
| Mode M0 | |||
|---|---|---|---|
| Quadrant | BADHDUFLAG | Total packets | Discarded packets |
| A | 0 | 256778 | 0 |
| B | 0 | 250071 | 0 |
| C | 0 | 249347 | 0 |
| D | 0 | 451565 | 0 |
| Mode SS | |||
|---|---|---|---|
| Quadrant | BADHDUFLAG | Total packets | Discarded packets |
| A | 0 | 2434 | 0 |
| B | 0 | 2434 | 0 |
| C | 0 | 2434 | 0 |
| D | 0 | 2434 | 0 |
| Quadrant | Total seconds | Saturated seconds | Saturation percentage |
|---|---|---|---|
| A | 119390 | 2100 | 1.758941% |
| B | 119390 | 1469 | 1.230421% |
| C | 119390 | 1736 | 1.454058% |
| D | 119390 | 24702 | 20.690175% |
Noise dominated data is calculated using 1-second bins in cleaned event files. If a bin has >2000 counts, and if more than 50% of those come from <1% of pixels, then it is considered to be noise-dominated and hence unusable.
| Quadrant | # 1 sec bins | Bins with >0 counts | Bins with >2000 counts | High rate bins dominated by noise | Noise dominated (total time) | Noise dominated (detector-on time) | Marked lightcurve |
|---|---|---|---|---|---|---|---|
| A | 139720 | 119385 | 0 | 0 | 0.00% | 0.00% |  |
| B | 139720 | 119388 | 0 | 0 | 0.00% | 0.00% | 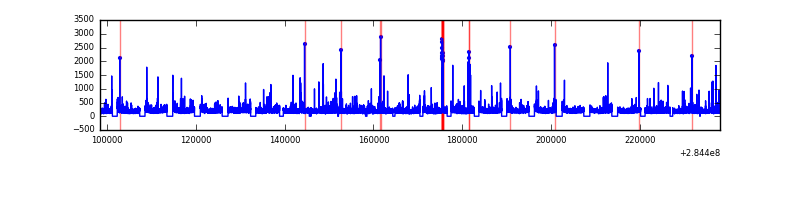 |
| C | 139720 | 119386 | 0 | 0 | 0.00% | 0.00% |  |
| D | 139720 | 118450 | 0 | 0 | 0.00% | 0.00% |  |
Top three noisy pixels from each quadrant. If the there are fewer than three noisy pixels in the level2.evt file, extra rows are filled as -1
| Pixel properties | Quadrant properties | ||||||
|---|---|---|---|---|---|---|---|
| Quadrant | DetID | PixID | Counts | Sigma | Mean | Median | Sigma |
| A | 0 | 29 | 6595 | 11.08 | 1810 | 1699 | 441.8 |
| A | 7 | 110 | 5610 | 8.85 | 1810 | 1699 | 441.8 |
| A | 9 | 19 | 5280 | 8.11 | 1810 | 1699 | 441.8 |
| B | 2 | 9 | 5715 | 11.43 | 1794 | 1709 | 350.3 |
| B | 2 | 8 | 4661 | 8.43 | 1794 | 1709 | 350.3 |
| B | 3 | 80 | 4479 | 7.91 | 1794 | 1709 | 350.3 |
| C | 1 | 80 | 5235 | 7.55 | 1822 | 1695 | 469.0 |
| C | 1 | 81 | 5159 | 7.38 | 1822 | 1695 | 469.0 |
| C | 12 | 241 | 4835 | 6.69 | 1822 | 1695 | 469.0 |
| D | 6 | 231 | 3817 | 6.23 | 1488 | 1354 | 395.2 |
| D | 3 | 14 | 3758 | 6.08 | 1488 | 1354 | 395.2 |
| D | 15 | 46 | 3707 | 5.95 | 1488 | 1354 | 395.2 |
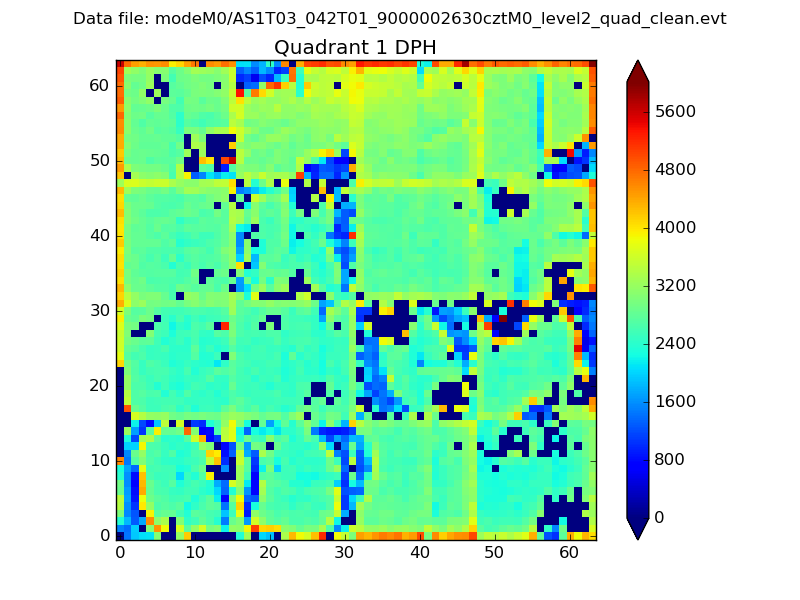
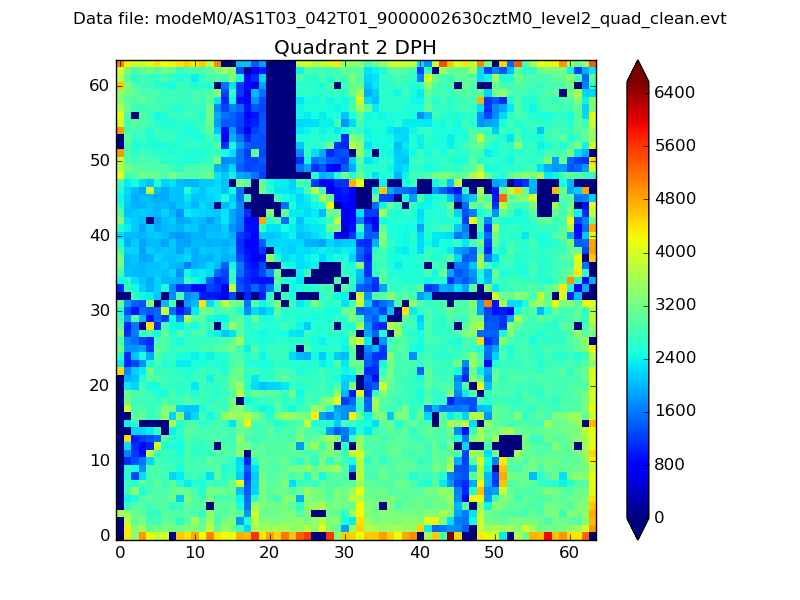
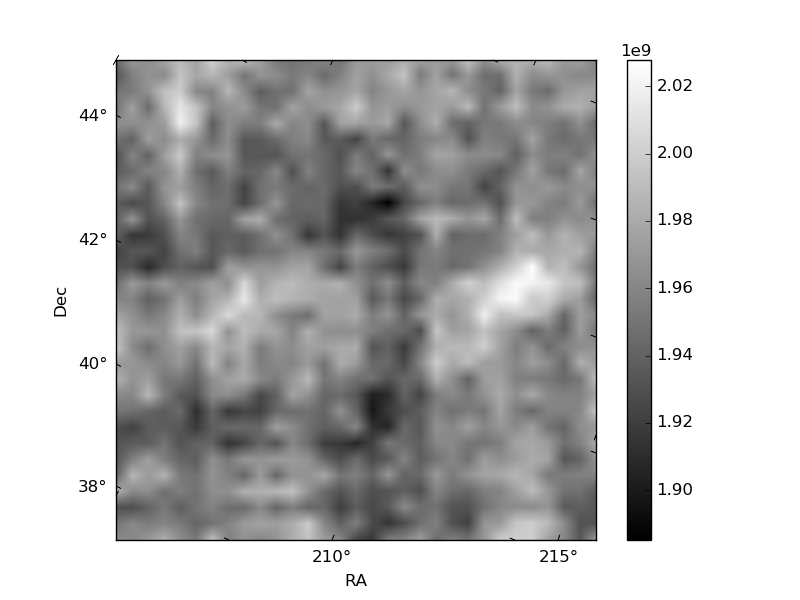
Histogram calculated using DETX and DETY for each event in the final _common_clean file
| Quadrant A |  |
 |
Quadrant B |
|---|---|---|---|
| Quadrant D |  |
 |
Quadrant C |
| Plot type | Count rate plots | Images |
|---|---|---|
| Comparison with Poisson distribution Blue bars denote a histogram of data divided into 1 sec bins. Red curve is a Poisson curve with rate = median count rate of data. |
 |
 |
| Quadrant-wise count rates Data is divided into 100 sec bins |
 |
|
| Module-wise count rates for Quadrant A Data is divided into 100 sec bins |
 |
 |
| Module-wise count rates for Quadrant B Data is divided into 100 sec bins |
 |
 |
| Module-wise count rates for Quadrant C Data is divided into 100 sec bins |
 |
 |
| Module-wise count rates for Quadrant D Data is divided into 100 sec bins |
 |
 |
| Parameter | Plot |
|---|---|
| CZT HV Monitor |  |
| D_VDD | 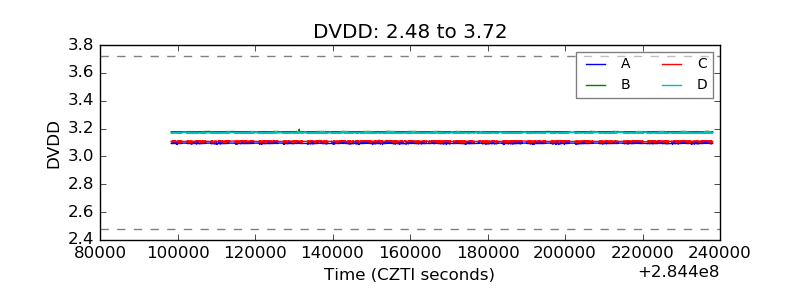 |
| Temperature 1 |  |
| Veto HV Monitor |  |
| Veto LLD |  |
| Alpha Counter |  |
| _CPM_Rate | 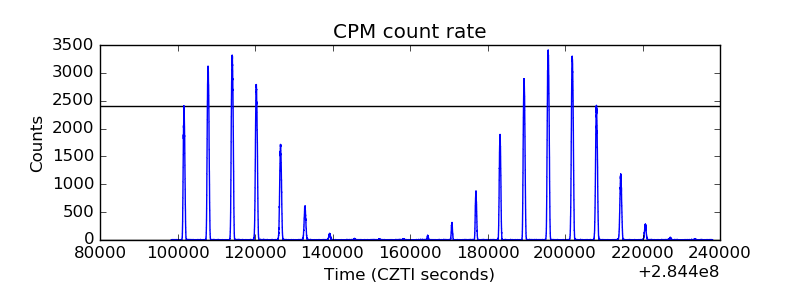 |
| CZT Counter |  |
| +2.5 Volts monitor | 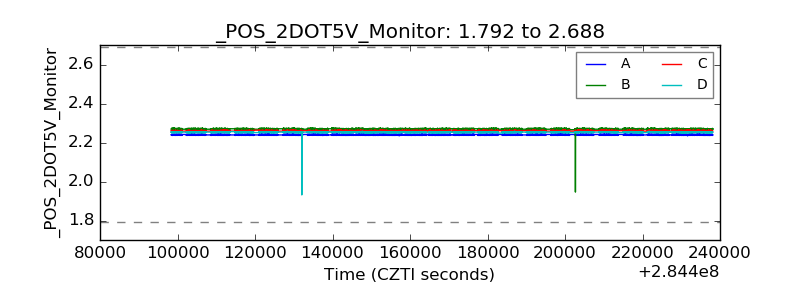 |
| +5 Volts monitor |  |
| _ROLL_ROT |  |
| _Roll_DEC |  |
| _Roll_RA | 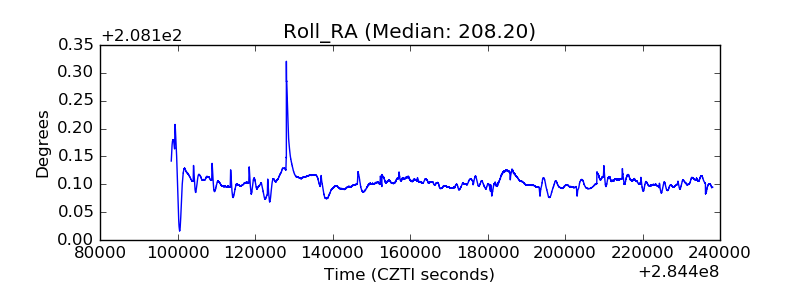 |
| Veto Counter | 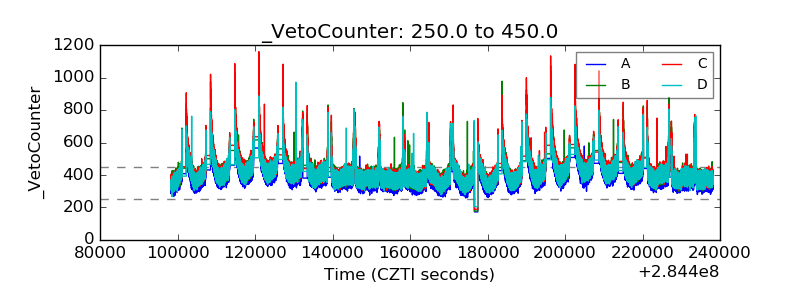 |