| Param | Original file | Final file |
|---|---|---|
| Filename | modeM0/AS1T03_042T01_9000002630_17712cztM0_level2.evt | modeM0/AS1T03_042T01_9000002630_17712cztM0_level2_quad_clean.evt |
| Size (bytes) | 448,655,040 | 55,520,640 |
| Size | 427.9 MB | 52.9 MB |
| Events in quadrant A | 1,915,612 | 379,246 |
| Events in quadrant B | 2,003,063 | 386,352 |
| Events in quadrant C | 1,965,827 | 373,735 |
| Events in quadrant D | 7,427,953 | 255,960 |
| Mode M9 | |||
|---|---|---|---|
| Quadrant | BADHDUFLAG | Total packets | Discarded packets |
| A | 0 | 11 | 0 |
| B | 0 | 11 | 0 |
| C | 0 | 11 | 0 |
| D | 0 | 11 | 0 |
| Mode M0 | |||
|---|---|---|---|
| Quadrant | BADHDUFLAG | Total packets | Discarded packets |
| A | 0 | 8430 | 1 |
| B | 0 | 8709 | 1 |
| C | 0 | 8563 | 1 |
| D | 0 | 24835 | 4 |
| Mode SS | |||
|---|---|---|---|
| Quadrant | BADHDUFLAG | Total packets | Discarded packets |
| A | 0 | 82 | 0 |
| B | 0 | 82 | 0 |
| C | 0 | 82 | 0 |
| D | 0 | 82 | 0 |
| Quadrant | Total seconds | Saturated seconds | Saturation percentage |
|---|---|---|---|
| A | 4045 | 20 | 0.494438% |
| B | 4045 | 30 | 0.741656% |
| C | 4045 | 37 | 0.914710% |
| D | 4044 | 2189 | 54.129575% |
Noise dominated data is calculated using 1-second bins in cleaned event files. If a bin has >2000 counts, and if more than 50% of those come from <1% of pixels, then it is considered to be noise-dominated and hence unusable.
| Quadrant | # 1 sec bins | Bins with >0 counts | Bins with >2000 counts | High rate bins dominated by noise | Noise dominated (total time) | Noise dominated (detector-on time) | Marked lightcurve |
|---|---|---|---|---|---|---|---|
| A | 5150 | 4046 | 1 | 1 | 0.02% | 0.02% |  |
| B | 5150 | 4046 | 2 | 2 | 0.04% | 0.05% | 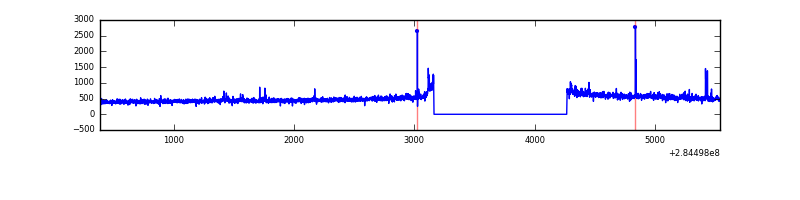 |
| C | 5150 | 4046 | 0 | 0 | 0.00% | 0.00% | 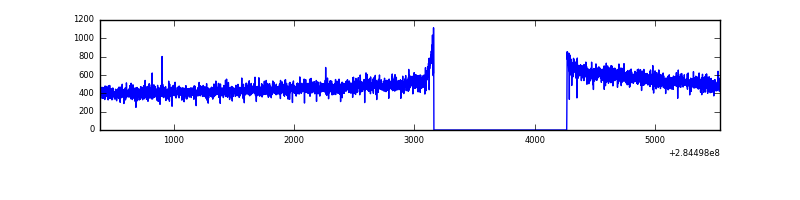 |
| D | 5149 | 4045 | 1926 | 1926 | 37.41% | 47.61% | 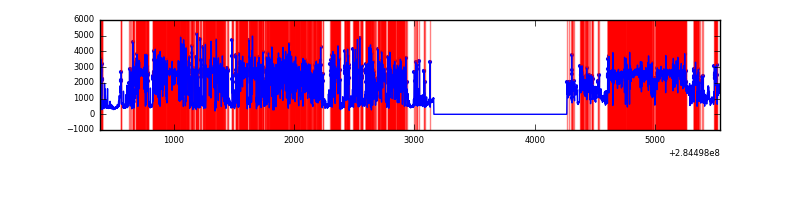 |
Top three noisy pixels from each quadrant. If the there are fewer than three noisy pixels in the level2.evt file, extra rows are filled as -1
| Pixel properties | Quadrant properties | ||||||
|---|---|---|---|---|---|---|---|
| Quadrant | DetID | PixID | Counts | Sigma | Mean | Median | Sigma |
| A | 15 | 174 | 8681 | 81.09 | 495 | 484 | 101.1 |
| A | 0 | 226 | 4455 | 39.28 | 495 | 484 | 101.1 |
| A | 3 | 137 | 3703 | 31.84 | 495 | 484 | 101.1 |
| B | 10 | 245 | 35041 | 362.63 | 493 | 481 | 95.3 |
| B | 0 | 189 | 21131 | 216.68 | 493 | 481 | 95.3 |
| B | 12 | 111 | 11288 | 113.4 | 493 | 481 | 95.3 |
| C | 14 | 238 | 74566 | 655.46 | 477 | 480 | 113.0 |
| C | 5 | 218 | 21884 | 189.37 | 477 | 480 | 113.0 |
| C | 13 | 61 | 3453 | 26.3 | 477 | 480 | 113.0 |
| D | 7 | 238 | 6055615 | 69650.58 | 351 | 340 | 86.9 |
| D | 2 | 234 | 11980 | 133.89 | 351 | 340 | 86.9 |
| D | 10 | 70 | 8986 | 99.45 | 351 | 340 | 86.9 |
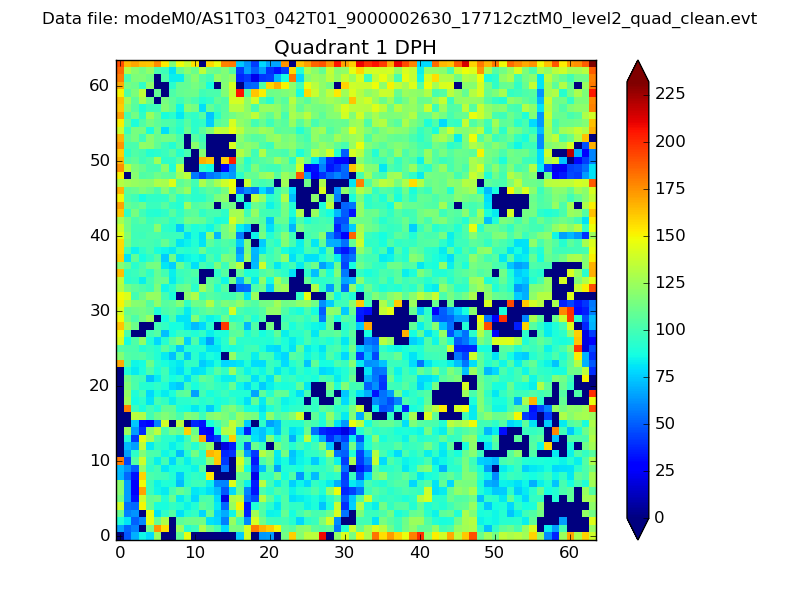
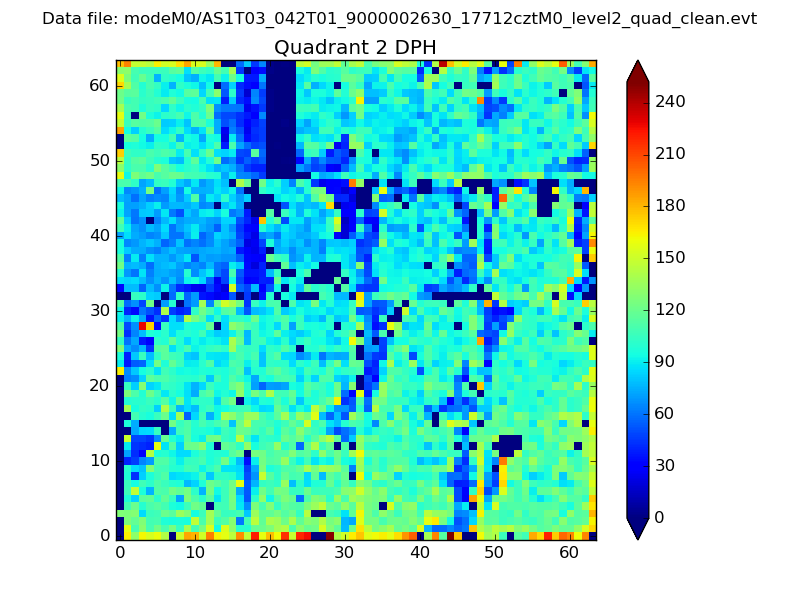
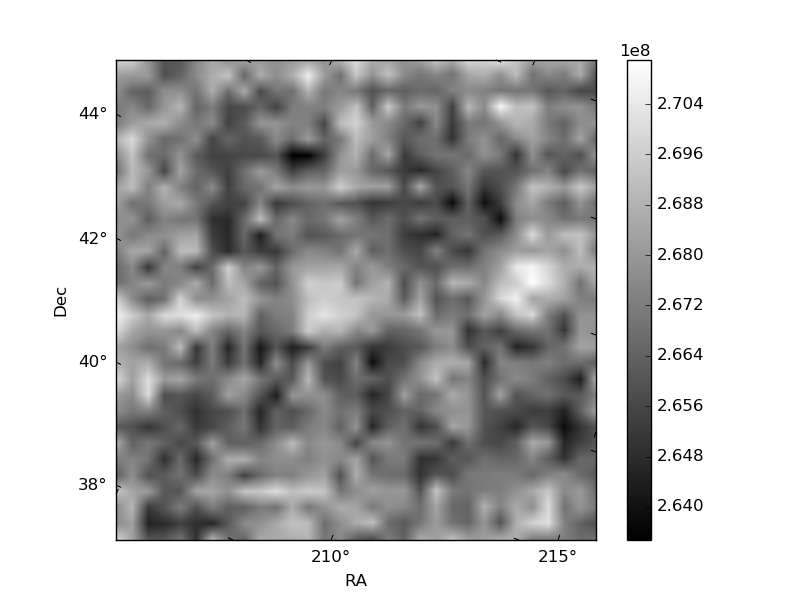
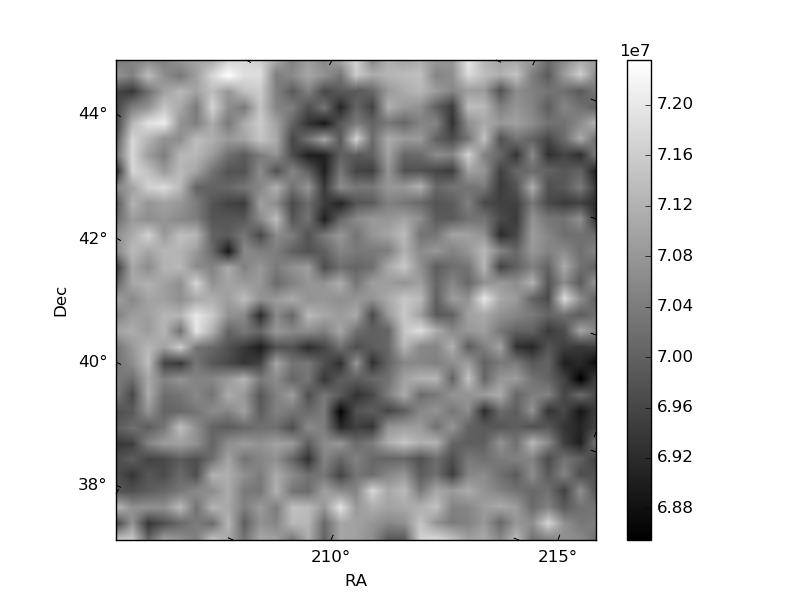
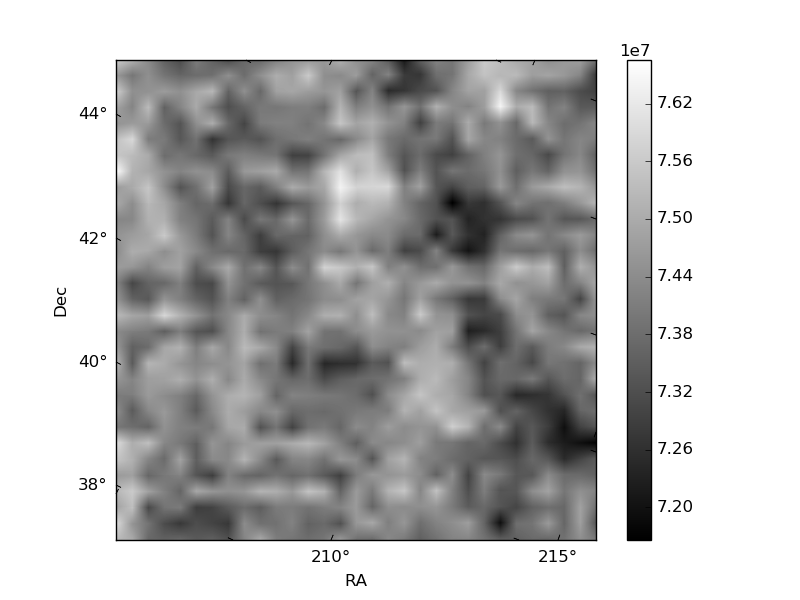
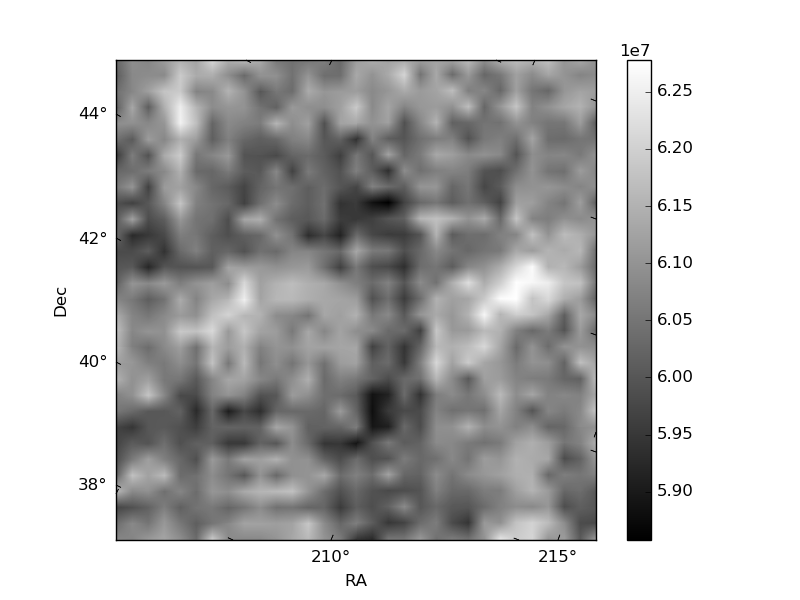
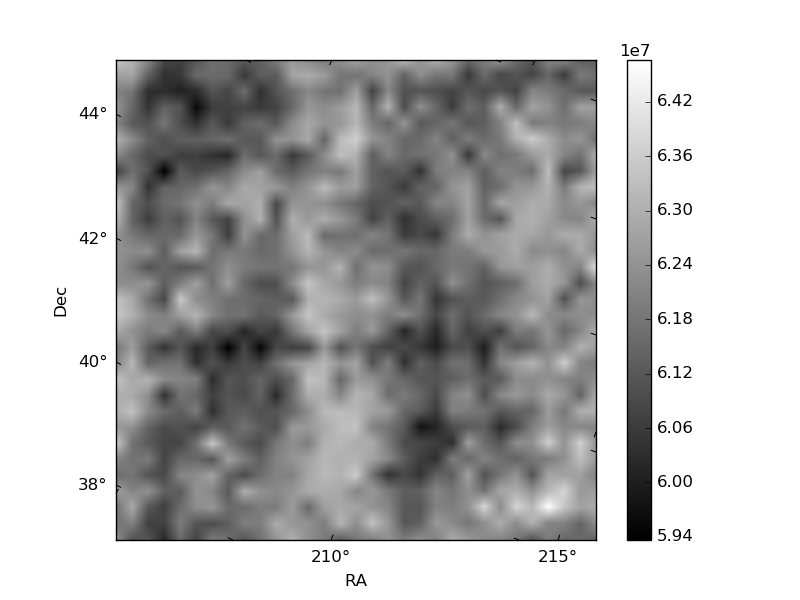
Histogram calculated using DETX and DETY for each event in the final _common_clean file
| Quadrant A | 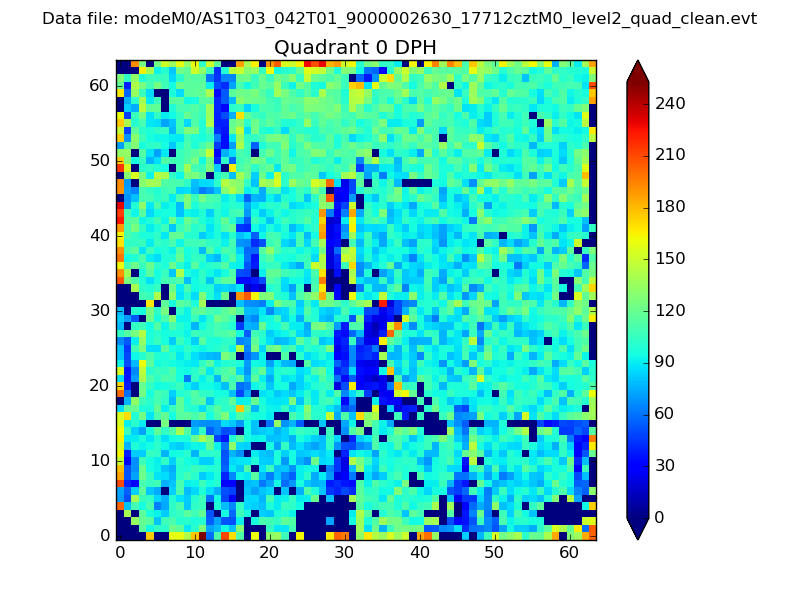 |
 |
Quadrant B |
|---|---|---|---|
| Quadrant D | 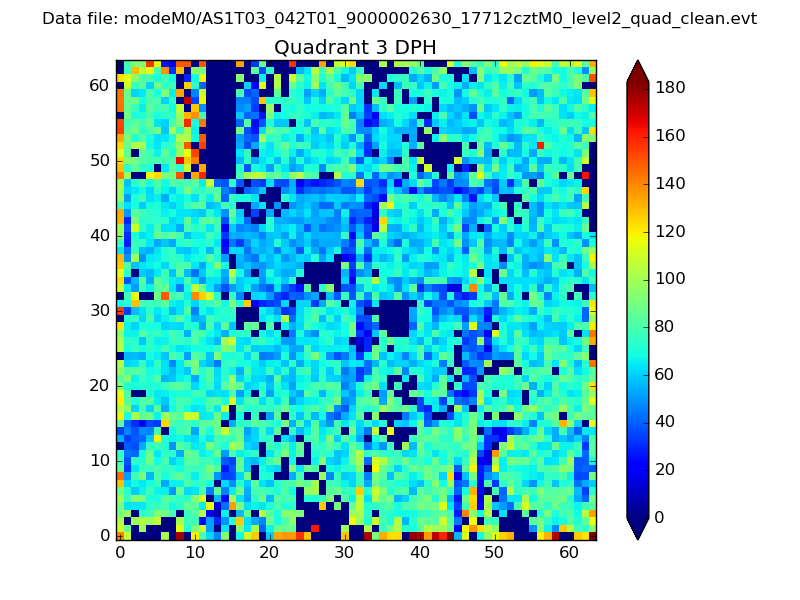 |
 |
Quadrant C |
| Plot type | Count rate plots | Images |
|---|---|---|
| Comparison with Poisson distribution Blue bars denote a histogram of data divided into 1 sec bins. Red curve is a Poisson curve with rate = median count rate of data. |
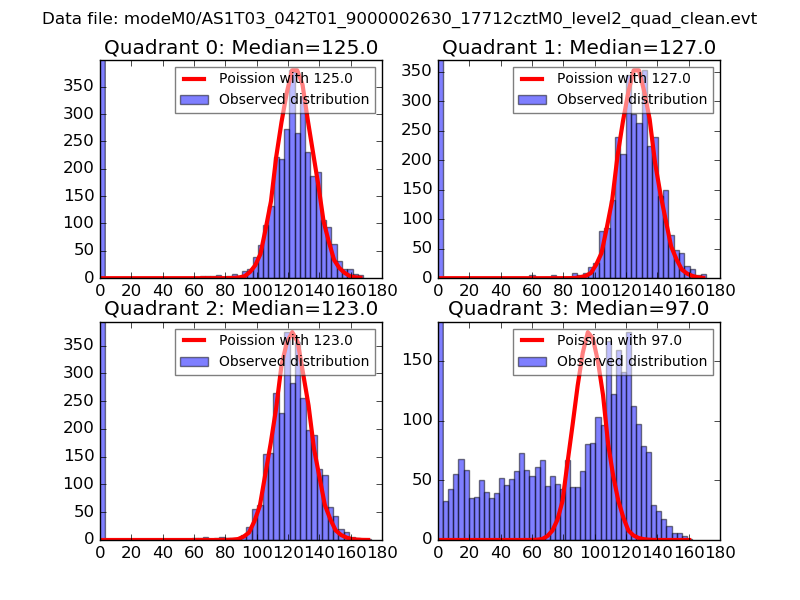 |
 |
| Quadrant-wise count rates Data is divided into 100 sec bins |
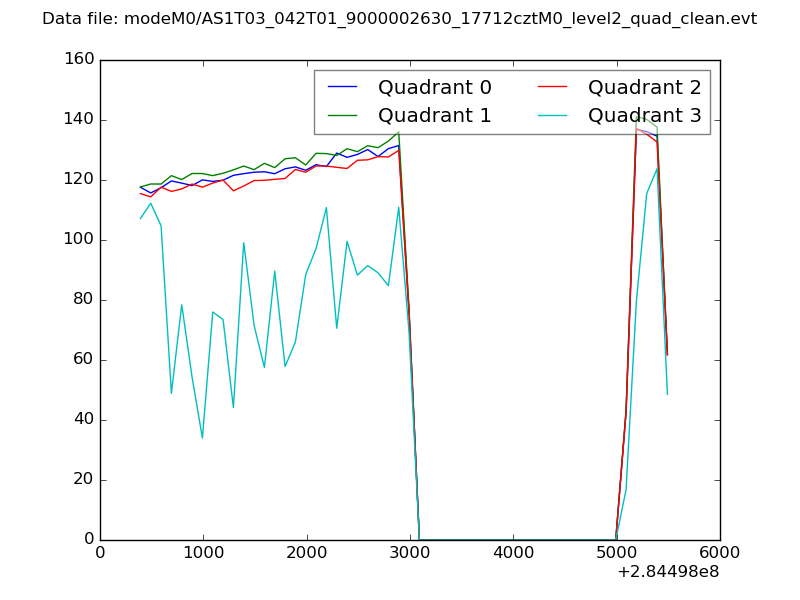 |
|
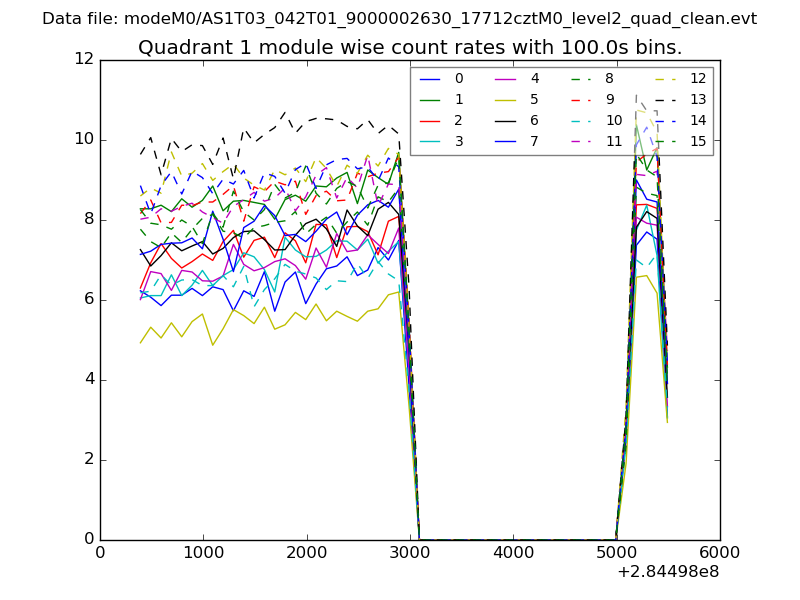
| Module-wise count rates for Quadrant A Data is divided into 100 sec bins |
 |
 |
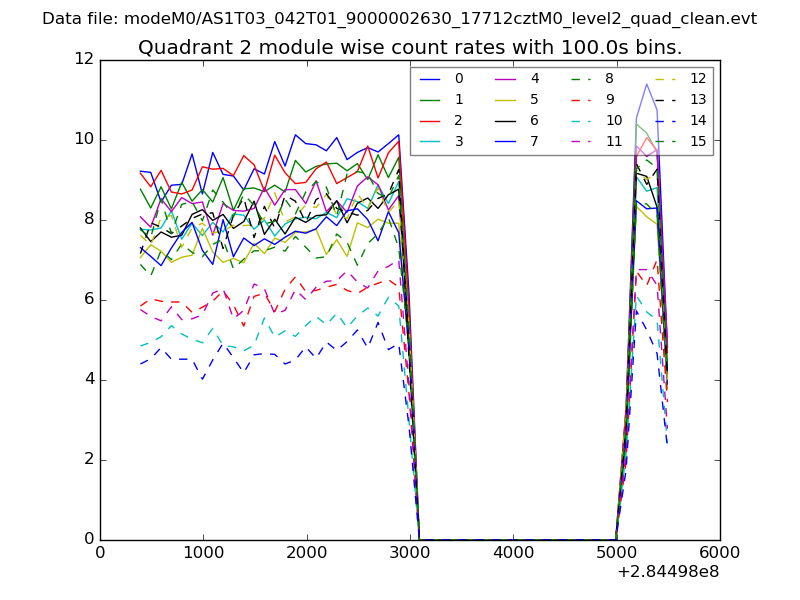
| Module-wise count rates for Quadrant B Data is divided into 100 sec bins |
 |
 |
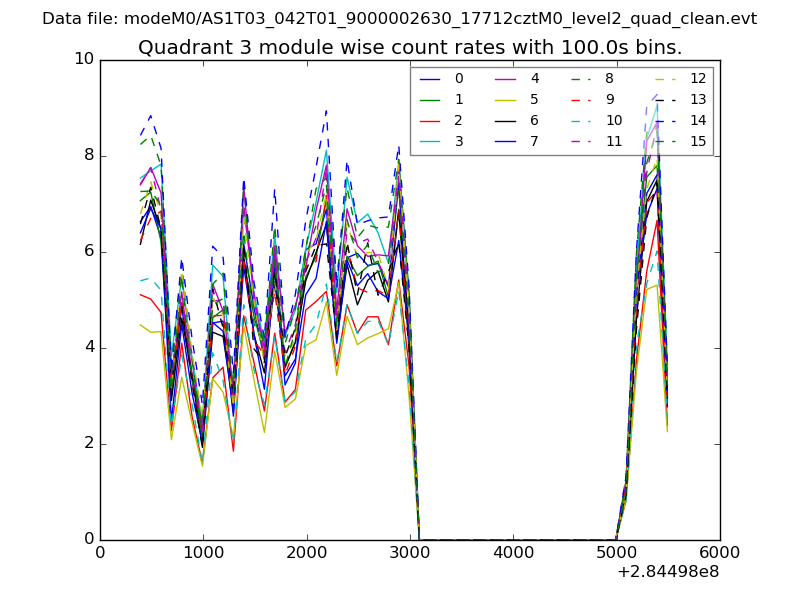
| Module-wise count rates for Quadrant C Data is divided into 100 sec bins |
 |
 |
| Module-wise count rates for Quadrant D Data is divided into 100 sec bins |
 |
 |
| Parameter | Plot |
|---|---|
| CZT HV Monitor | 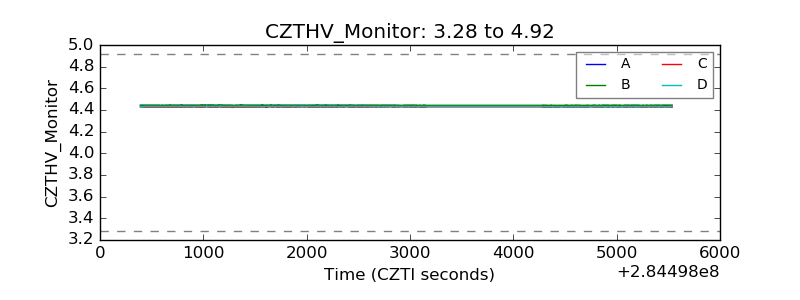 |
| D_VDD |  |
| Temperature 1 | 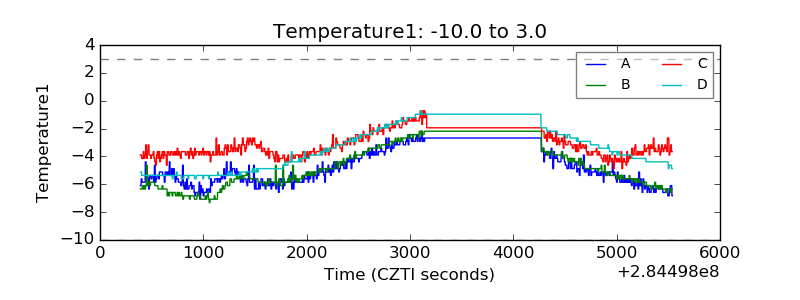 |
| Veto HV Monitor | 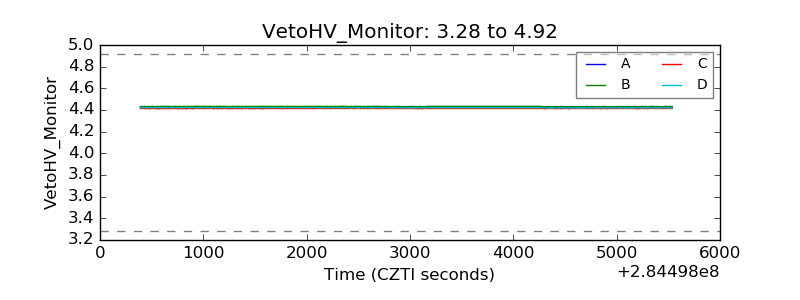 |
| Veto LLD | 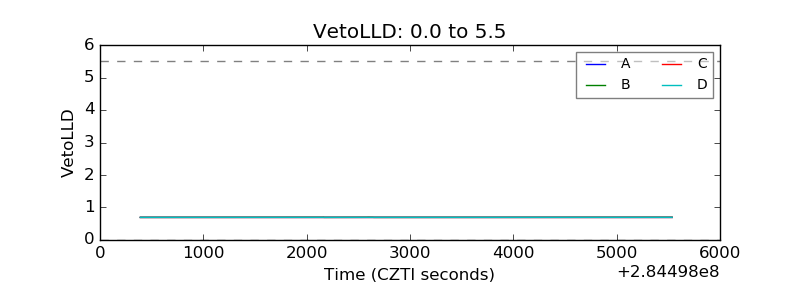 |
| Alpha Counter | 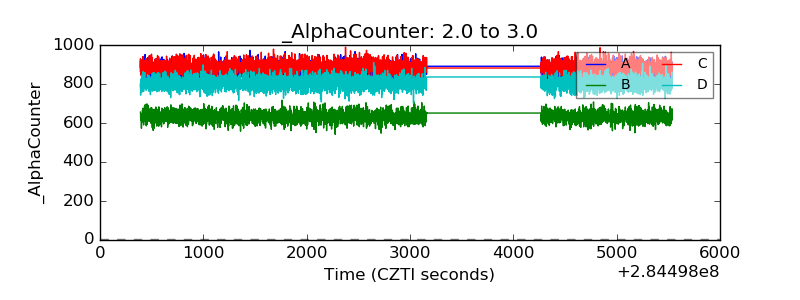 |
| _CPM_Rate | 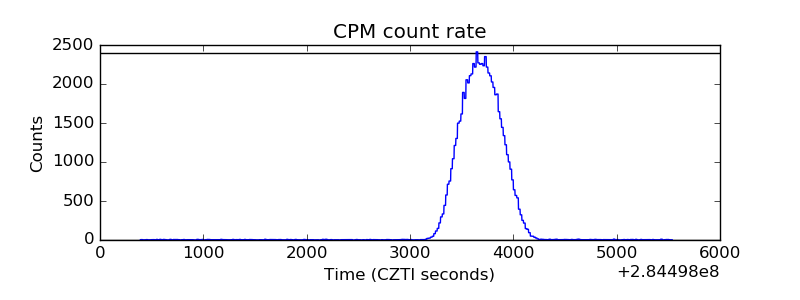 |
| CZT Counter | 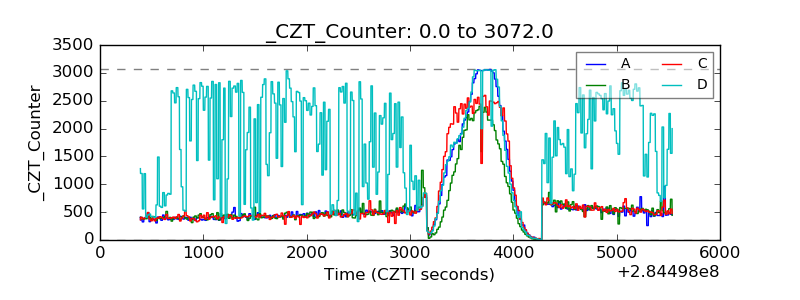 |
| +2.5 Volts monitor |  |
| +5 Volts monitor |  |
| _ROLL_ROT | 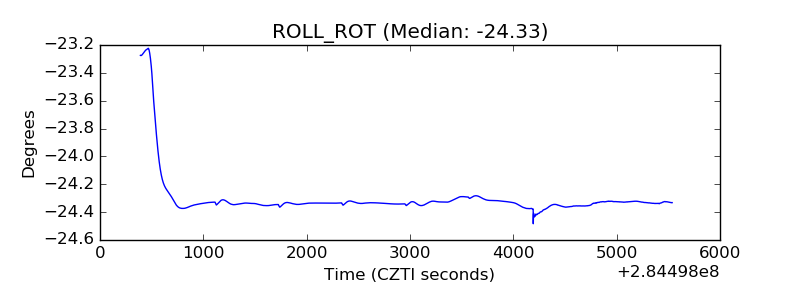 |
| _Roll_DEC | 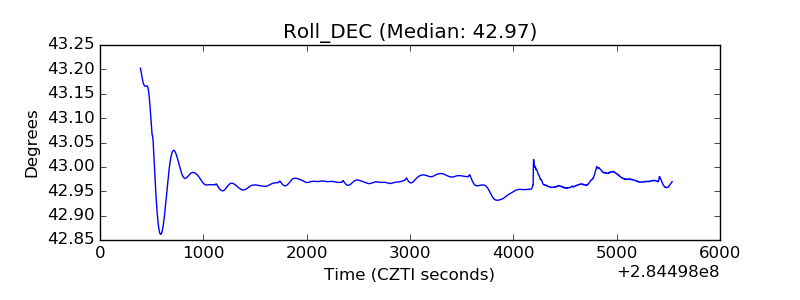 |
| _Roll_RA | 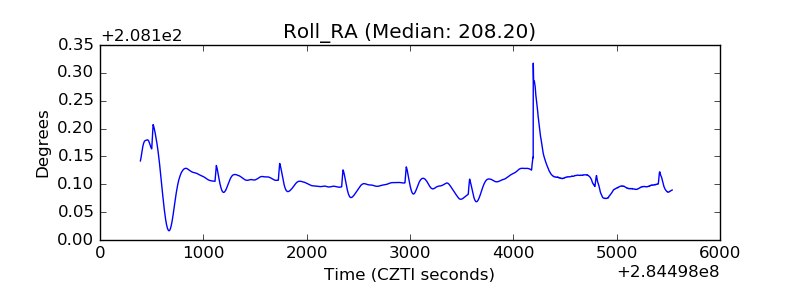 |
| Veto Counter | 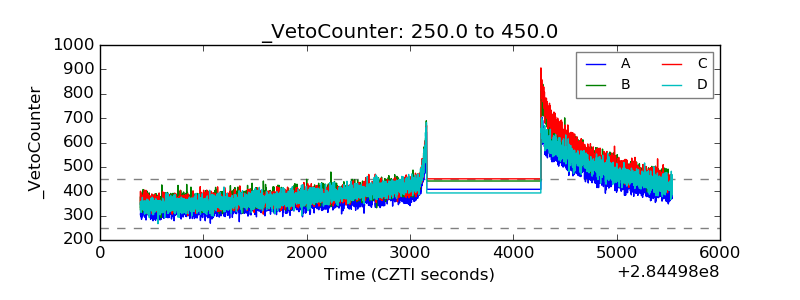 |