| Param | Original file | Final file |
|---|---|---|
| Filename | modeM0/AS1T03_042T01_9000002630_17714cztM0_level2.evt | modeM0/AS1T03_042T01_9000002630_17714cztM0_level2_quad_clean.evt |
| Size (bytes) | 741,237,120 | 85,832,640 |
| Size | 706.9 MB | 81.9 MB |
| Events in quadrant A | 3,589,270 | 578,313 |
| Events in quadrant B | 3,169,510 | 605,650 |
| Events in quadrant C | 3,168,049 | 582,780 |
| Events in quadrant D | 12,092,104 | 388,470 |
| Mode M9 | |||
|---|---|---|---|
| Quadrant | BADHDUFLAG | Total packets | Discarded packets |
| A | 0 | 12 | 0 |
| B | 0 | 12 | 0 |
| C | 0 | 12 | 0 |
| D | 0 | 12 | 0 |
| Mode M0 | |||
|---|---|---|---|
| Quadrant | BADHDUFLAG | Total packets | Discarded packets |
| A | 0 | 14876 | 2 |
| B | 0 | 13696 | 2 |
| C | 0 | 13614 | 2 |
| D | 0 | 40361 | 2 |
| Mode SS | |||
|---|---|---|---|
| Quadrant | BADHDUFLAG | Total packets | Discarded packets |
| A | 0 | 130 | 0 |
| B | 0 | 130 | 0 |
| C | 0 | 130 | 0 |
| D | 0 | 130 | 0 |
| Quadrant | Total seconds | Saturated seconds | Saturation percentage |
|---|---|---|---|
| A | 6341 | 205 | 3.232929% |
| B | 6342 | 42 | 0.662252% |
| C | 6342 | 65 | 1.024913% |
| D | 6342 | 3604 | 56.827499% |
Noise dominated data is calculated using 1-second bins in cleaned event files. If a bin has >2000 counts, and if more than 50% of those come from <1% of pixels, then it is considered to be noise-dominated and hence unusable.
| Quadrant | # 1 sec bins | Bins with >0 counts | Bins with >2000 counts | High rate bins dominated by noise | Noise dominated (total time) | Noise dominated (detector-on time) | Marked lightcurve |
|---|---|---|---|---|---|---|---|
| A | 7546 | 6342 | 156 | 156 | 2.07% | 2.46% | 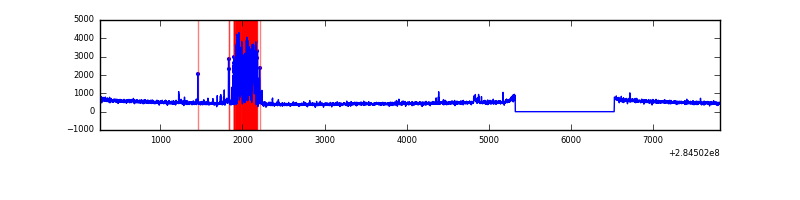 |
| B | 7547 | 6343 | 2 | 2 | 0.03% | 0.03% | 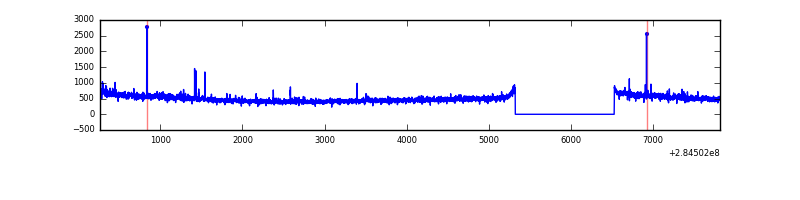 |
| C | 7547 | 6343 | 0 | 0 | 0.00% | 0.00% |  |
| D | 7547 | 6342 | 3218 | 3218 | 42.64% | 50.74% | 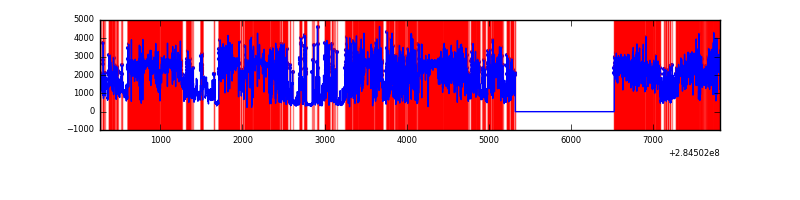 |
Top three noisy pixels from each quadrant. If the there are fewer than three noisy pixels in the level2.evt file, extra rows are filled as -1
| Pixel properties | Quadrant properties | ||||||
|---|---|---|---|---|---|---|---|
| Quadrant | DetID | PixID | Counts | Sigma | Mean | Median | Sigma |
| A | 15 | 174 | 570428 | 3639.15 | 781 | 764 | 156.5 |
| A | 4 | 2 | 12491 | 74.91 | 781 | 764 | 156.5 |
| A | 0 | 226 | 6918 | 39.31 | 781 | 764 | 156.5 |
| B | 0 | 189 | 30554 | 199.47 | 794 | 773 | 149.3 |
| B | 10 | 245 | 20786 | 134.05 | 794 | 773 | 149.3 |
| B | 12 | 111 | 17796 | 114.02 | 794 | 773 | 149.3 |
| C | 14 | 238 | 120842 | 667.52 | 769 | 773 | 179.9 |
| C | 5 | 218 | 38995 | 212.49 | 769 | 773 | 179.9 |
| C | 13 | 61 | 5459 | 26.05 | 769 | 773 | 179.9 |
| D | 7 | 238 | 9789788 | 72853.42 | 548 | 530 | 134.4 |
| D | 13 | 232 | 163403 | 1212.13 | 548 | 530 | 134.4 |
| D | 1 | 52 | 36154 | 265.12 | 548 | 530 | 134.4 |
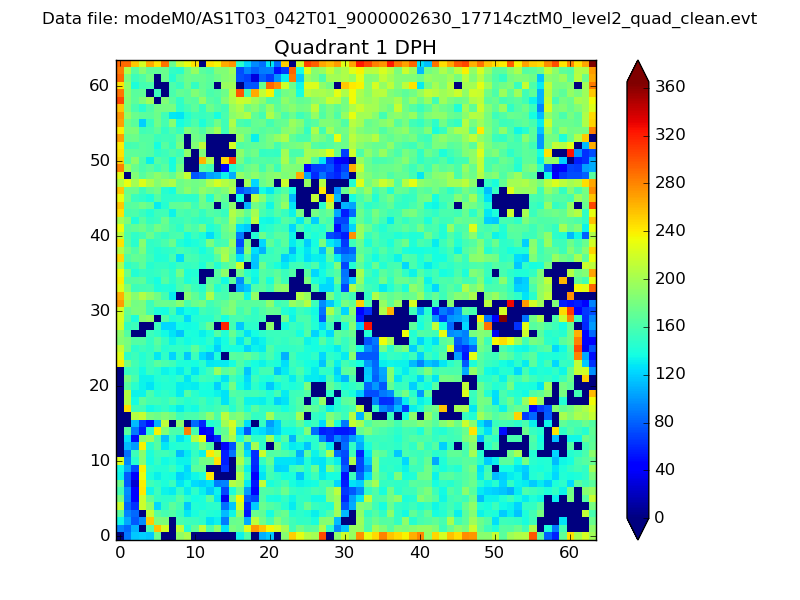
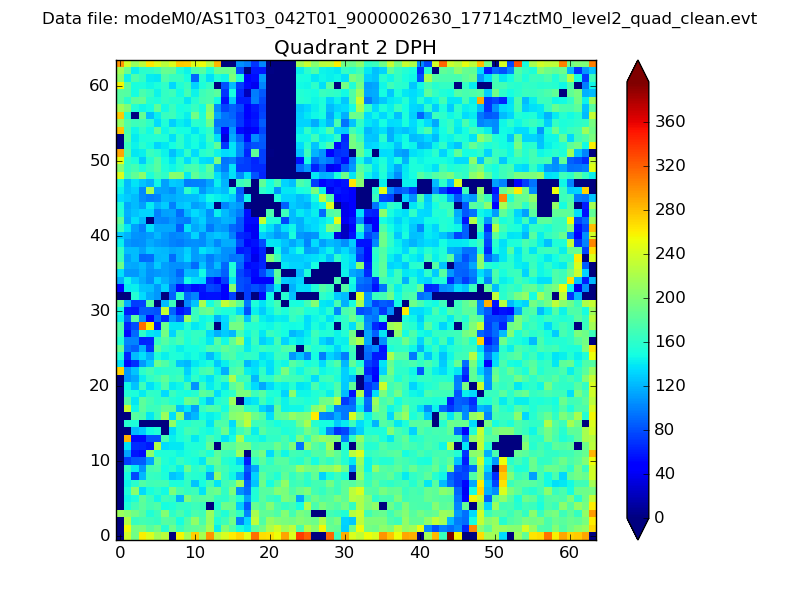
Histogram calculated using DETX and DETY for each event in the final _common_clean file
| Quadrant A | 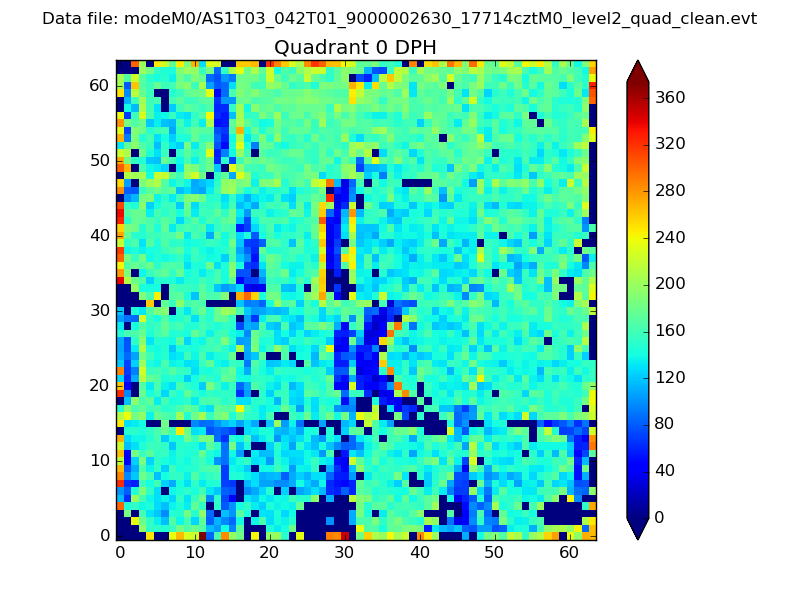 |
 |
Quadrant B |
|---|---|---|---|
| Quadrant D | 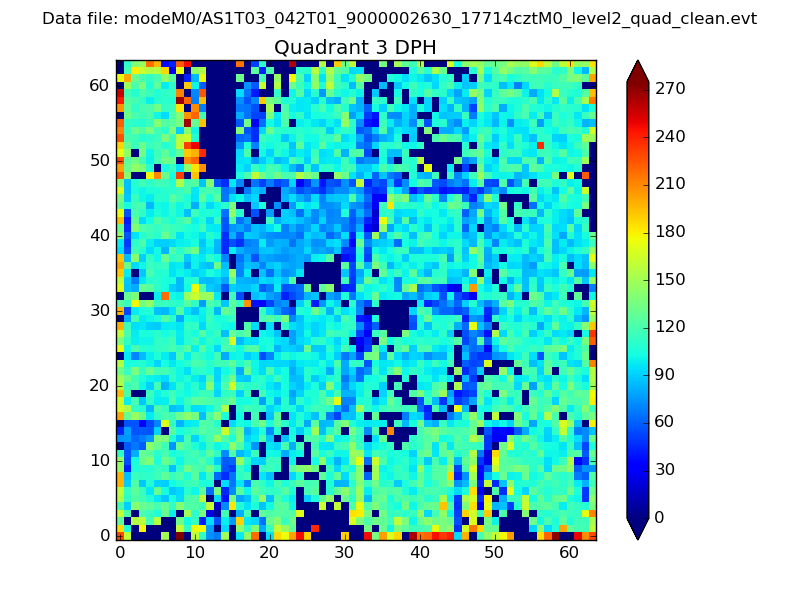 |
 |
Quadrant C |
| Plot type | Count rate plots | Images |
|---|---|---|
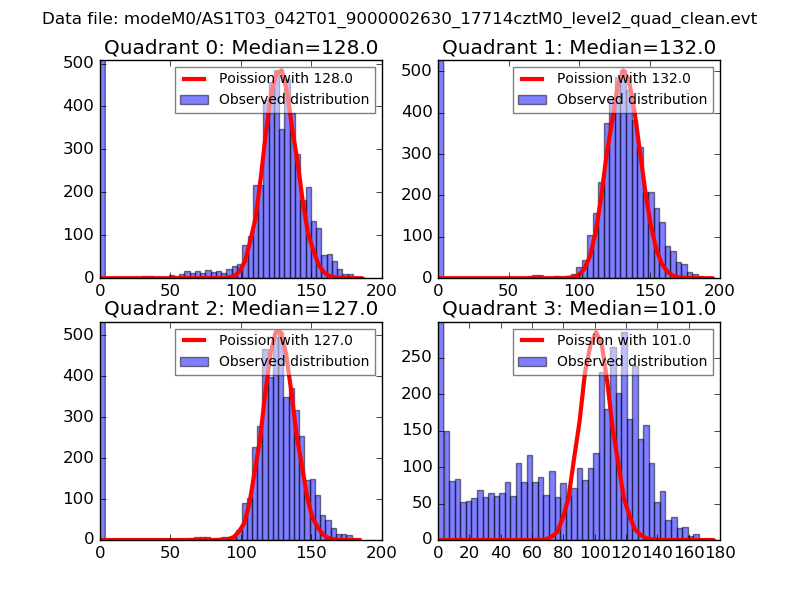
| Comparison with Poisson distribution Blue bars denote a histogram of data divided into 1 sec bins. Red curve is a Poisson curve with rate = median count rate of data. |
 |
 |
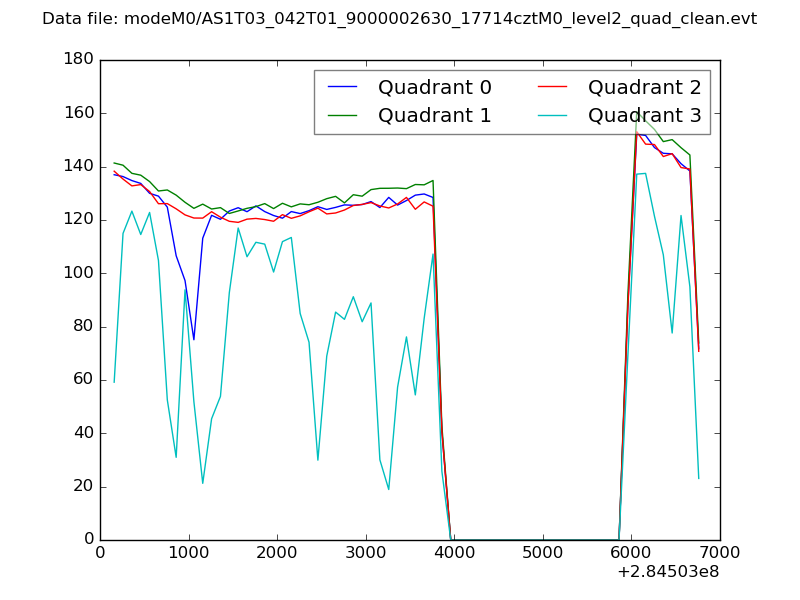
| Quadrant-wise count rates Data is divided into 100 sec bins |
 |
|
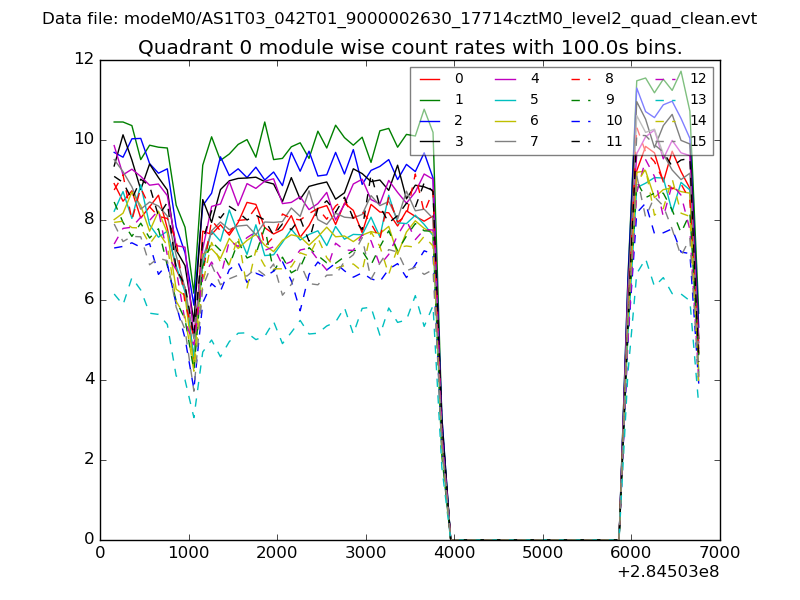
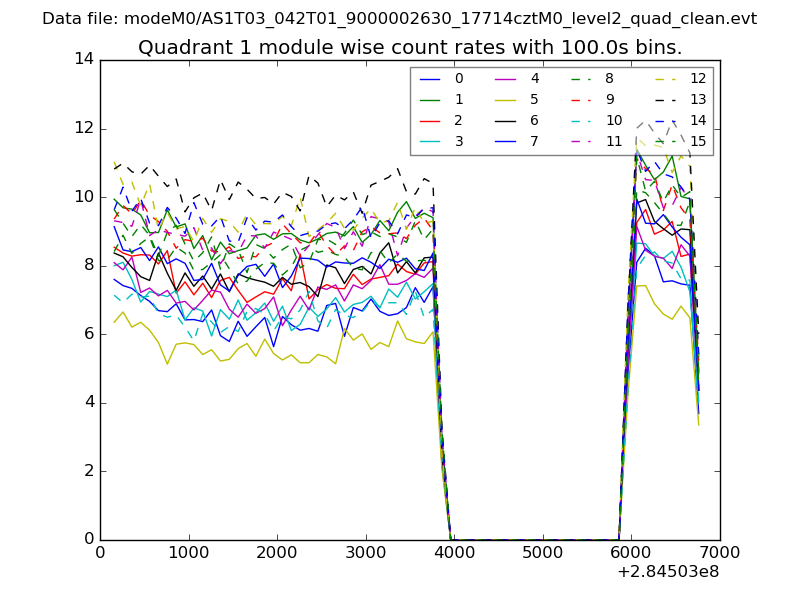
| Module-wise count rates for Quadrant A Data is divided into 100 sec bins |
 |
 |
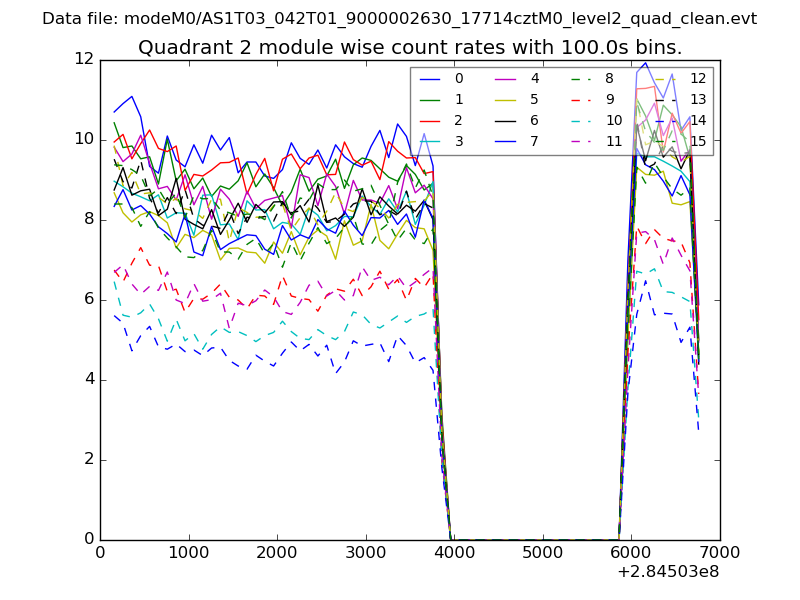
| Module-wise count rates for Quadrant B Data is divided into 100 sec bins |
 |
 |
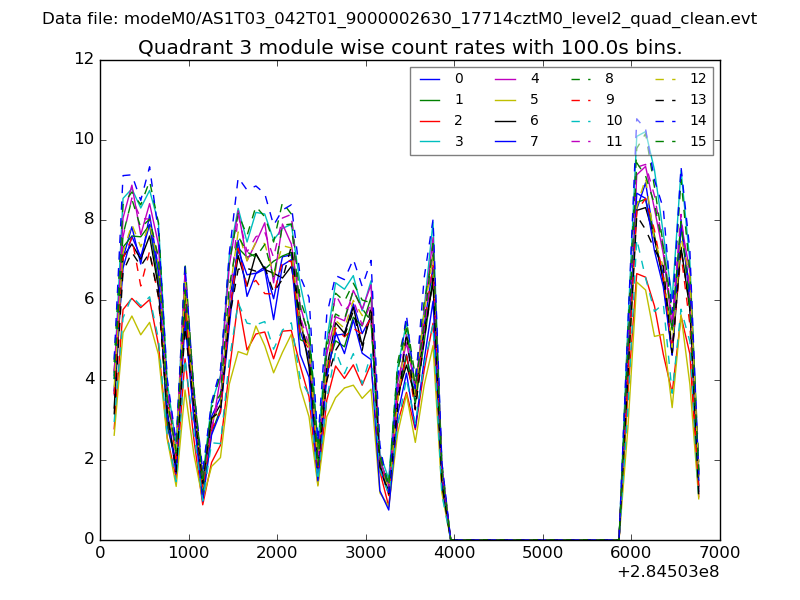
| Module-wise count rates for Quadrant C Data is divided into 100 sec bins |
 |
 |
| Module-wise count rates for Quadrant D Data is divided into 100 sec bins |
 |
 |
| Parameter | Plot |
|---|---|
| CZT HV Monitor | 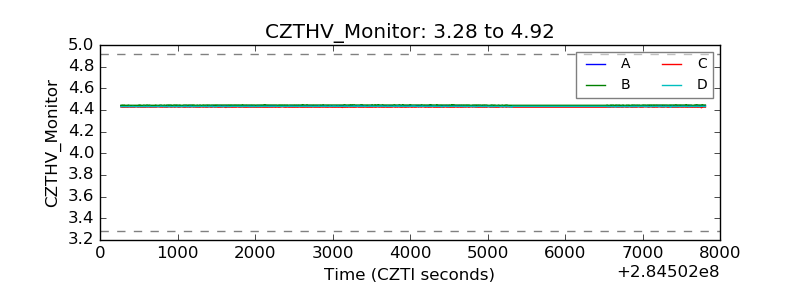 |
| D_VDD | 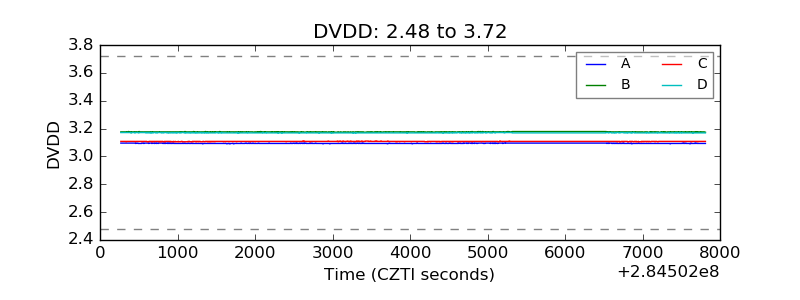 |
| Temperature 1 | 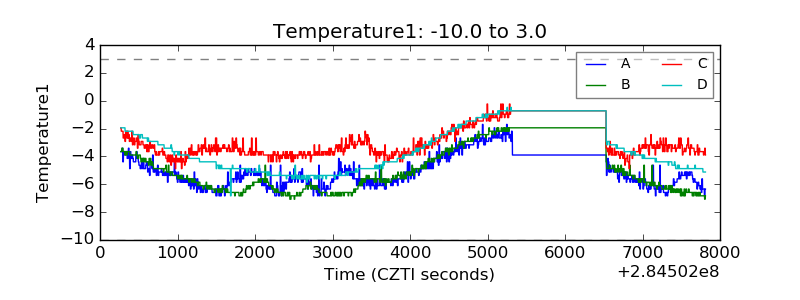 |
| Veto HV Monitor |  |
| Veto LLD | 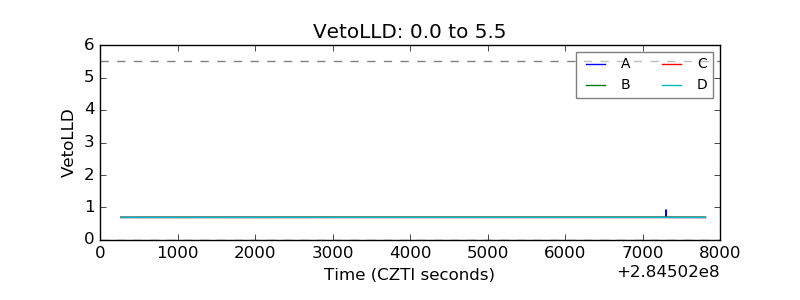 |
| Alpha Counter | 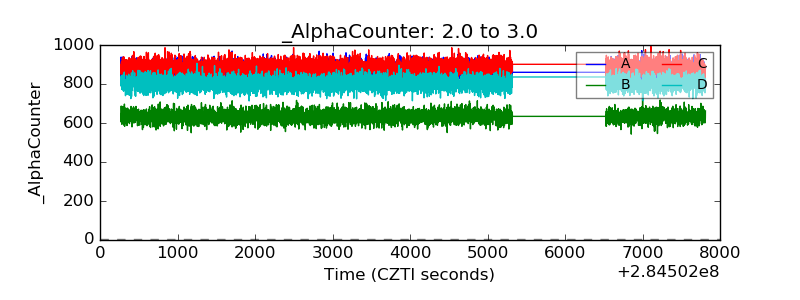 |
| _CPM_Rate | 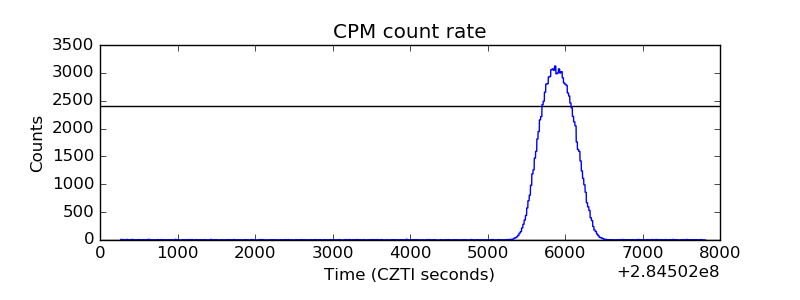 |
| CZT Counter | 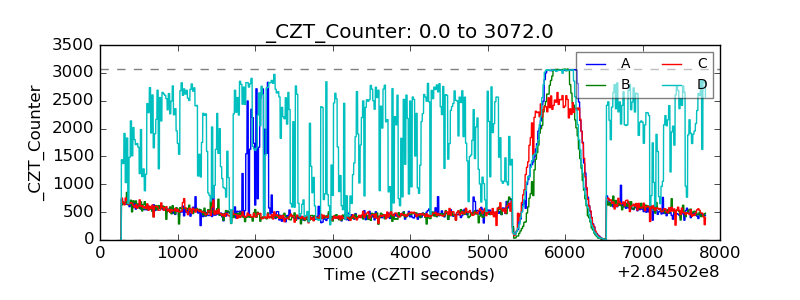 |
| +2.5 Volts monitor |  |
| +5 Volts monitor |  |
| _ROLL_ROT | 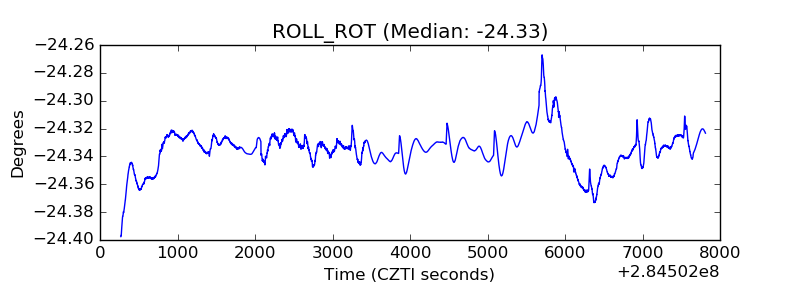 |
| _Roll_DEC | 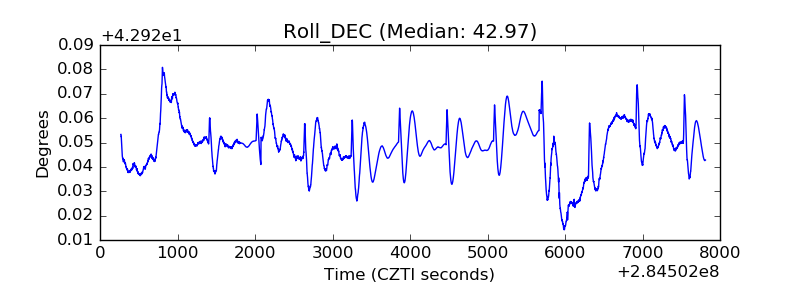 |
| _Roll_RA | 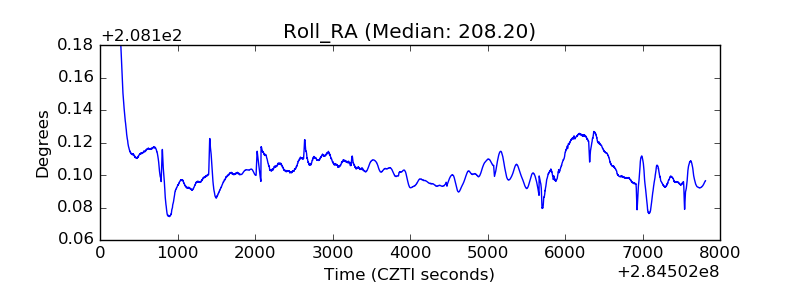 |
| Veto Counter | 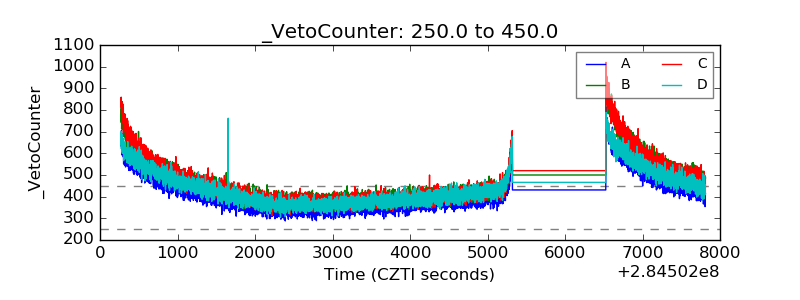 |