| Param | Original file | Final file |
|---|---|---|
| Filename | modeM0/AS1T03_042T01_9000002630_17715cztM0_level2.evt | modeM0/AS1T03_042T01_9000002630_17715cztM0_level2_quad_clean.evt |
| Size (bytes) | 696,412,800 | 98,614,080 |
| Size | 664.2 MB | 94.0 MB |
| Events in quadrant A | 3,165,300 | 687,970 |
| Events in quadrant B | 3,164,650 | 713,376 |
| Events in quadrant C | 3,155,497 | 679,907 |
| Events in quadrant D | 11,184,292 | 470,059 |
| Mode M9 | |||
|---|---|---|---|
| Quadrant | BADHDUFLAG | Total packets | Discarded packets |
| A | 0 | 13 | 0 |
| B | 0 | 13 | 0 |
| C | 0 | 13 | 0 |
| D | 0 | 13 | 0 |
| Mode M0 | |||
|---|---|---|---|
| Quadrant | BADHDUFLAG | Total packets | Discarded packets |
| A | 0 | 13356 | 2 |
| B | 0 | 13482 | 2 |
| C | 0 | 13418 | 2 |
| D | 0 | 37464 | 2 |
| Mode SS | |||
|---|---|---|---|
| Quadrant | BADHDUFLAG | Total packets | Discarded packets |
| A | 0 | 126 | 0 |
| B | 0 | 126 | 0 |
| C | 0 | 126 | 0 |
| D | 0 | 126 | 0 |
| Quadrant | Total seconds | Saturated seconds | Saturation percentage |
|---|---|---|---|
| A | 6221 | 20 | 0.321492% |
| B | 6222 | 30 | 0.482160% |
| C | 6222 | 58 | 0.932176% |
| D | 6222 | 3247 | 52.185792% |
Noise dominated data is calculated using 1-second bins in cleaned event files. If a bin has >2000 counts, and if more than 50% of those come from <1% of pixels, then it is considered to be noise-dominated and hence unusable.
| Quadrant | # 1 sec bins | Bins with >0 counts | Bins with >2000 counts | High rate bins dominated by noise | Noise dominated (total time) | Noise dominated (detector-on time) | Marked lightcurve |
|---|---|---|---|---|---|---|---|
| A | 7521 | 6222 | 0 | 0 | 0.00% | 0.00% | 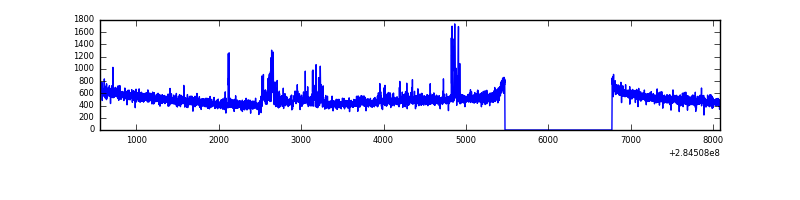 |
| B | 7522 | 6223 | 2 | 2 | 0.03% | 0.03% | 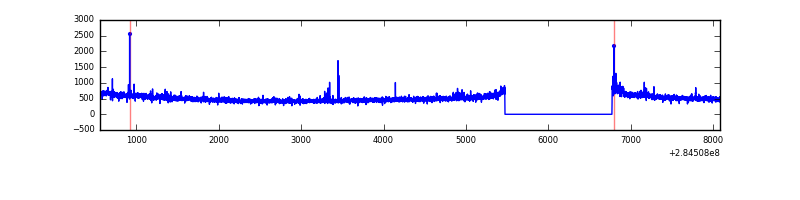 |
| C | 7522 | 6223 | 0 | 0 | 0.00% | 0.00% | 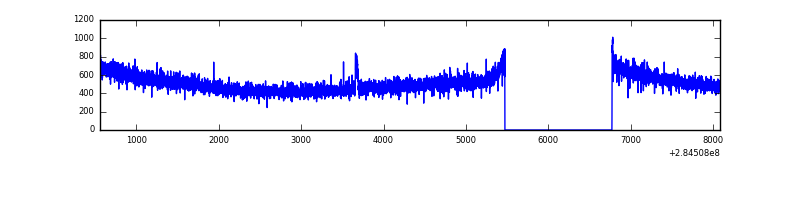 |
| D | 7522 | 6222 | 3007 | 3007 | 39.98% | 48.33% | 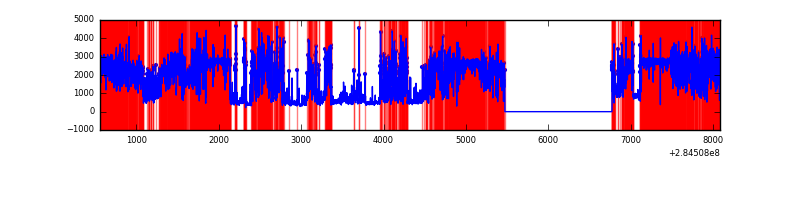 |
Top three noisy pixels from each quadrant. If the there are fewer than three noisy pixels in the level2.evt file, extra rows are filled as -1
| Pixel properties | Quadrant properties | ||||||
|---|---|---|---|---|---|---|---|
| Quadrant | DetID | PixID | Counts | Sigma | Mean | Median | Sigma |
| A | 15 | 174 | 147183 | 926.51 | 783 | 767 | 158.0 |
| A | 12 | 16 | 7530 | 42.8 | 783 | 767 | 158.0 |
| A | 0 | 226 | 6817 | 38.28 | 783 | 767 | 158.0 |
| B | 0 | 189 | 33812 | 224.14 | 791 | 775 | 147.4 |
| B | 12 | 111 | 17424 | 112.95 | 791 | 775 | 147.4 |
| B | 11 | 111 | 14903 | 95.85 | 791 | 775 | 147.4 |
| C | 14 | 238 | 120801 | 682.81 | 760 | 767 | 175.8 |
| C | 5 | 218 | 37313 | 207.89 | 760 | 767 | 175.8 |
| C | 3 | 233 | 31431 | 174.43 | 760 | 767 | 175.8 |
| D | 7 | 238 | 8896761 | 67701.48 | 541 | 526 | 131.4 |
| D | 13 | 232 | 136322 | 1033.42 | 541 | 526 | 131.4 |
| D | 1 | 52 | 35250 | 264.25 | 541 | 526 | 131.4 |
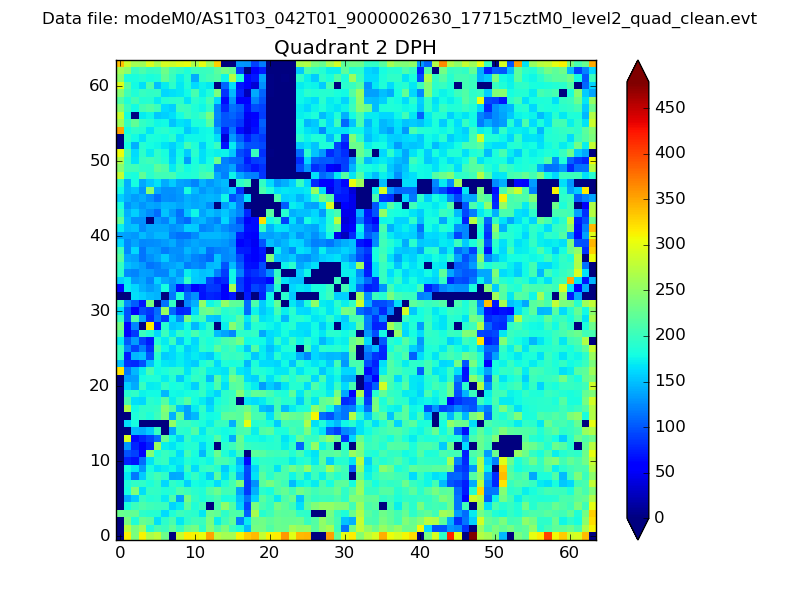
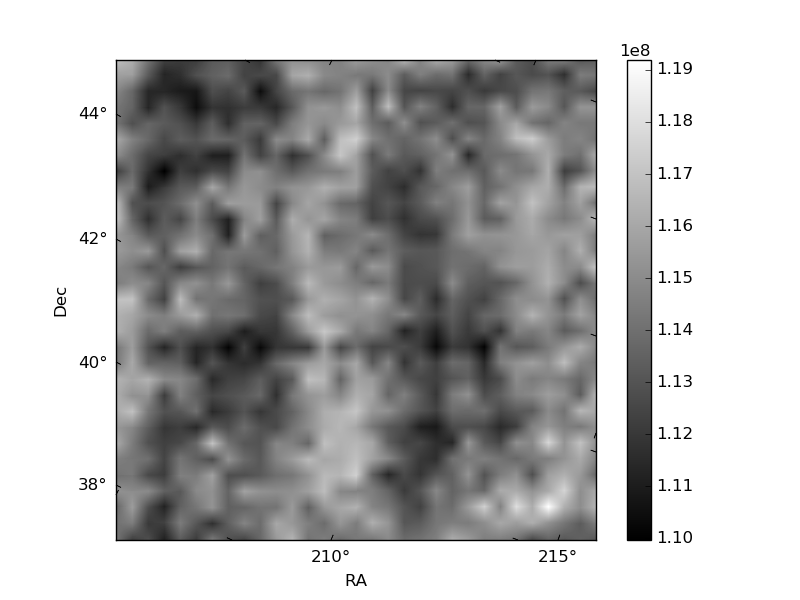
Histogram calculated using DETX and DETY for each event in the final _common_clean file
| Quadrant A | 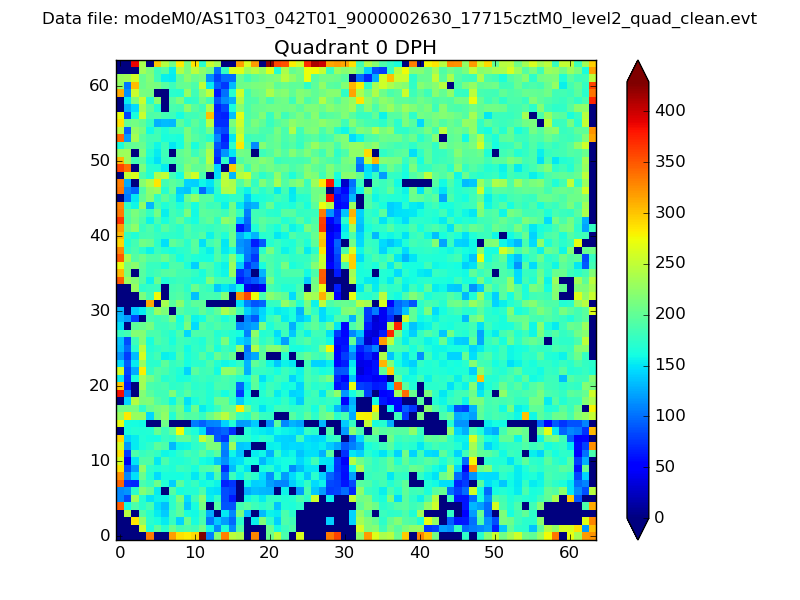 |
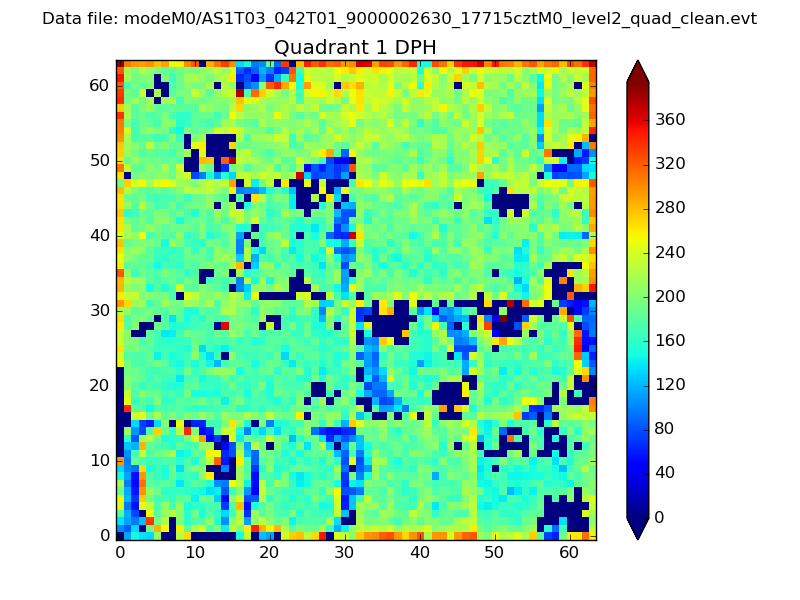 |
Quadrant B |
|---|---|---|---|
| Quadrant D | 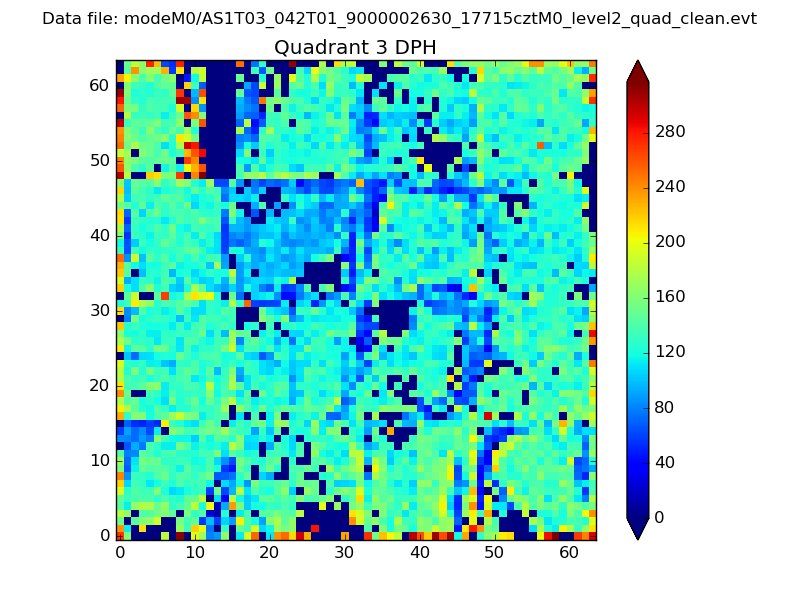 |
 |
Quadrant C |
| Plot type | Count rate plots | Images |
|---|---|---|
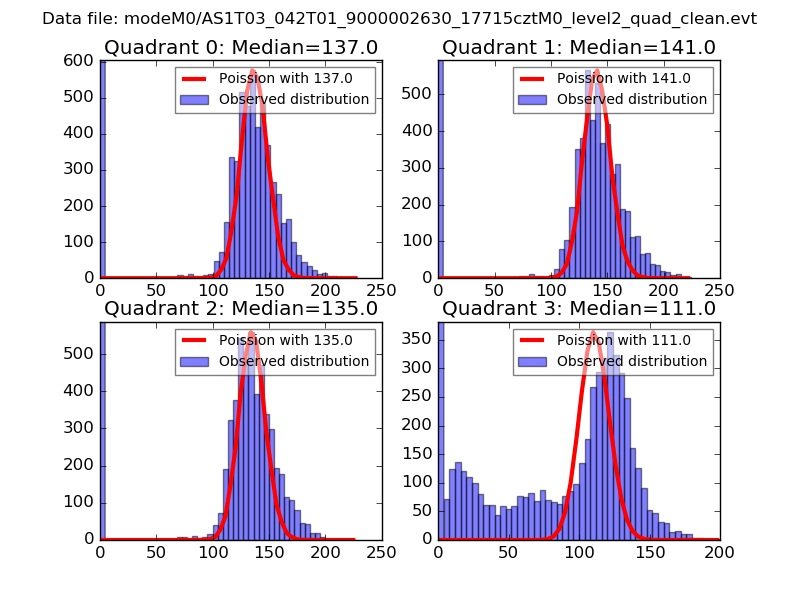
| Comparison with Poisson distribution Blue bars denote a histogram of data divided into 1 sec bins. Red curve is a Poisson curve with rate = median count rate of data. |
 |
 |
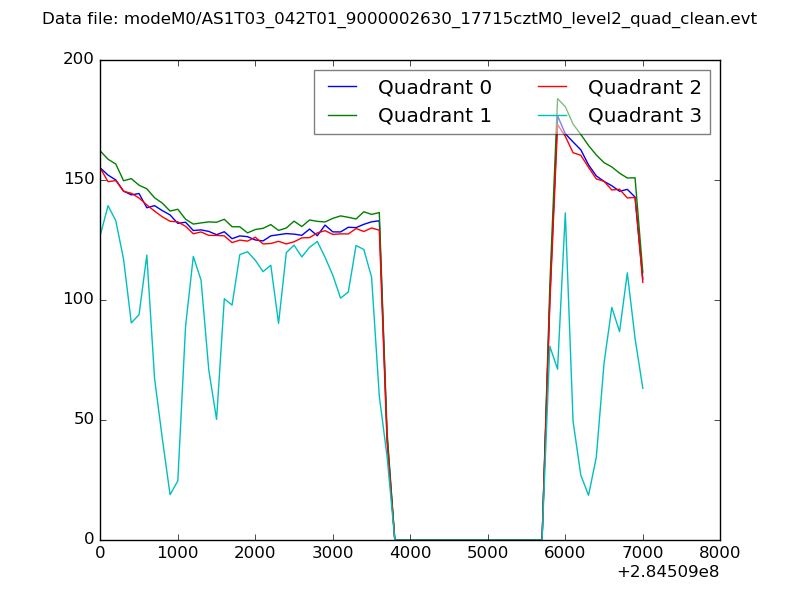
| Quadrant-wise count rates Data is divided into 100 sec bins |
 |
|
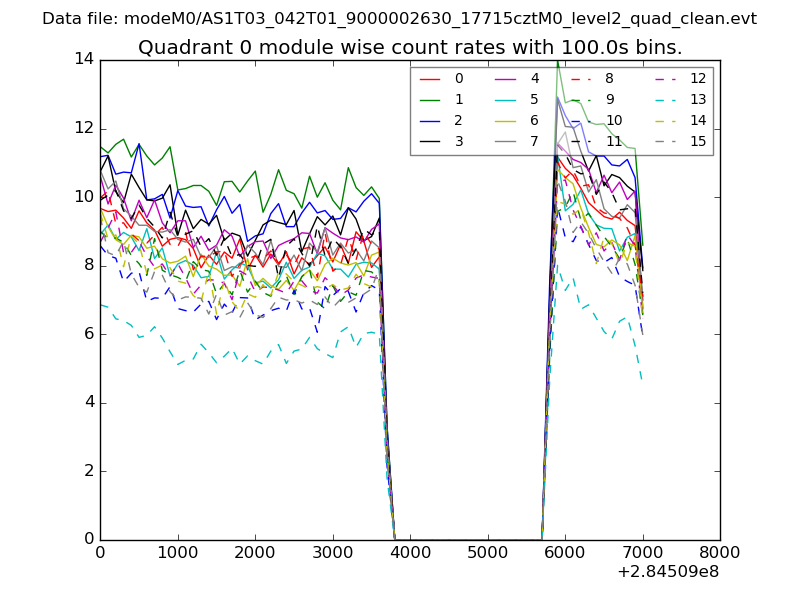
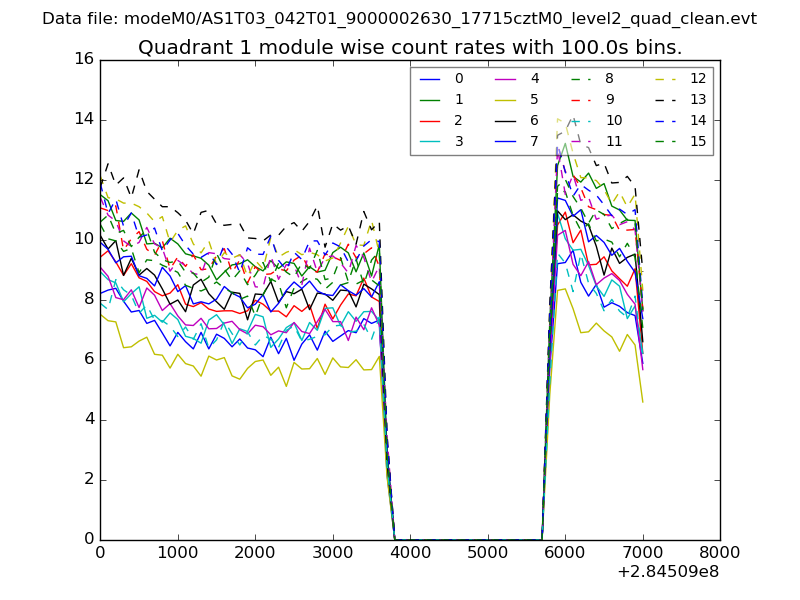
| Module-wise count rates for Quadrant A Data is divided into 100 sec bins |
 |
 |
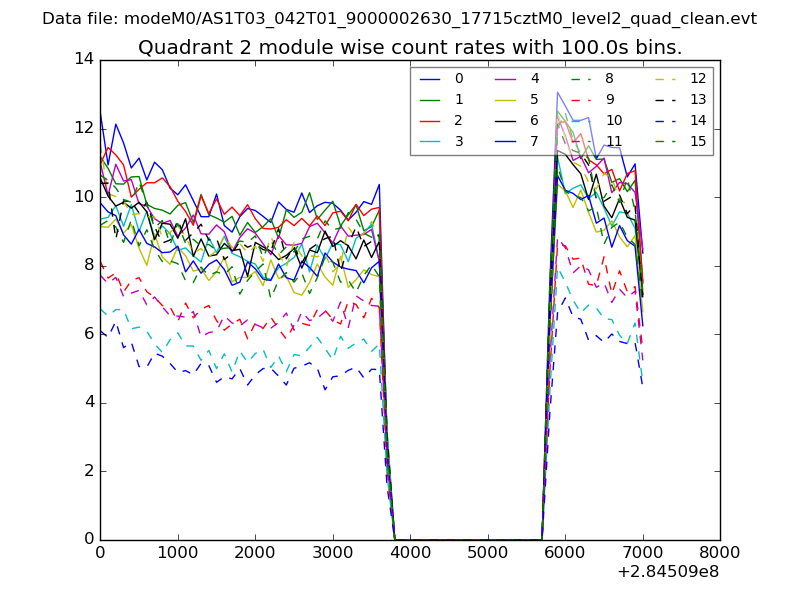
| Module-wise count rates for Quadrant B Data is divided into 100 sec bins |
 |
 |
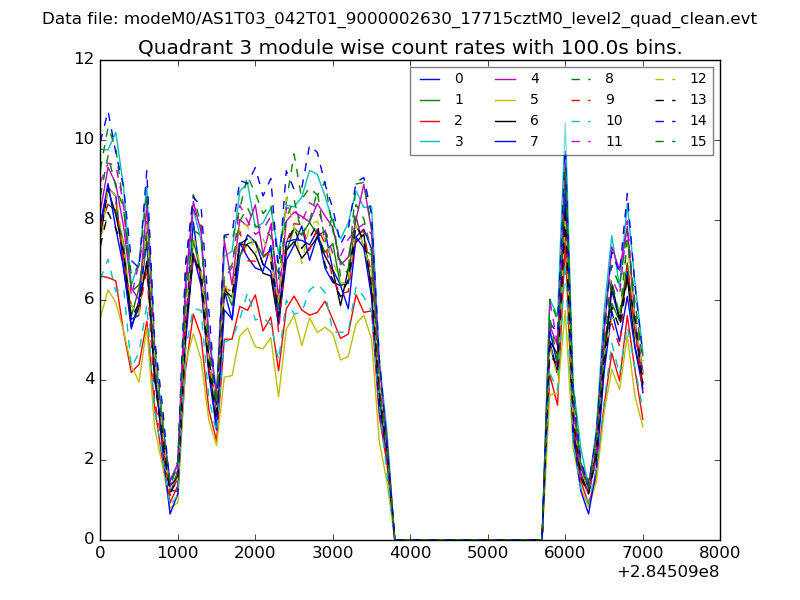
| Module-wise count rates for Quadrant C Data is divided into 100 sec bins |
 |
 |
| Module-wise count rates for Quadrant D Data is divided into 100 sec bins |
 |
 |
| Parameter | Plot |
|---|---|
| CZT HV Monitor | 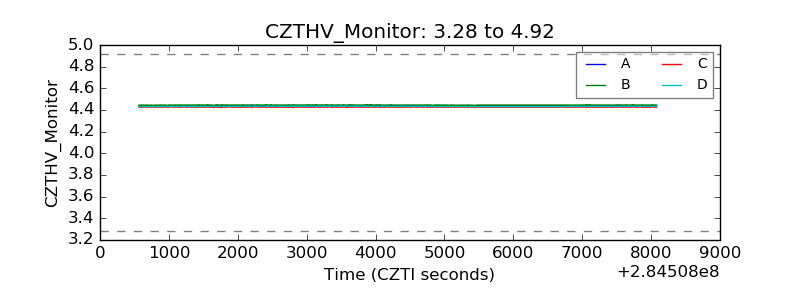 |
| D_VDD | 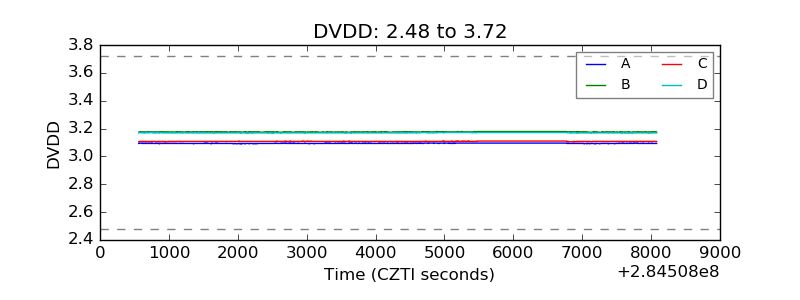 |
| Temperature 1 |  |
| Veto HV Monitor | 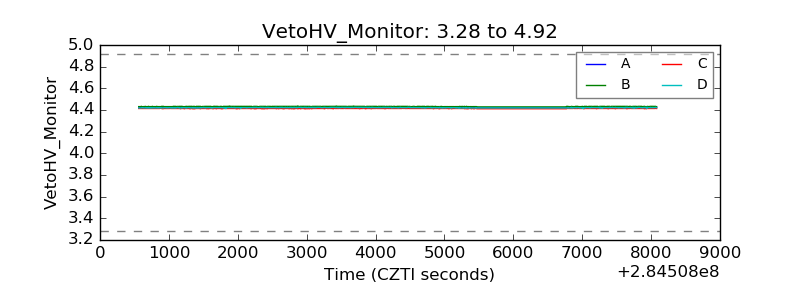 |
| Veto LLD |  |
| Alpha Counter | 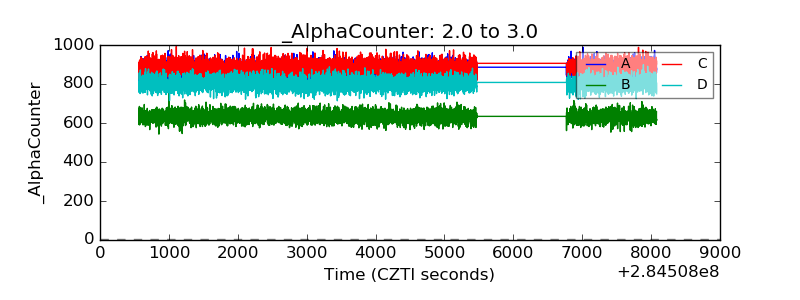 |
| _CPM_Rate | 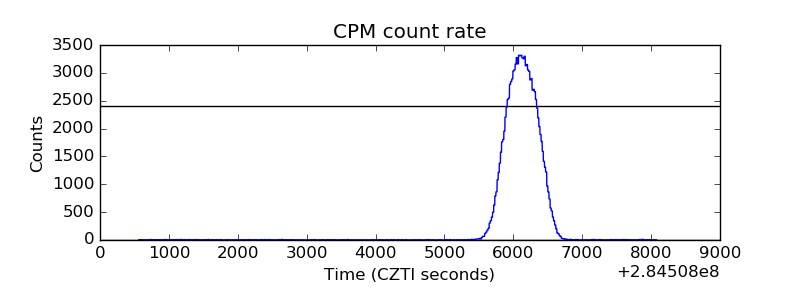 |
| CZT Counter | 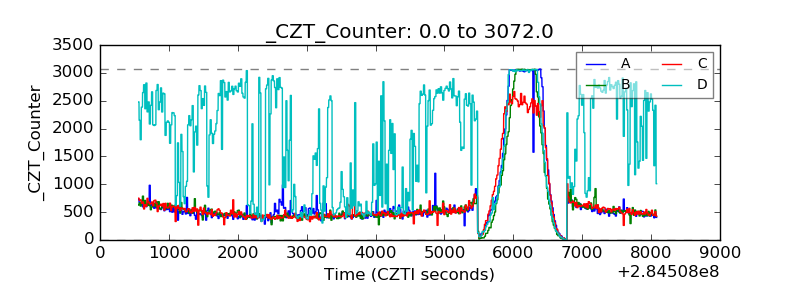 |
| +2.5 Volts monitor |  |
| +5 Volts monitor |  |
| _ROLL_ROT | 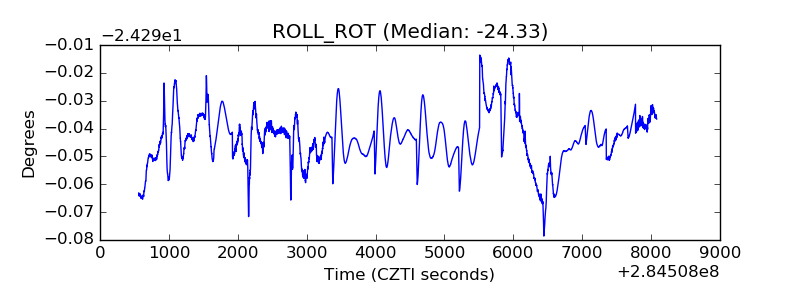 |
| _Roll_DEC |  |
| _Roll_RA | 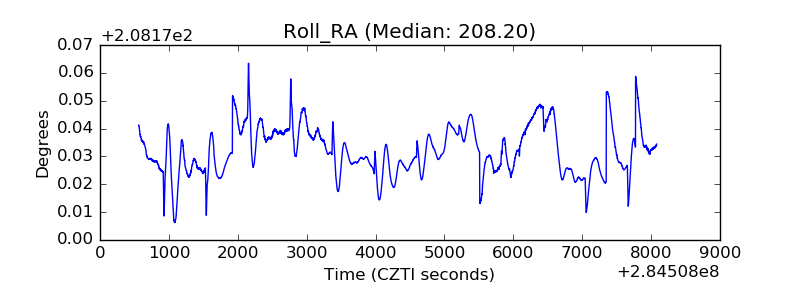 |
| Veto Counter | 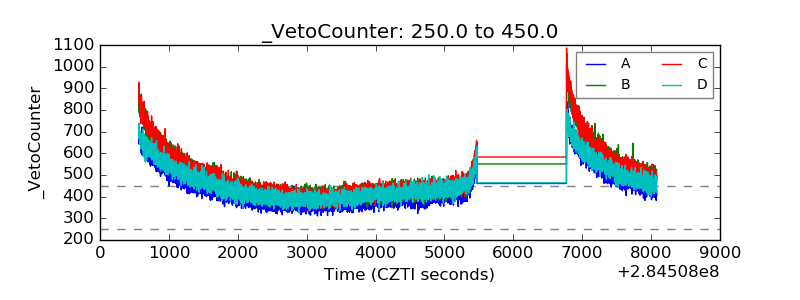 |