| Param | Original file | Final file |
|---|---|---|
| Filename | modeM0/AS1T03_042T01_9000002630_17716cztM0_level2.evt | modeM0/AS1T03_042T01_9000002630_17716cztM0_level2_quad_clean.evt |
| Size (bytes) | 803,782,080 | 107,841,600 |
| Size | 766.5 MB | 102.8 MB |
| Events in quadrant A | 3,213,112 | 776,470 |
| Events in quadrant B | 3,342,245 | 807,322 |
| Events in quadrant C | 3,351,978 | 763,397 |
| Events in quadrant D | 13,990,207 | 458,319 |
| Mode M9 | |||
|---|---|---|---|
| Quadrant | BADHDUFLAG | Total packets | Discarded packets |
| A | 0 | 15 | 0 |
| B | 0 | 16 | 0 |
| C | 0 | 16 | 0 |
| D | 0 | 16 | 0 |
| Mode M0 | |||
|---|---|---|---|
| Quadrant | BADHDUFLAG | Total packets | Discarded packets |
| A | 0 | 13798 | 2 |
| B | 0 | 14101 | 2 |
| C | 0 | 14079 | 2 |
| D | 0 | 46077 | 2 |
| Mode SS | |||
|---|---|---|---|
| Quadrant | BADHDUFLAG | Total packets | Discarded packets |
| A | 0 | 132 | 0 |
| B | 0 | 132 | 0 |
| C | 0 | 132 | 0 |
| D | 0 | 132 | 0 |
| Quadrant | Total seconds | Saturated seconds | Saturation percentage |
|---|---|---|---|
| A | 6589 | 37 | 0.561542% |
| B | 6589 | 58 | 0.880255% |
| C | 6589 | 77 | 1.168614% |
| D | 6589 | 4218 | 64.015784% |
Noise dominated data is calculated using 1-second bins in cleaned event files. If a bin has >2000 counts, and if more than 50% of those come from <1% of pixels, then it is considered to be noise-dominated and hence unusable.
| Quadrant | # 1 sec bins | Bins with >0 counts | Bins with >2000 counts | High rate bins dominated by noise | Noise dominated (total time) | Noise dominated (detector-on time) | Marked lightcurve |
|---|---|---|---|---|---|---|---|
| A | 7909 | 6590 | 0 | 0 | 0.00% | 0.00% | 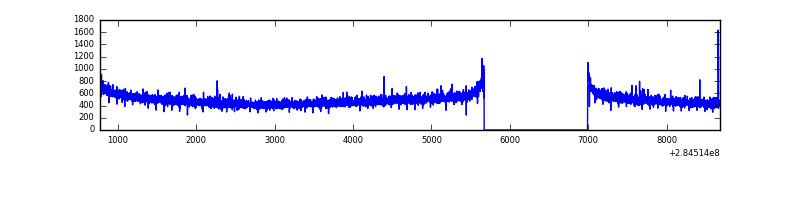 |
| B | 7909 | 6590 | 1 | 1 | 0.01% | 0.02% | 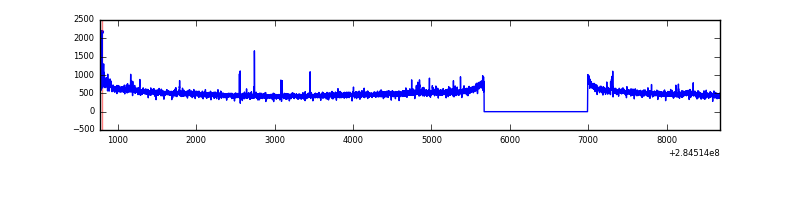 |
| C | 7909 | 6590 | 0 | 0 | 0.00% | 0.00% | 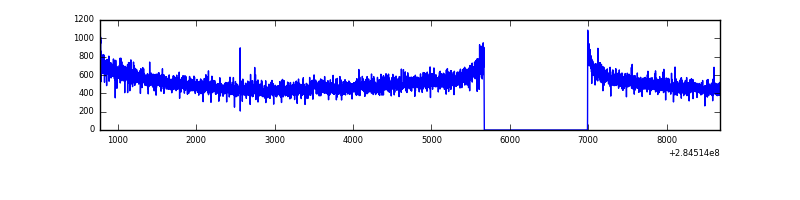 |
| D | 7909 | 6589 | 4061 | 4061 | 51.35% | 61.63% | 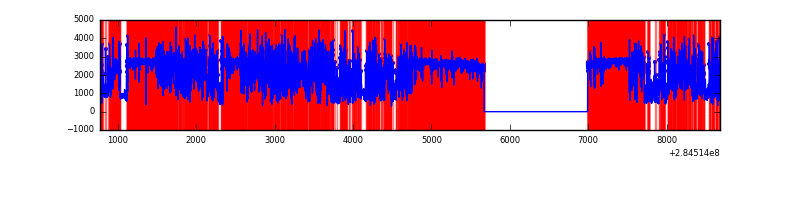 |
Top three noisy pixels from each quadrant. If the there are fewer than three noisy pixels in the level2.evt file, extra rows are filled as -1
| Pixel properties | Quadrant properties | ||||||
|---|---|---|---|---|---|---|---|
| Quadrant | DetID | PixID | Counts | Sigma | Mean | Median | Sigma |
| A | 15 | 174 | 15213 | 85.9 | 831 | 817 | 167.6 |
| A | 0 | 226 | 7256 | 38.42 | 831 | 817 | 167.6 |
| A | 12 | 194 | 6646 | 34.78 | 831 | 817 | 167.6 |
| B | 0 | 189 | 21121 | 128.47 | 840 | 821 | 158.0 |
| B | 12 | 111 | 18212 | 110.06 | 840 | 821 | 158.0 |
| B | 11 | 111 | 15590 | 93.47 | 840 | 821 | 158.0 |
| C | 14 | 238 | 127895 | 683.88 | 802 | 810 | 185.8 |
| C | 5 | 218 | 43031 | 227.2 | 802 | 810 | 185.8 |
| C | 3 | 233 | 42674 | 225.28 | 802 | 810 | 185.8 |
| D | 7 | 238 | 11845416 | 89212.67 | 497 | 488 | 132.8 |
| D | 12 | 227 | 87590 | 656.03 | 497 | 488 | 132.8 |
| D | 7 | 223 | 62753 | 468.96 | 497 | 488 | 132.8 |
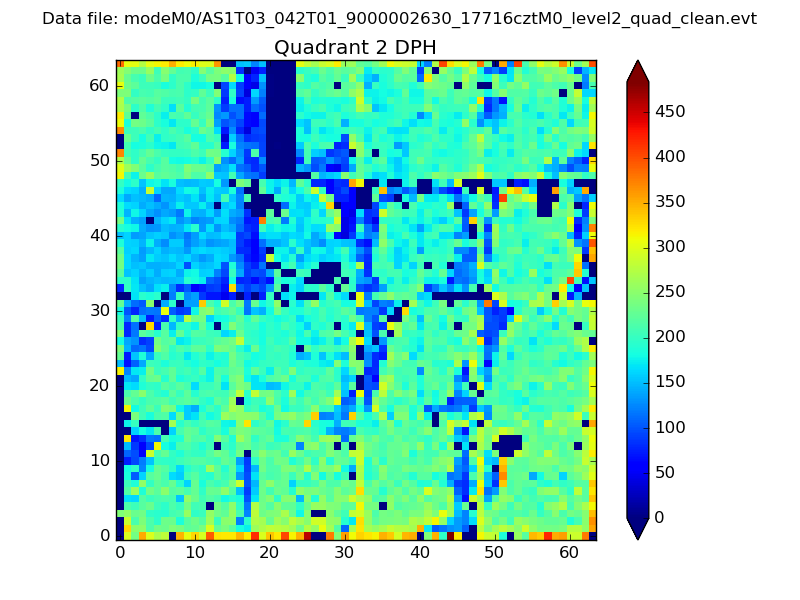
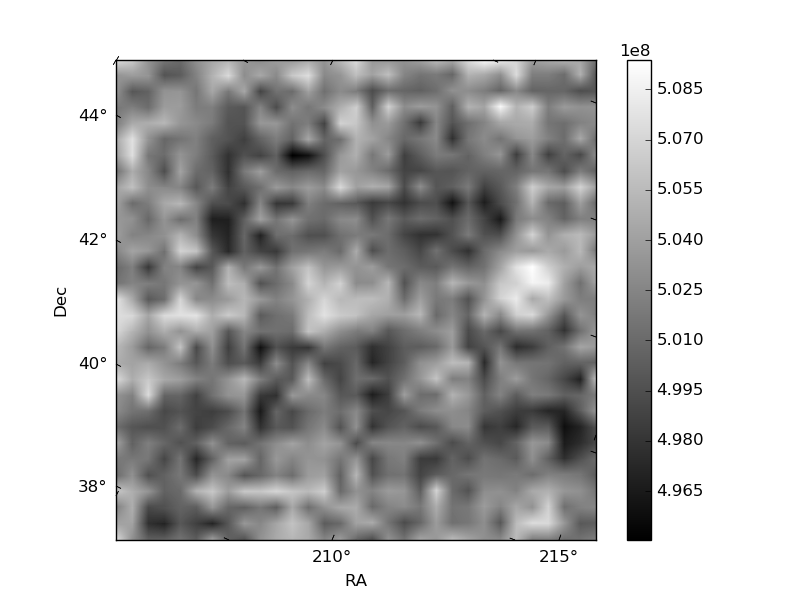
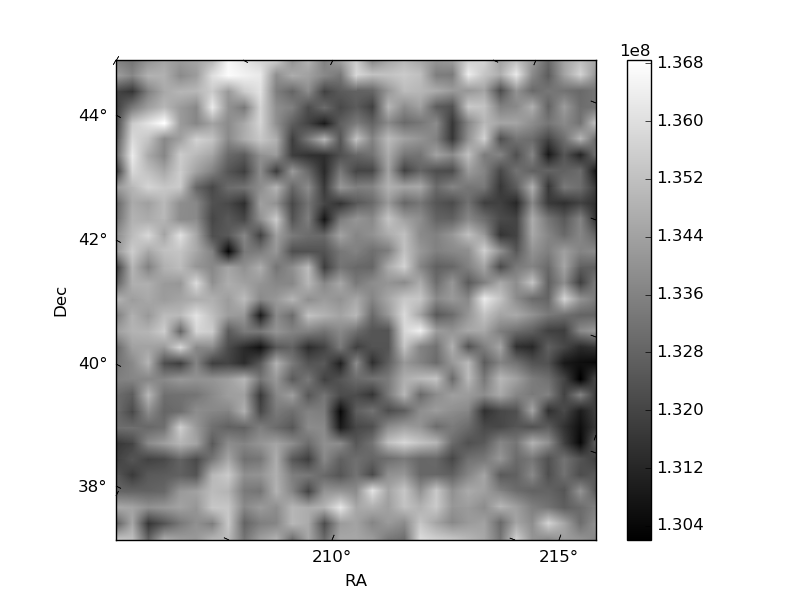
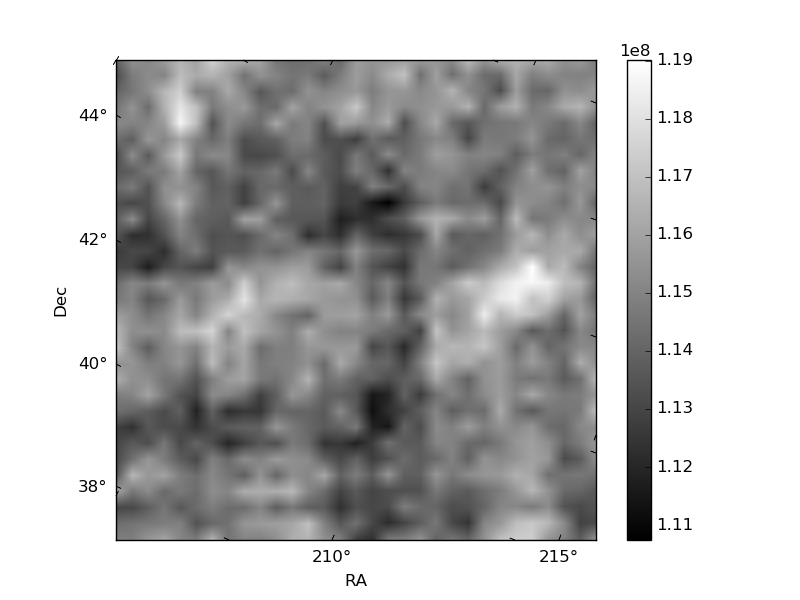
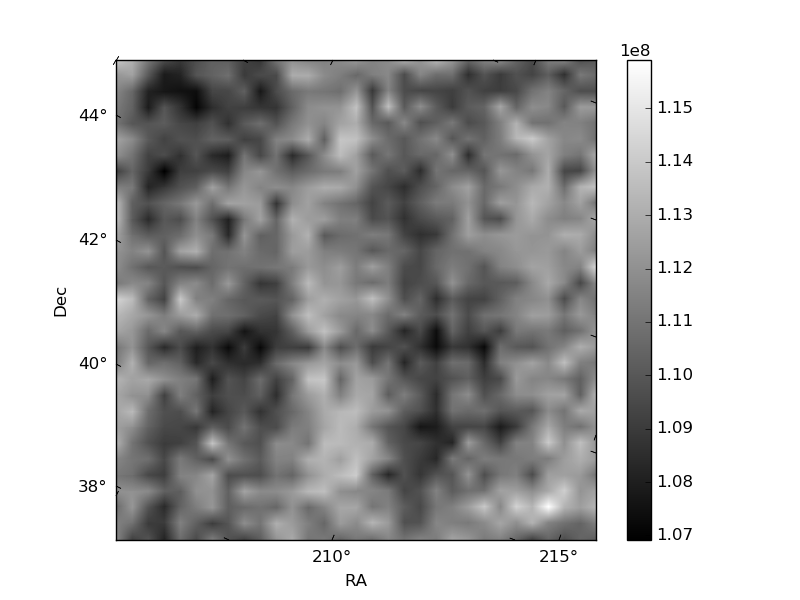
Histogram calculated using DETX and DETY for each event in the final _common_clean file
| Quadrant A | 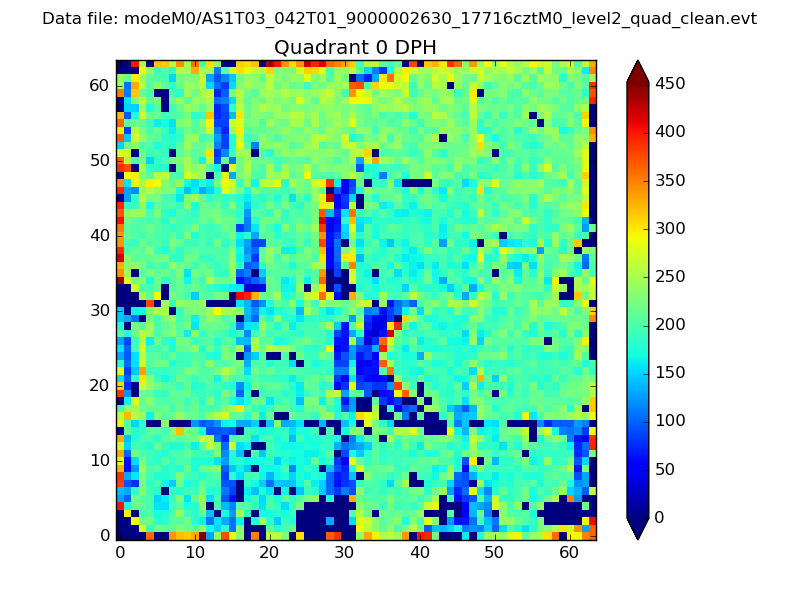 |
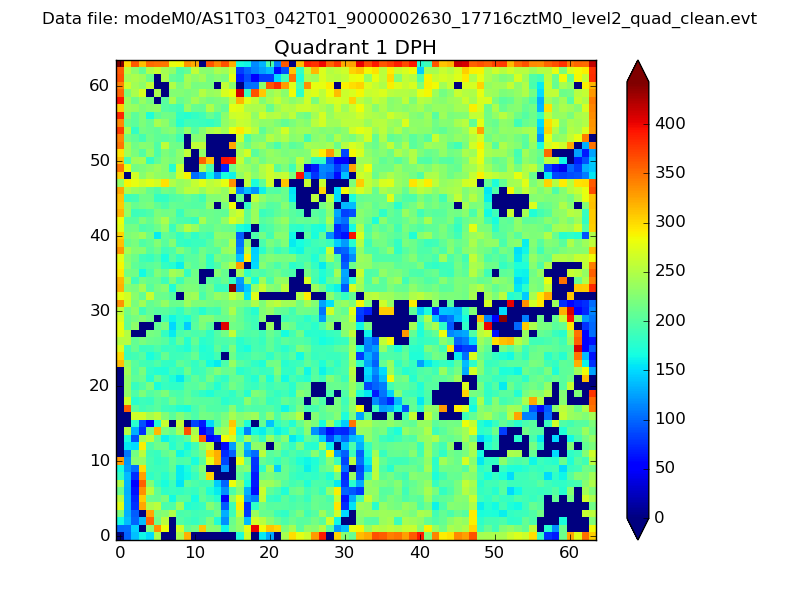 |
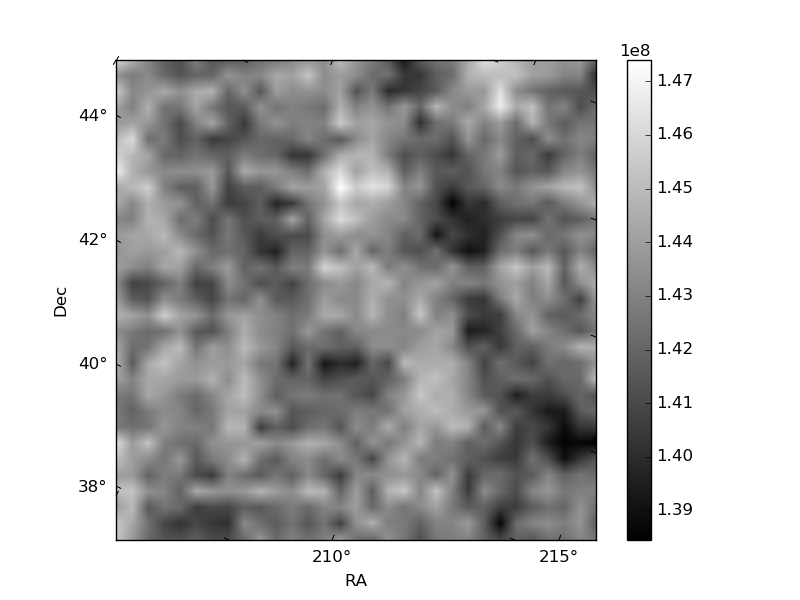
Quadrant B |
|---|---|---|---|
| Quadrant D | 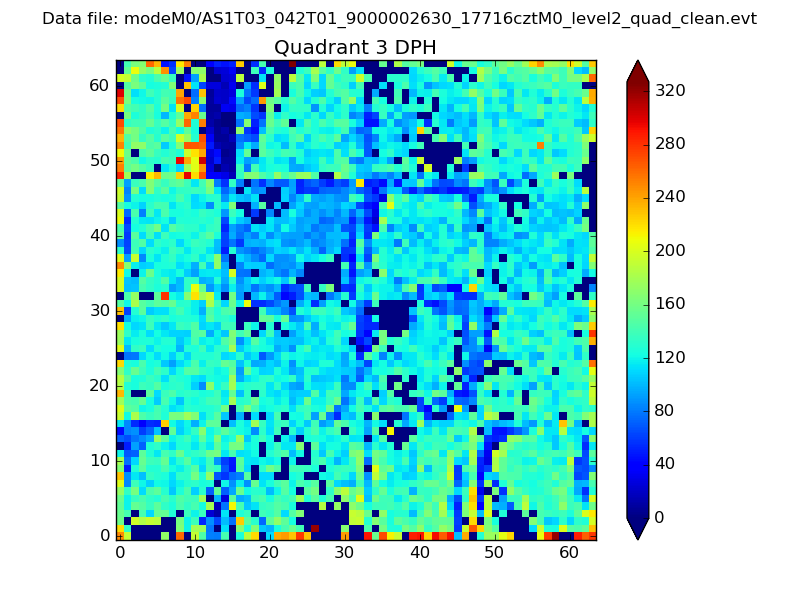 |
 |
Quadrant C |
| Plot type | Count rate plots | Images |
|---|---|---|
| Comparison with Poisson distribution Blue bars denote a histogram of data divided into 1 sec bins. Red curve is a Poisson curve with rate = median count rate of data. |
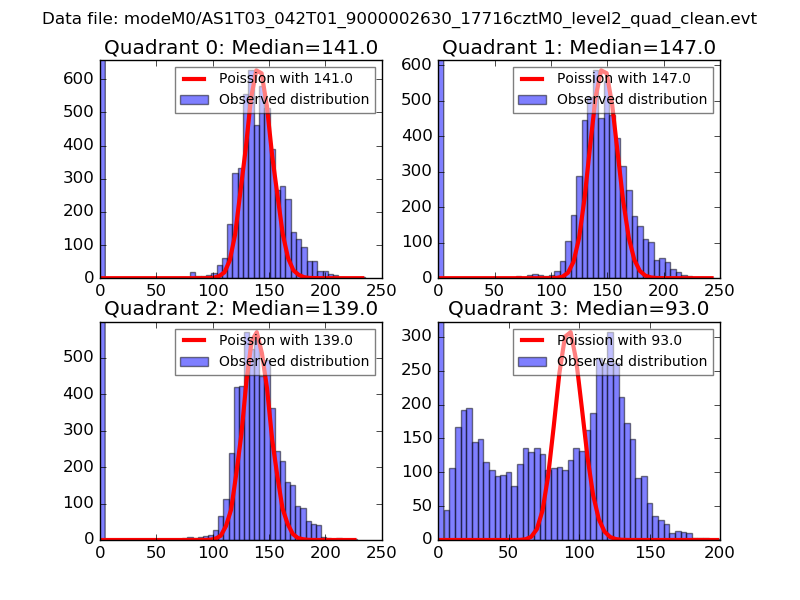 |
 |
| Quadrant-wise count rates Data is divided into 100 sec bins |
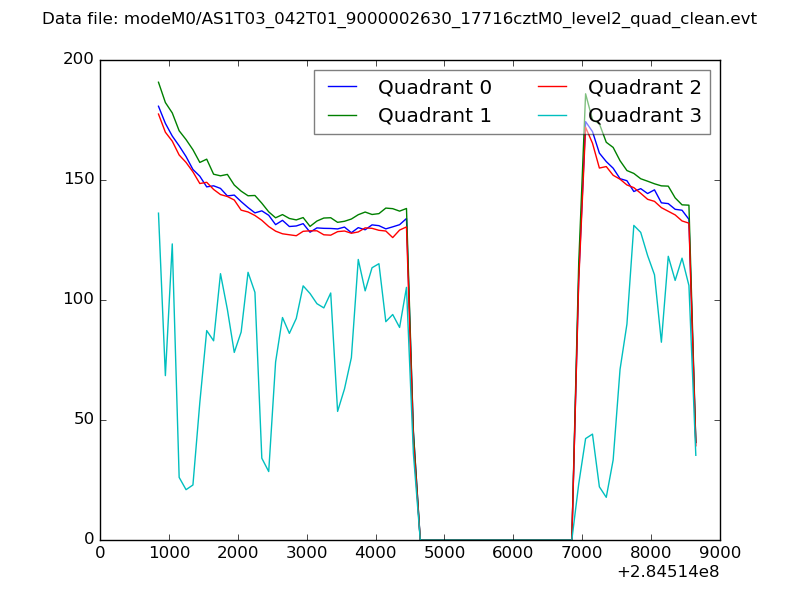 |
|
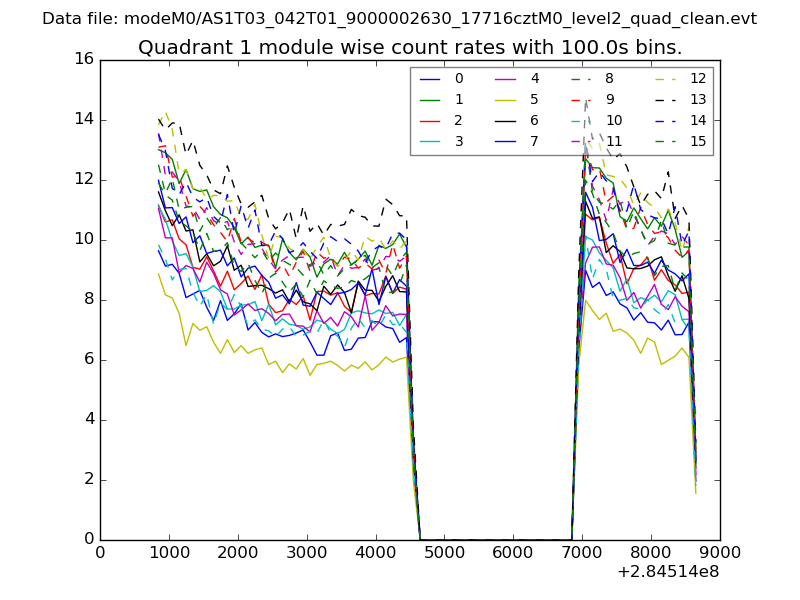
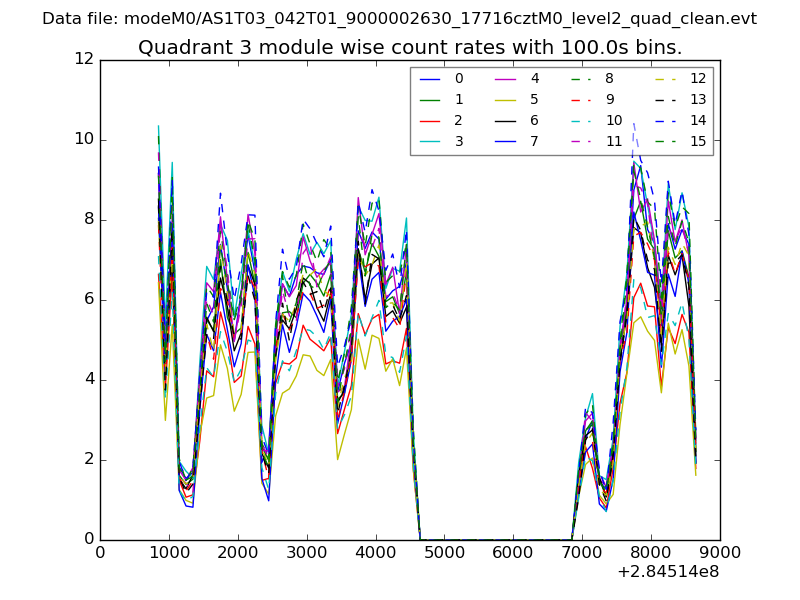
| Module-wise count rates for Quadrant A Data is divided into 100 sec bins |
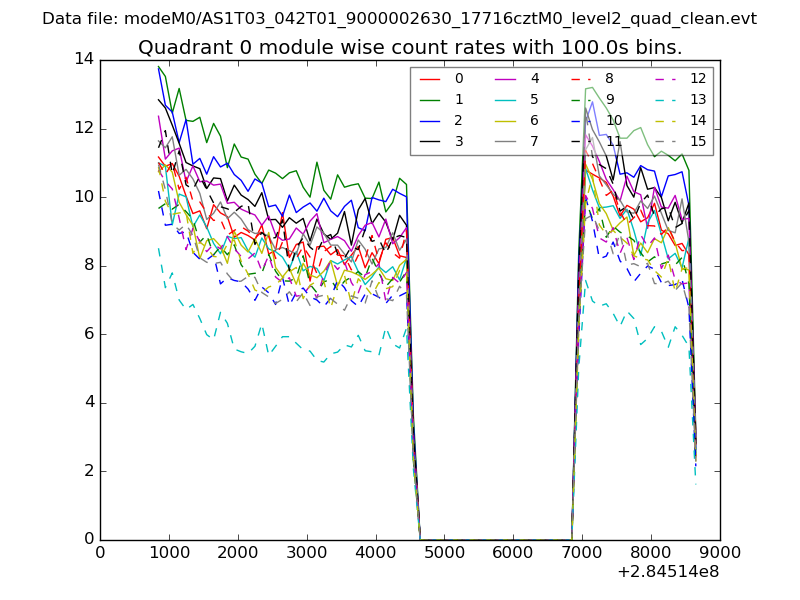 |
 |
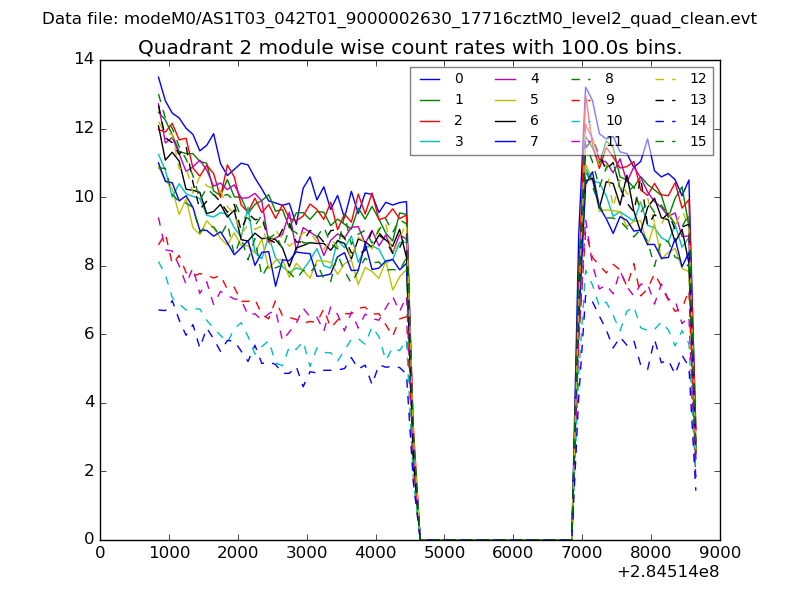
| Module-wise count rates for Quadrant B Data is divided into 100 sec bins |
 |
 |
| Module-wise count rates for Quadrant C Data is divided into 100 sec bins |
 |
 |
| Module-wise count rates for Quadrant D Data is divided into 100 sec bins |
 |
 |
| Parameter | Plot |
|---|---|
| CZT HV Monitor | 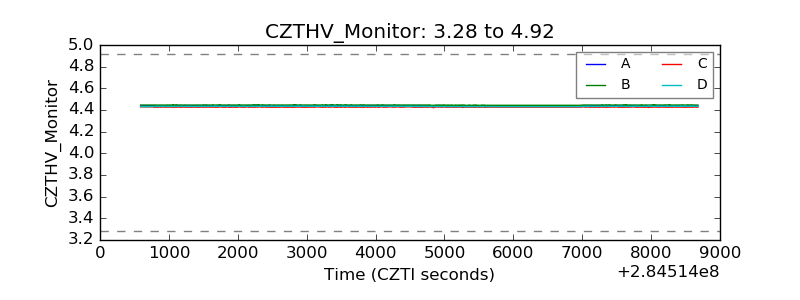 |
| D_VDD | 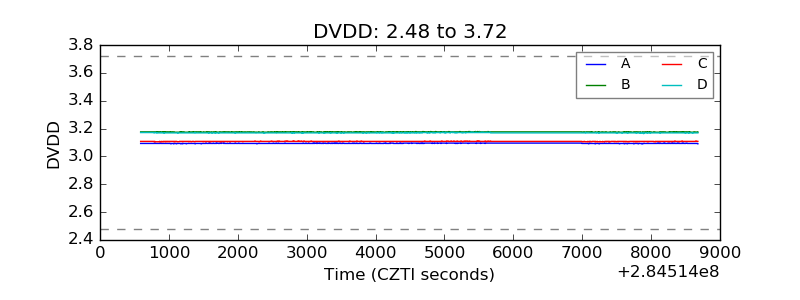 |
| Temperature 1 |  |
| Veto HV Monitor | 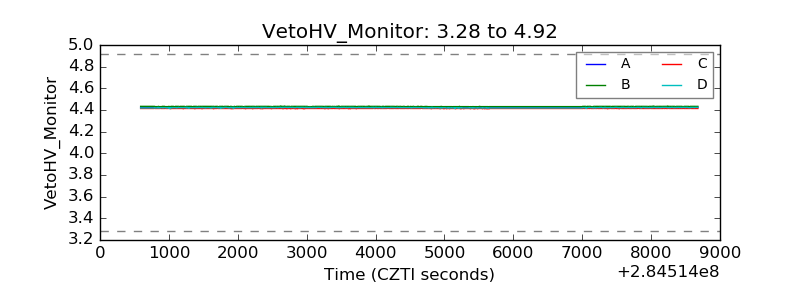 |
| Veto LLD | 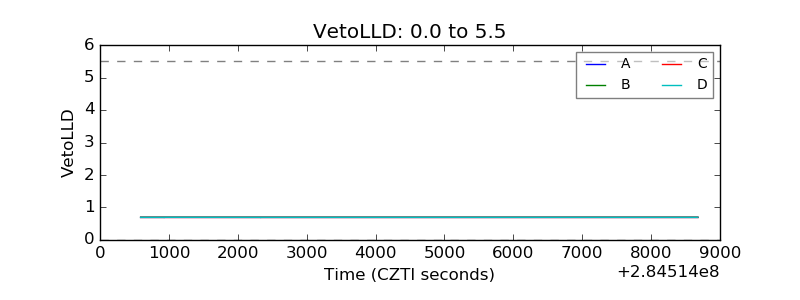 |
| Alpha Counter | 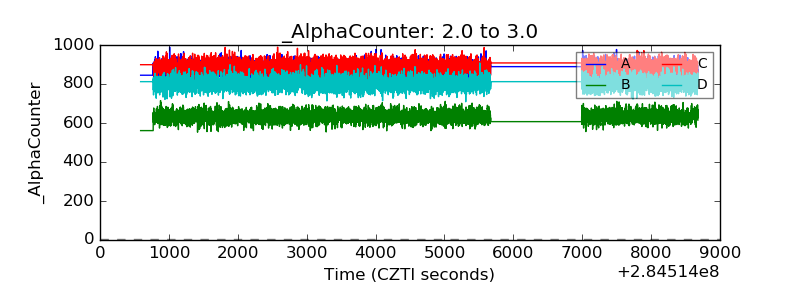 |
| _CPM_Rate | 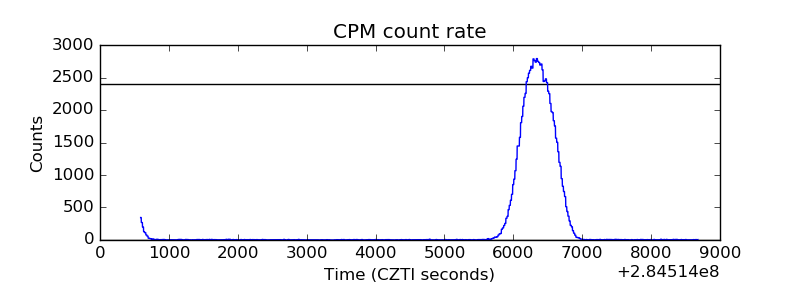 |
| CZT Counter | 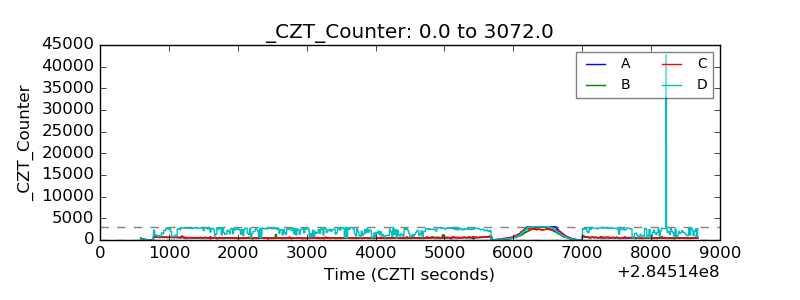 |
| +2.5 Volts monitor |  |
| +5 Volts monitor |  |
| _ROLL_ROT | 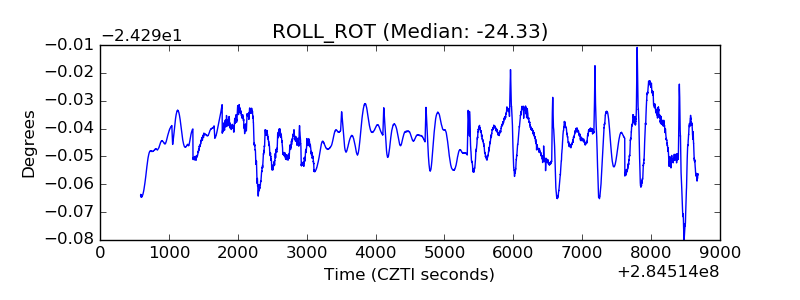 |
| _Roll_DEC | 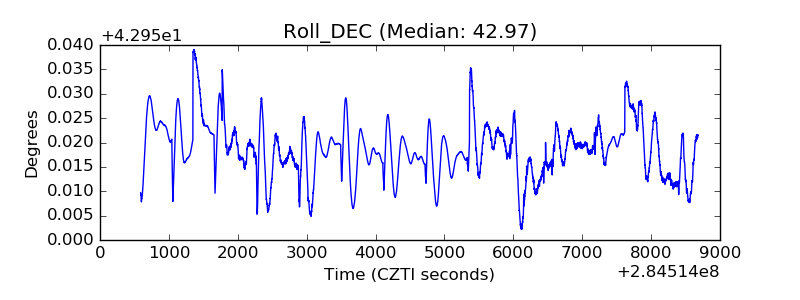 |
| _Roll_RA | 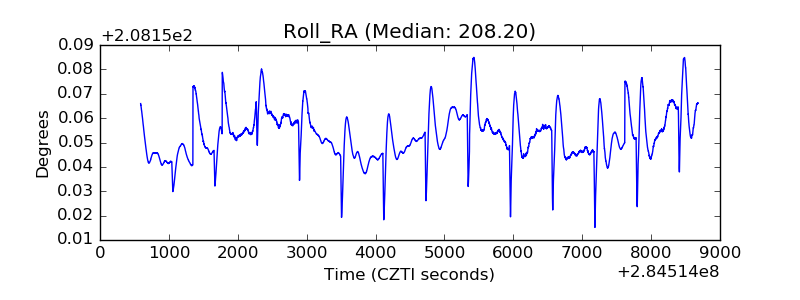 |
| Veto Counter | 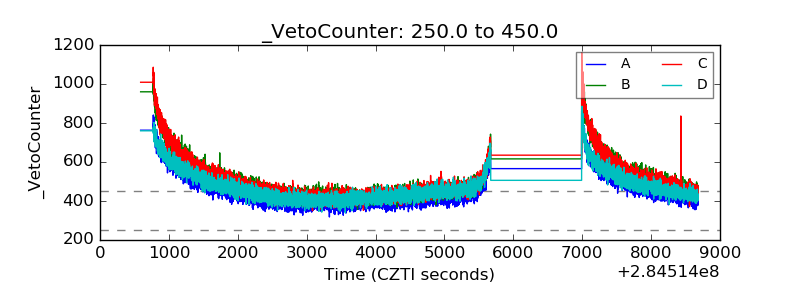 |