| Param | Original file | Final file |
|---|---|---|
| Filename | modeM0/AS1T03_042T01_9000002630_17717cztM0_level2.evt | modeM0/AS1T03_042T01_9000002630_17717cztM0_level2_quad_clean.evt |
| Size (bytes) | 650,332,800 | 91,149,120 |
| Size | 620.2 MB | 86.9 MB |
| Events in quadrant A | 2,842,577 | 622,222 |
| Events in quadrant B | 2,910,112 | 641,938 |
| Events in quadrant C | 3,094,131 | 607,939 |
| Events in quadrant D | 10,443,020 | 469,106 |
| Mode M9 | |||
|---|---|---|---|
| Quadrant | BADHDUFLAG | Total packets | Discarded packets |
| A | 0 | 13 | 0 |
| B | 0 | 13 | 0 |
| C | 0 | 13 | 0 |
| D | 0 | 13 | 0 |
| Mode M0 | |||
|---|---|---|---|
| Quadrant | BADHDUFLAG | Total packets | Discarded packets |
| A | 0 | 12389 | 1 |
| B | 0 | 12420 | 1 |
| C | 0 | 13110 | 1 |
| D | 0 | 35187 | 1 |
| Mode SS | |||
|---|---|---|---|
| Quadrant | BADHDUFLAG | Total packets | Discarded packets |
| A | 0 | 122 | 0 |
| B | 0 | 122 | 0 |
| C | 0 | 122 | 0 |
| D | 0 | 122 | 0 |
| Quadrant | Total seconds | Saturated seconds | Saturation percentage |
|---|---|---|---|
| A | 5988 | 24 | 0.400802% |
| B | 5989 | 36 | 0.601102% |
| C | 5989 | 50 | 0.834864% |
| D | 5989 | 2601 | 43.429621% |
Noise dominated data is calculated using 1-second bins in cleaned event files. If a bin has >2000 counts, and if more than 50% of those come from <1% of pixels, then it is considered to be noise-dominated and hence unusable.
| Quadrant | # 1 sec bins | Bins with >0 counts | Bins with >2000 counts | High rate bins dominated by noise | Noise dominated (total time) | Noise dominated (detector-on time) | Marked lightcurve |
|---|---|---|---|---|---|---|---|
| A | 7318 | 5989 | 0 | 0 | 0.00% | 0.00% | 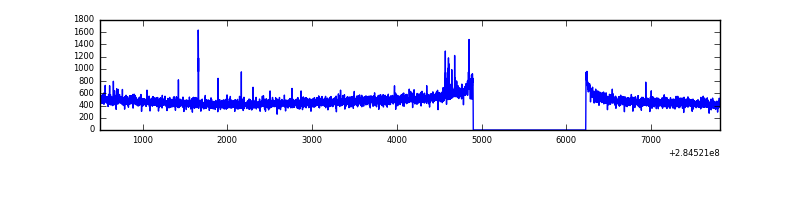 |
| B | 7319 | 5990 | 0 | 0 | 0.00% | 0.00% | 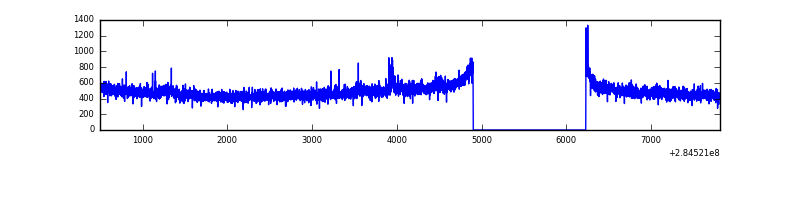 |
| C | 7319 | 5990 | 0 | 0 | 0.00% | 0.00% | 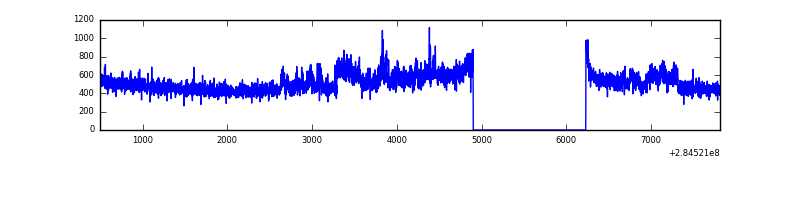 |
| D | 7319 | 5990 | 2396 | 2396 | 32.74% | 40.00% | 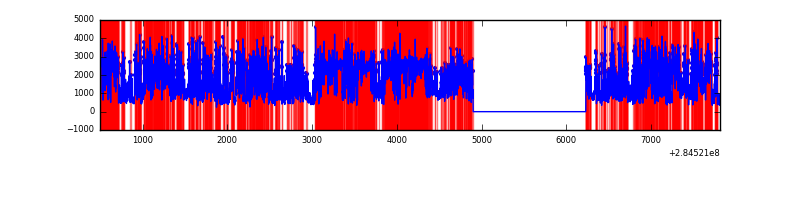 |
Top three noisy pixels from each quadrant. If the there are fewer than three noisy pixels in the level2.evt file, extra rows are filled as -1
| Pixel properties | Quadrant properties | ||||||
|---|---|---|---|---|---|---|---|
| Quadrant | DetID | PixID | Counts | Sigma | Mean | Median | Sigma |
| A | 15 | 174 | 26788 | 176.93 | 733 | 720 | 147.3 |
| A | 0 | 226 | 6360 | 38.28 | 733 | 720 | 147.3 |
| A | 3 | 137 | 5287 | 31.0 | 733 | 720 | 147.3 |
| B | 12 | 111 | 16153 | 111.86 | 737 | 719 | 138.0 |
| B | 11 | 111 | 13870 | 95.31 | 737 | 719 | 138.0 |
| B | 14 | 111 | 12139 | 82.77 | 737 | 719 | 138.0 |
| C | 3 | 233 | 202661 | 1246.17 | 701 | 707 | 162.1 |
| C | 14 | 238 | 111622 | 684.41 | 701 | 707 | 162.1 |
| C | 5 | 218 | 32010 | 193.16 | 701 | 707 | 162.1 |
| D | 7 | 238 | 8121952 | 58409.52 | 553 | 538 | 139.0 |
| D | 1 | 52 | 122757 | 879.0 | 553 | 538 | 139.0 |
| D | 12 | 227 | 49891 | 354.95 | 553 | 538 | 139.0 |
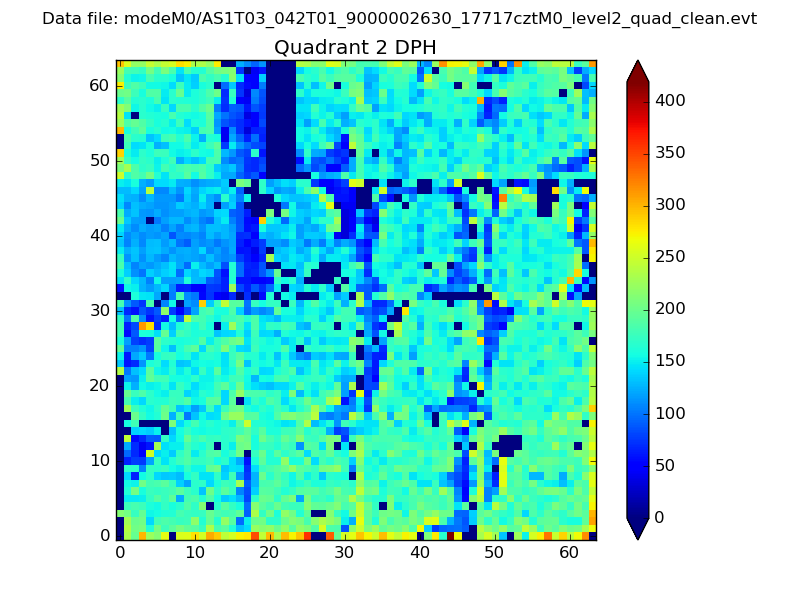
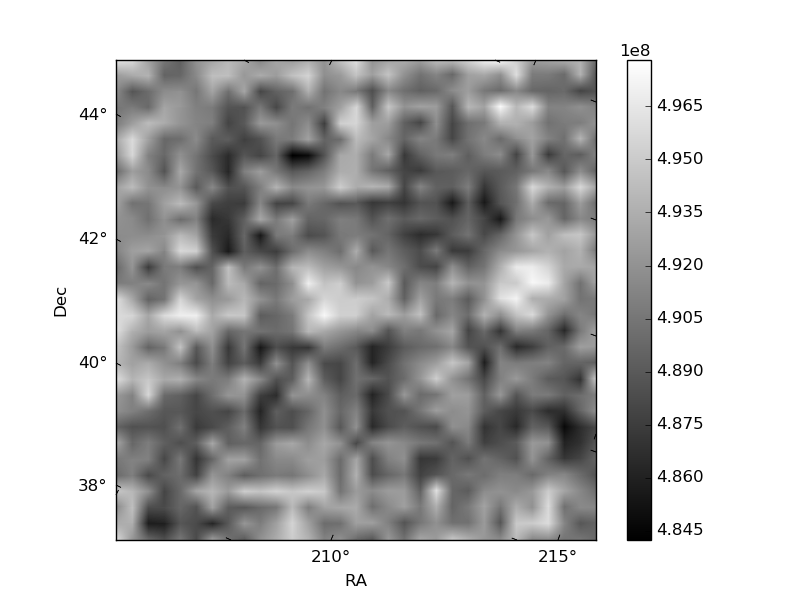
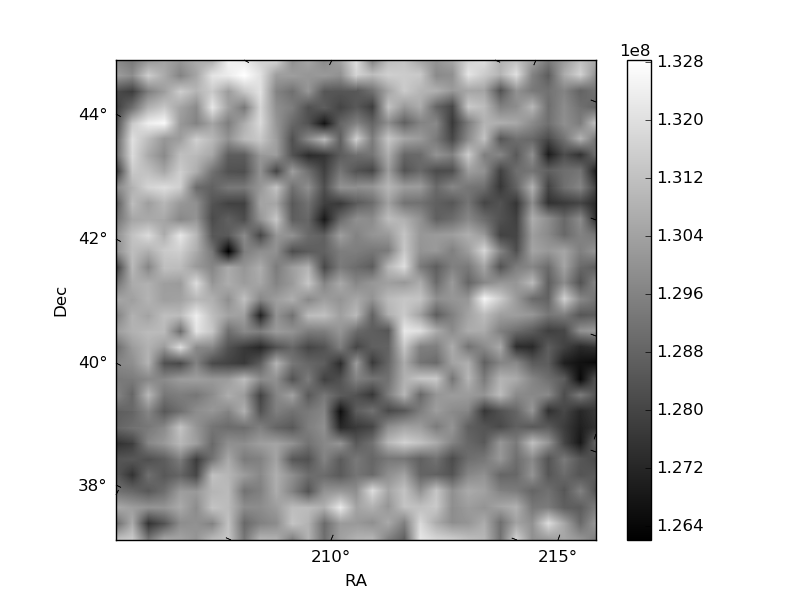
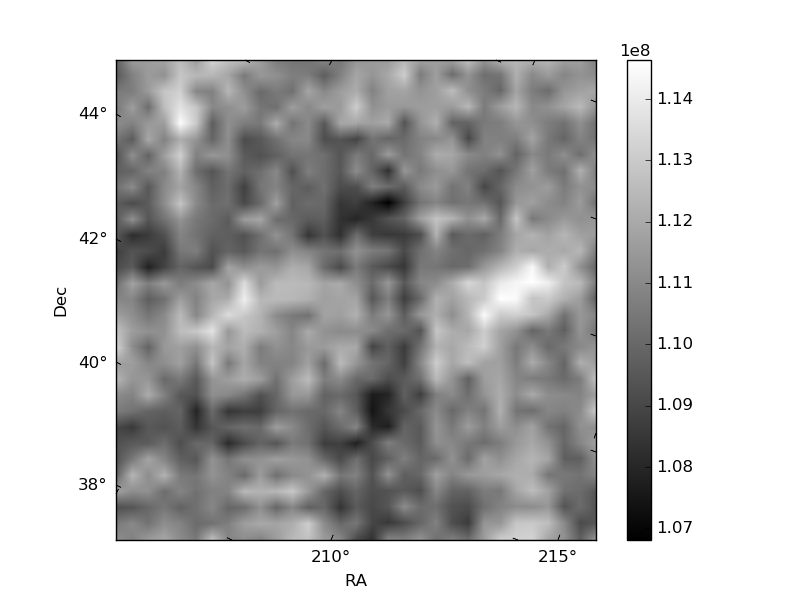
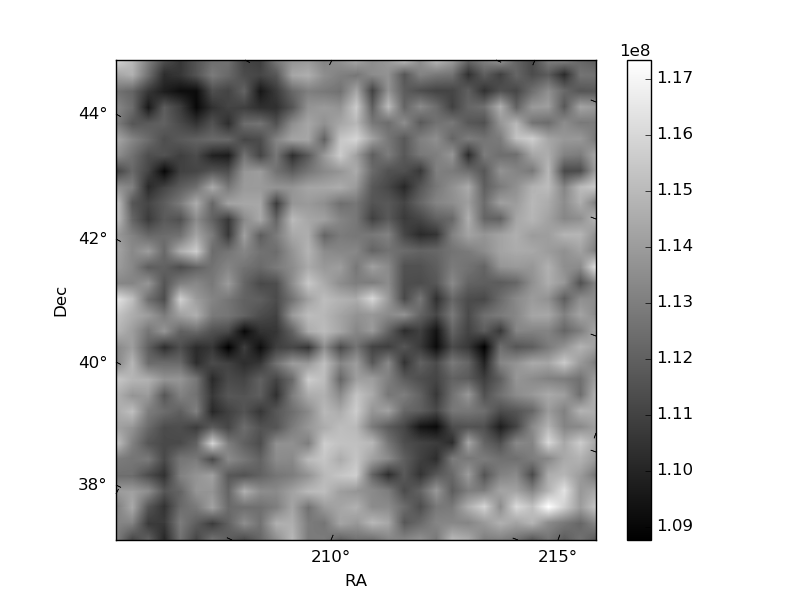
Histogram calculated using DETX and DETY for each event in the final _common_clean file
| Quadrant A | 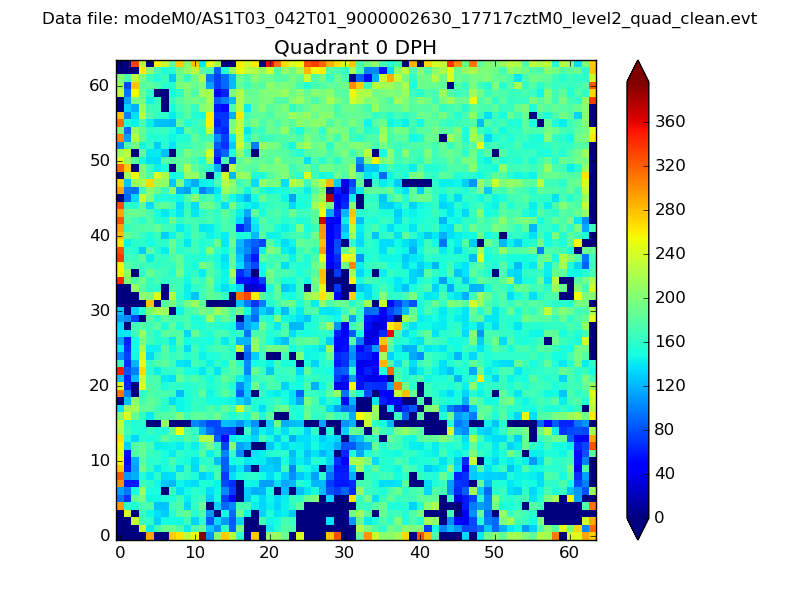 |
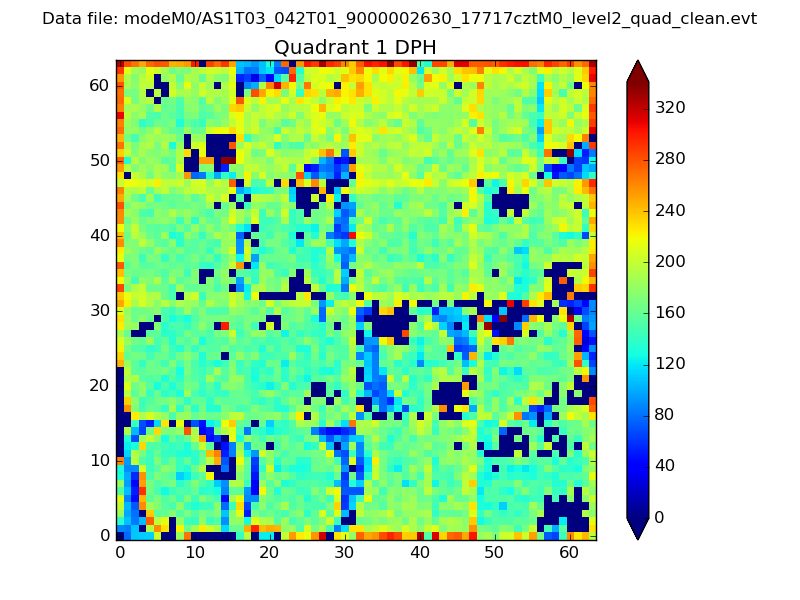 |
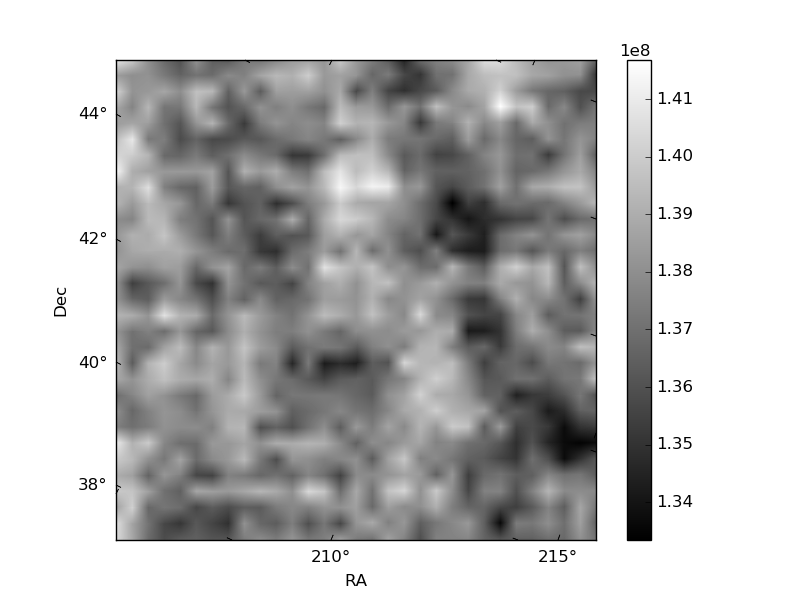
Quadrant B |
|---|---|---|---|
| Quadrant D | 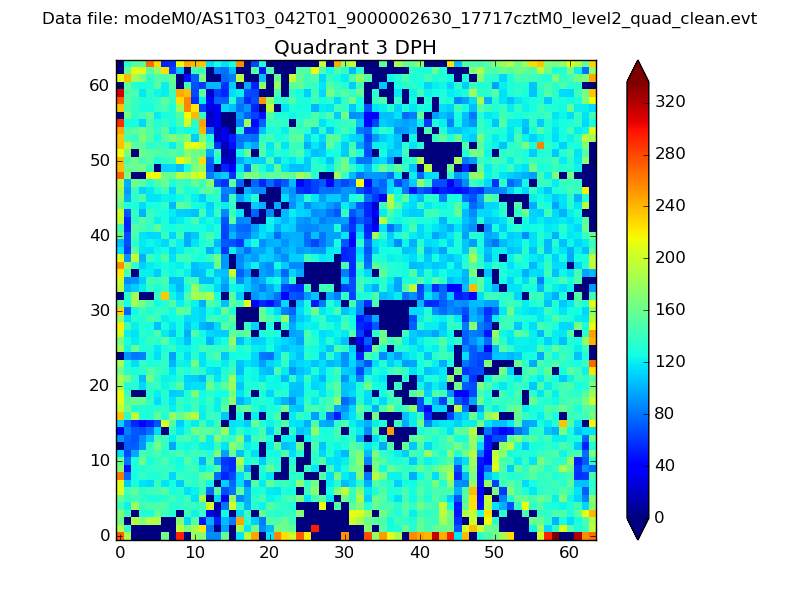 |
 |
Quadrant C |
| Plot type | Count rate plots | Images |
|---|---|---|
| Comparison with Poisson distribution Blue bars denote a histogram of data divided into 1 sec bins. Red curve is a Poisson curve with rate = median count rate of data. |
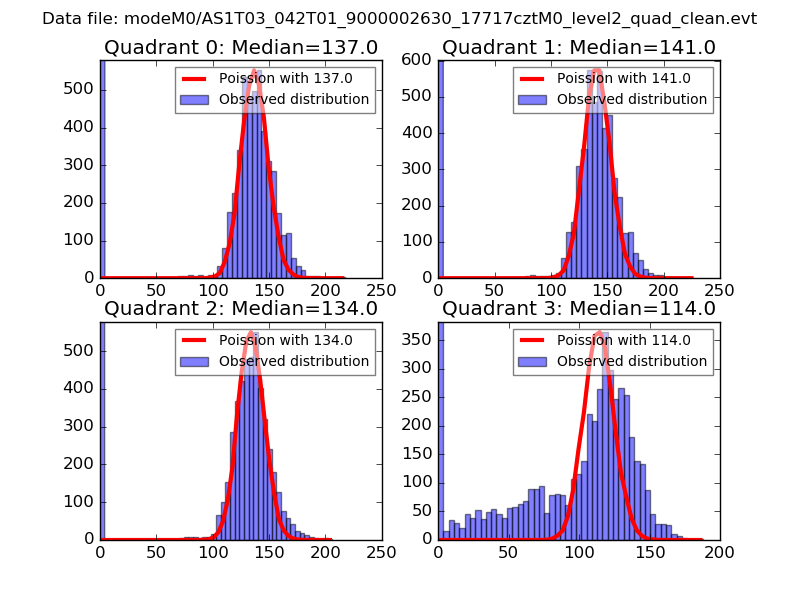 |
 |
| Quadrant-wise count rates Data is divided into 100 sec bins |
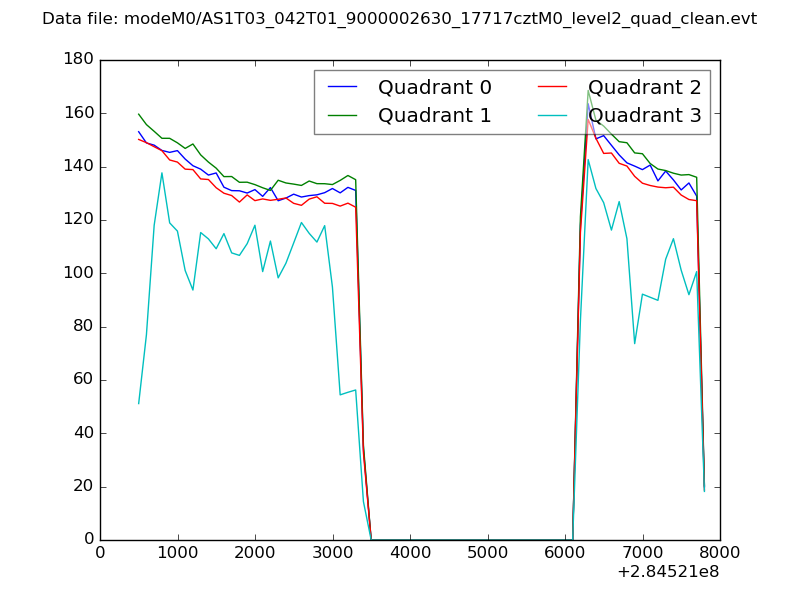 |
|
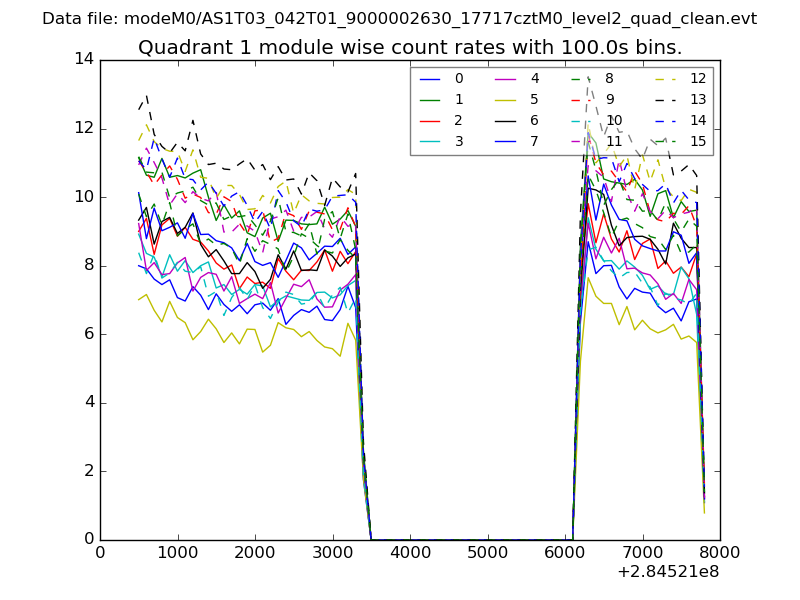
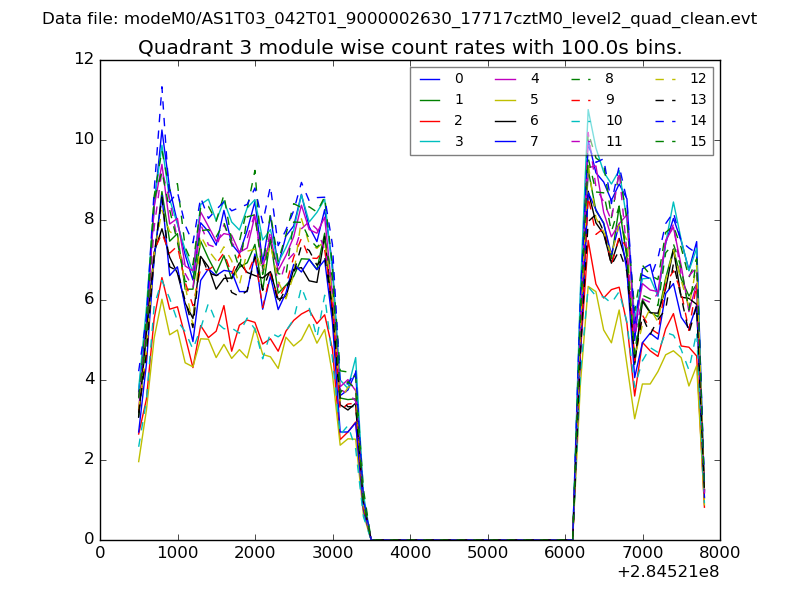
| Module-wise count rates for Quadrant A Data is divided into 100 sec bins |
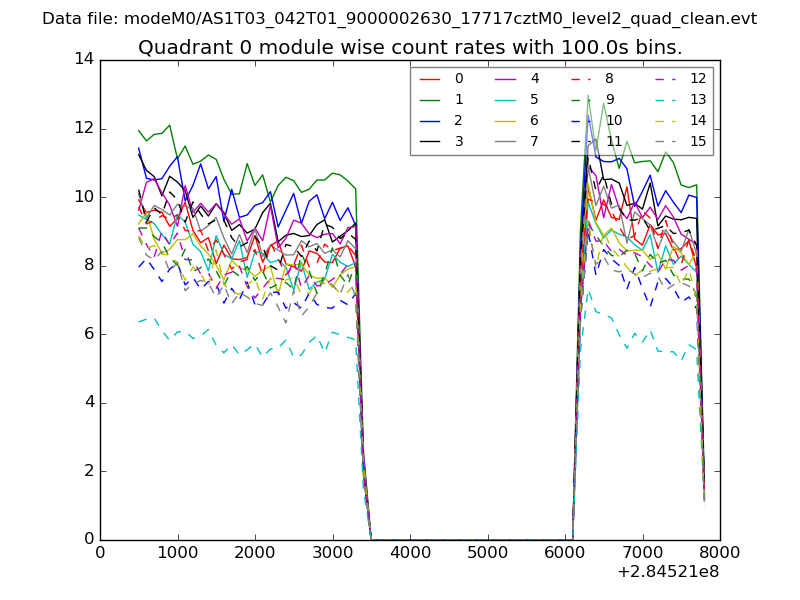 |
 |
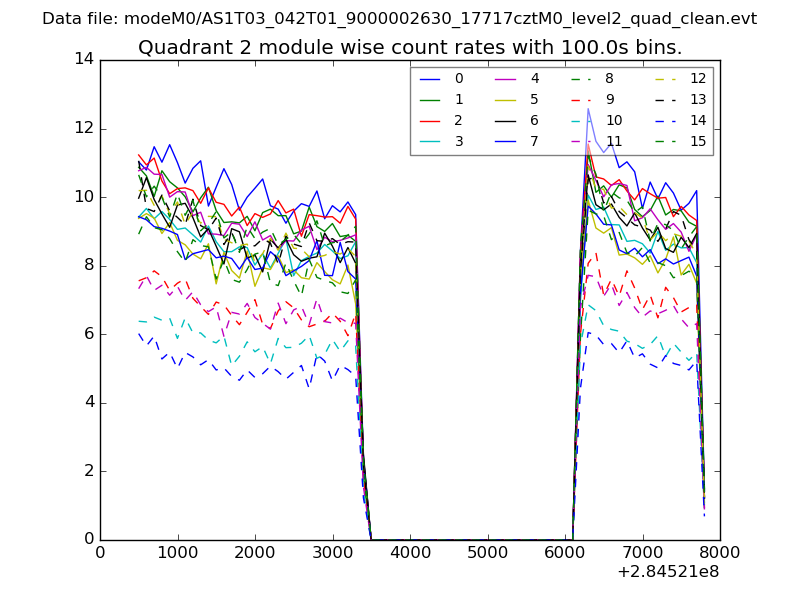
| Module-wise count rates for Quadrant B Data is divided into 100 sec bins |
 |
 |
| Module-wise count rates for Quadrant C Data is divided into 100 sec bins |
 |
 |
| Module-wise count rates for Quadrant D Data is divided into 100 sec bins |
 |
 |
| Parameter | Plot |
|---|---|
| CZT HV Monitor | 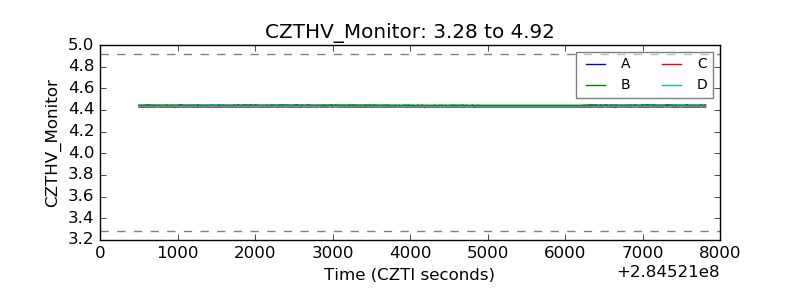 |
| D_VDD | 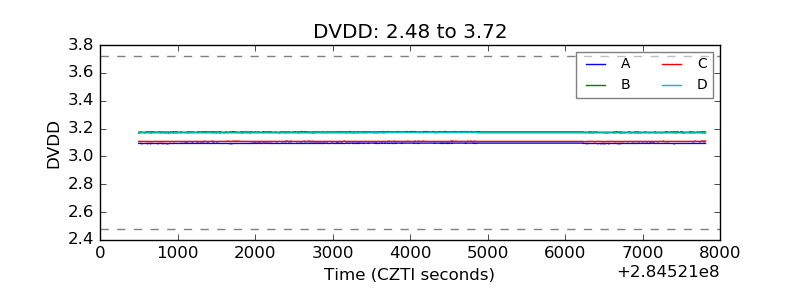 |
| Temperature 1 | 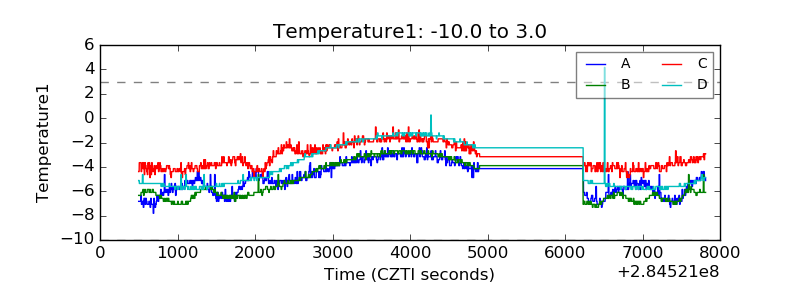 |
| Veto HV Monitor | 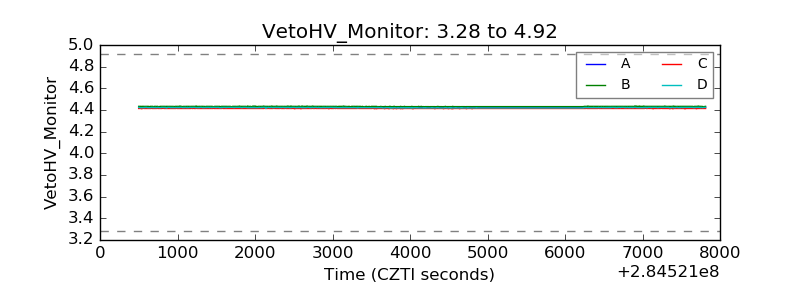 |
| Veto LLD | 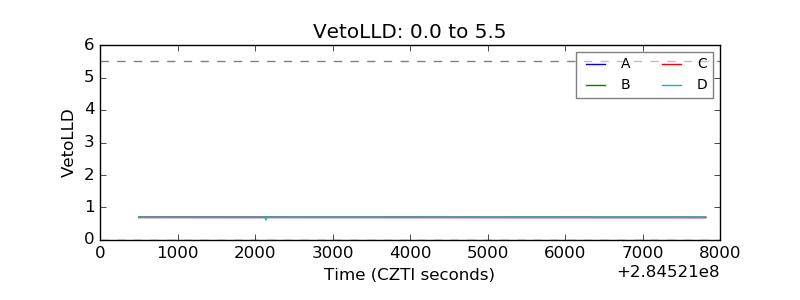 |
| Alpha Counter | 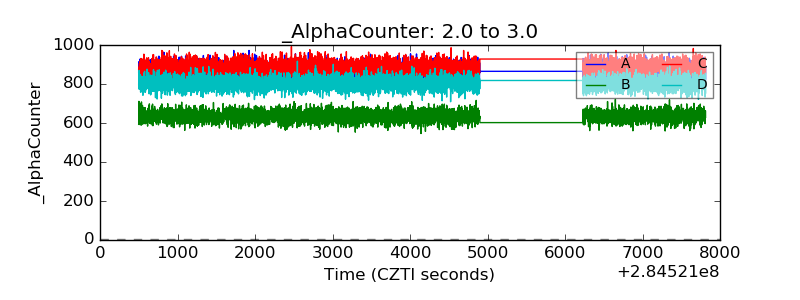 |
| _CPM_Rate | 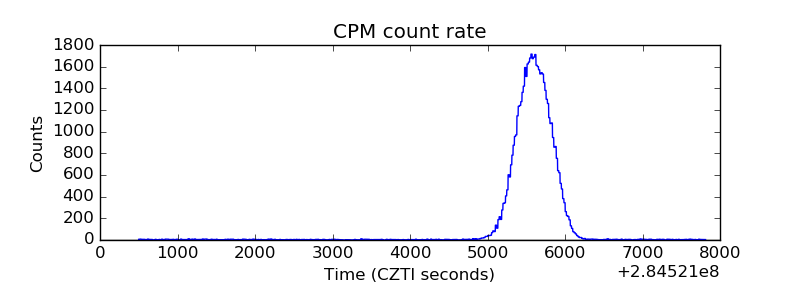 |
| CZT Counter | 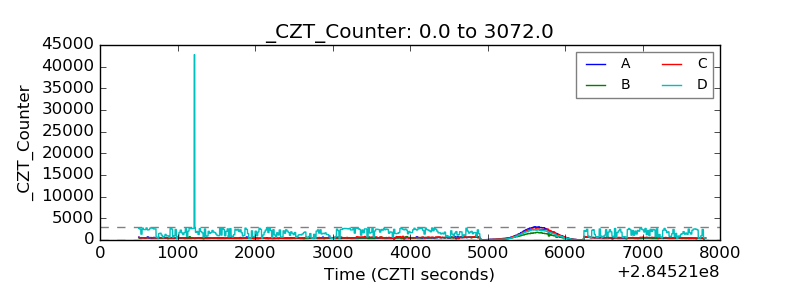 |
| +2.5 Volts monitor | 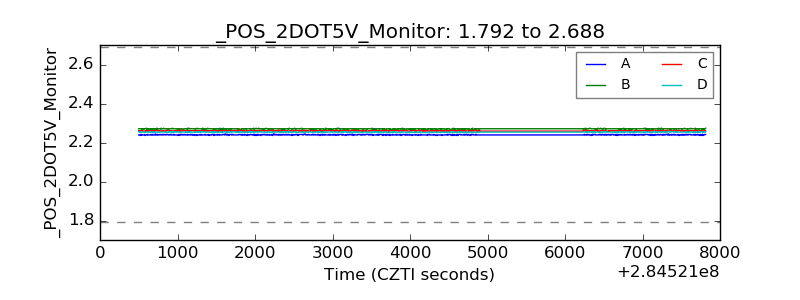 |
| +5 Volts monitor | 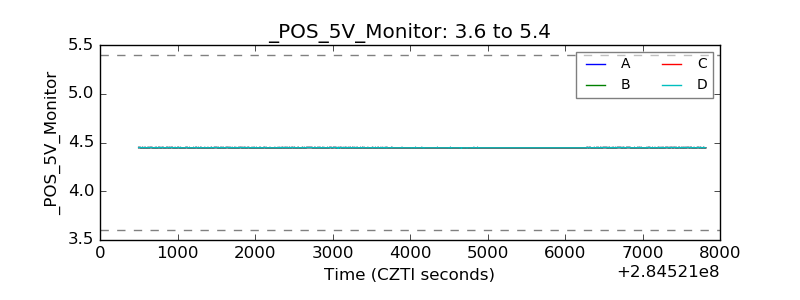 |
| _ROLL_ROT | 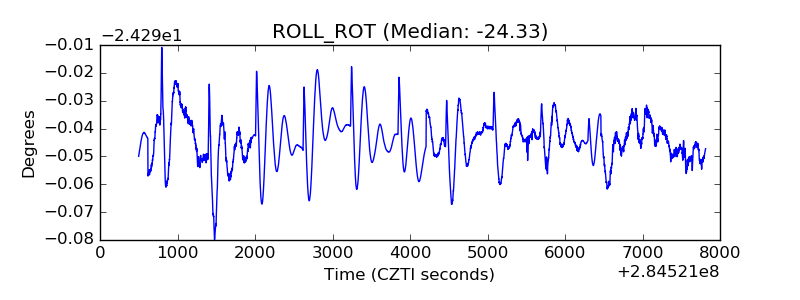 |
| _Roll_DEC | 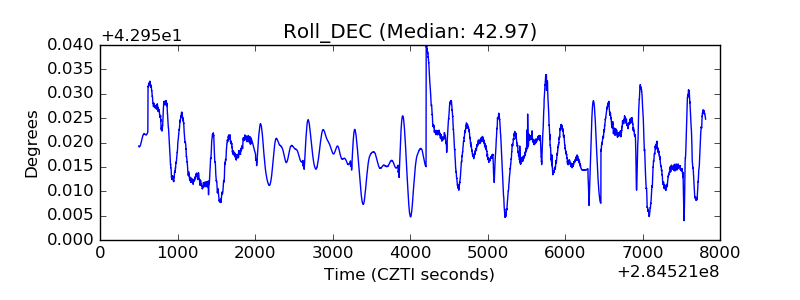 |
| _Roll_RA | 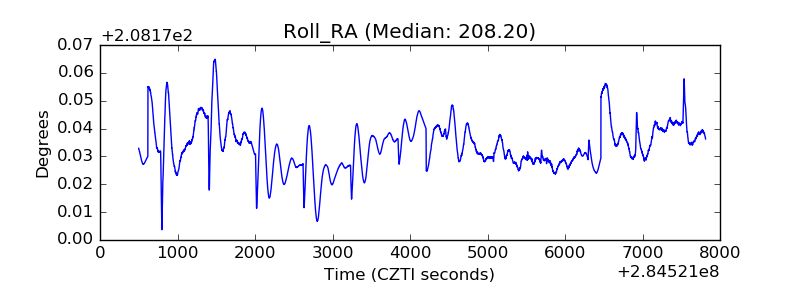 |
| Veto Counter | 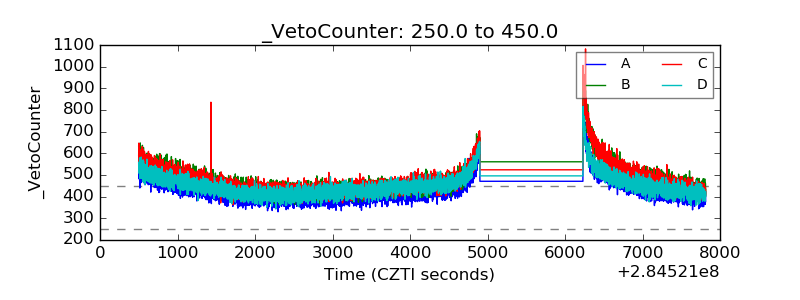 |