| Param | Original file | Final file |
|---|---|---|
| Filename | modeM0/AS1T03_042T01_9000002630_17718cztM0_level2.evt | modeM0/AS1T03_042T01_9000002630_17718cztM0_level2_quad_clean.evt |
| Size (bytes) | 585,118,080 | 92,096,640 |
| Size | 558.0 MB | 87.8 MB |
| Events in quadrant A | 3,079,868 | 601,897 |
| Events in quadrant B | 3,194,093 | 619,676 |
| Events in quadrant C | 3,279,310 | 584,823 |
| Events in quadrant D | 7,720,148 | 522,835 |
| Mode M9 | |||
|---|---|---|---|
| Quadrant | BADHDUFLAG | Total packets | Discarded packets |
| A | 0 | 11 | 0 |
| B | 0 | 11 | 0 |
| C | 0 | 11 | 0 |
| D | 0 | 11 | 0 |
| Mode M0 | |||
|---|---|---|---|
| Quadrant | BADHDUFLAG | Total packets | Discarded packets |
| A | 0 | 13550 | 1 |
| B | 0 | 13733 | 1 |
| C | 0 | 13883 | 1 |
| D | 0 | 27705 | 1 |
| Mode SS | |||
|---|---|---|---|
| Quadrant | BADHDUFLAG | Total packets | Discarded packets |
| A | 0 | 136 | 0 |
| B | 0 | 136 | 0 |
| C | 0 | 136 | 0 |
| D | 0 | 136 | 0 |
| Quadrant | Total seconds | Saturated seconds | Saturation percentage |
|---|---|---|---|
| A | 6581 | 35 | 0.531834% |
| B | 6581 | 59 | 0.896520% |
| C | 6582 | 74 | 1.124278% |
| D | 6582 | 1632 | 24.794895% |
Noise dominated data is calculated using 1-second bins in cleaned event files. If a bin has >2000 counts, and if more than 50% of those come from <1% of pixels, then it is considered to be noise-dominated and hence unusable.
| Quadrant | # 1 sec bins | Bins with >0 counts | Bins with >2000 counts | High rate bins dominated by noise | Noise dominated (total time) | Noise dominated (detector-on time) | Marked lightcurve |
|---|---|---|---|---|---|---|---|
| A | 7756 | 6582 | 3 | 3 | 0.04% | 0.05% | 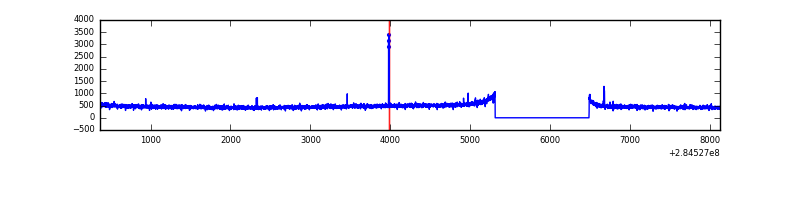 |
| B | 7756 | 6582 | 0 | 0 | 0.00% | 0.00% | 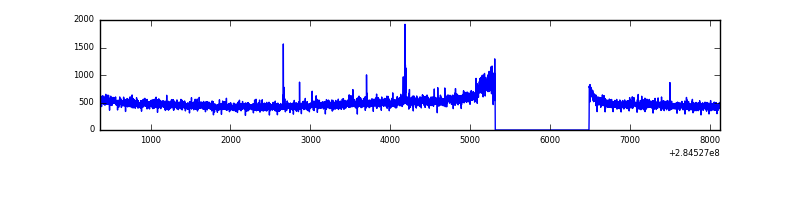 |
| C | 7757 | 6583 | 0 | 0 | 0.00% | 0.00% | 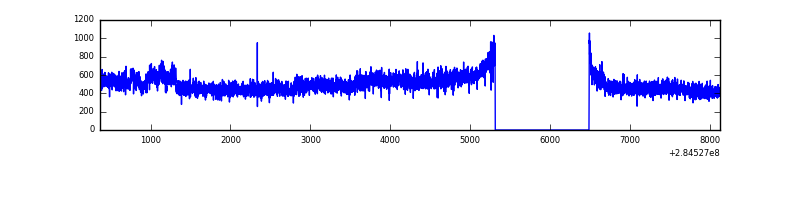 |
| D | 7757 | 6582 | 1405 | 1405 | 18.11% | 21.35% | 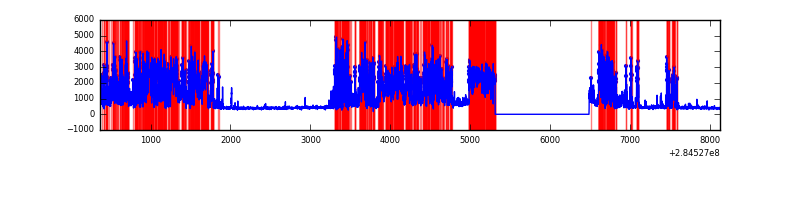 |
Top three noisy pixels from each quadrant. If the there are fewer than three noisy pixels in the level2.evt file, extra rows are filled as -1
| Pixel properties | Quadrant properties | ||||||
|---|---|---|---|---|---|---|---|
| Quadrant | DetID | PixID | Counts | Sigma | Mean | Median | Sigma |
| A | 15 | 174 | 19249 | 114.36 | 796 | 780 | 161.5 |
| A | 0 | 226 | 6817 | 37.38 | 796 | 780 | 161.5 |
| A | 12 | 194 | 5927 | 31.87 | 796 | 780 | 161.5 |
| B | 0 | 189 | 37859 | 248.32 | 797 | 776 | 149.3 |
| B | 0 | 219 | 20044 | 129.02 | 797 | 776 | 149.3 |
| B | 12 | 111 | 17797 | 113.98 | 797 | 776 | 149.3 |
| C | 3 | 233 | 178835 | 1011.84 | 759 | 763 | 176.0 |
| C | 14 | 238 | 119940 | 677.19 | 759 | 763 | 176.0 |
| C | 5 | 218 | 21796 | 119.51 | 759 | 763 | 176.0 |
| D | 7 | 238 | 5045254 | 29280.55 | 674 | 656 | 172.3 |
| D | 1 | 52 | 37090 | 211.48 | 674 | 656 | 172.3 |
| D | 7 | 223 | 33220 | 189.01 | 674 | 656 | 172.3 |
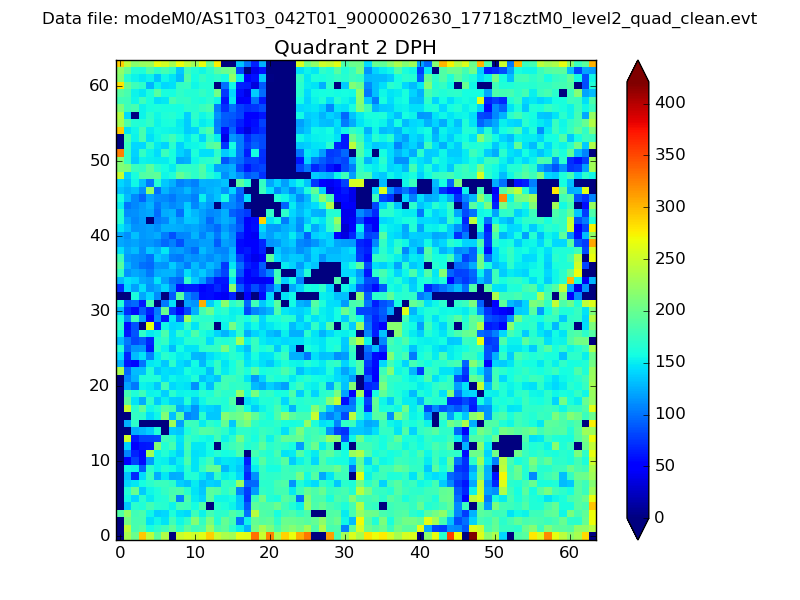
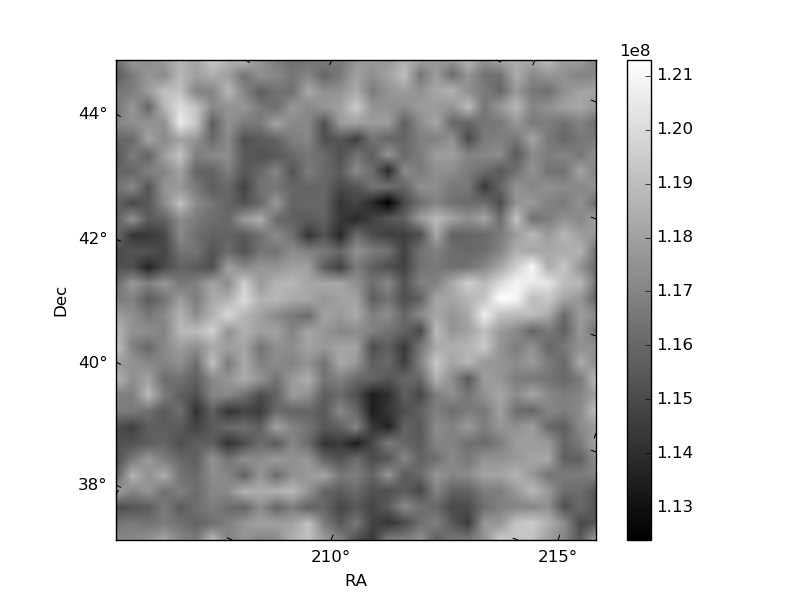
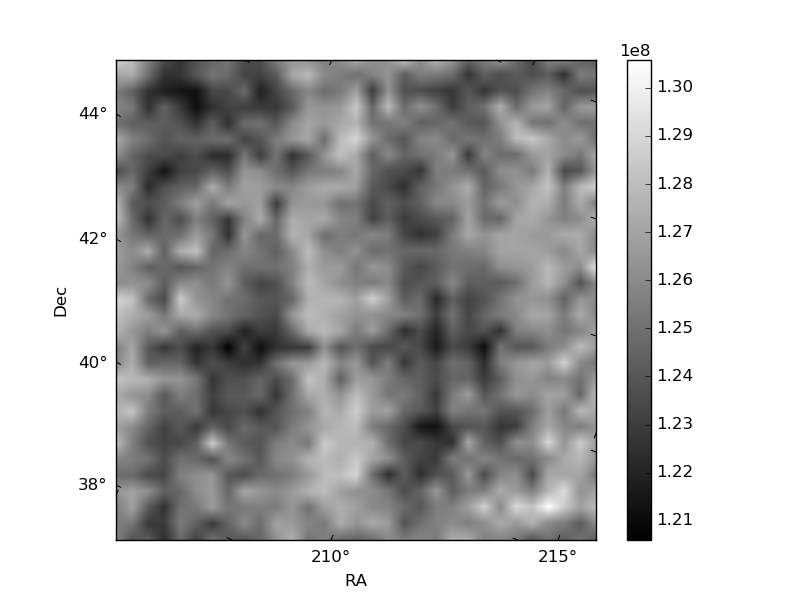
Histogram calculated using DETX and DETY for each event in the final _common_clean file
| Quadrant A | 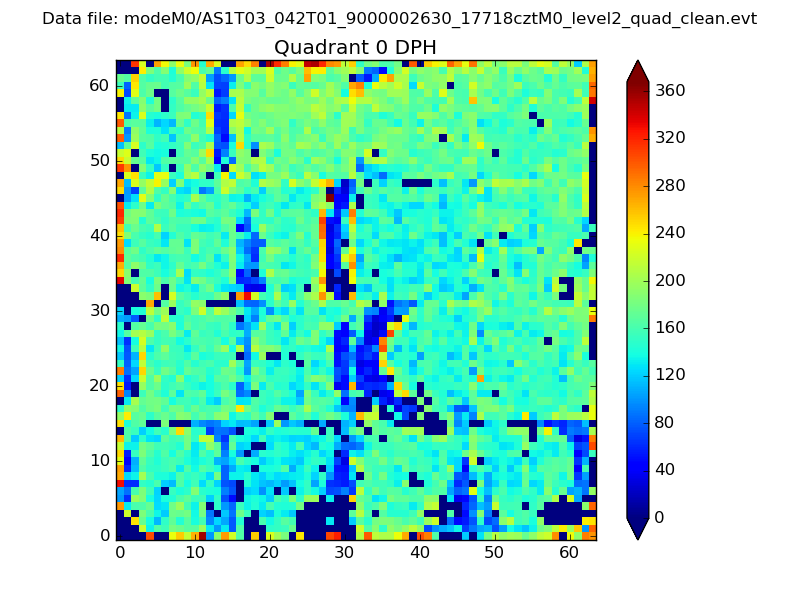 |
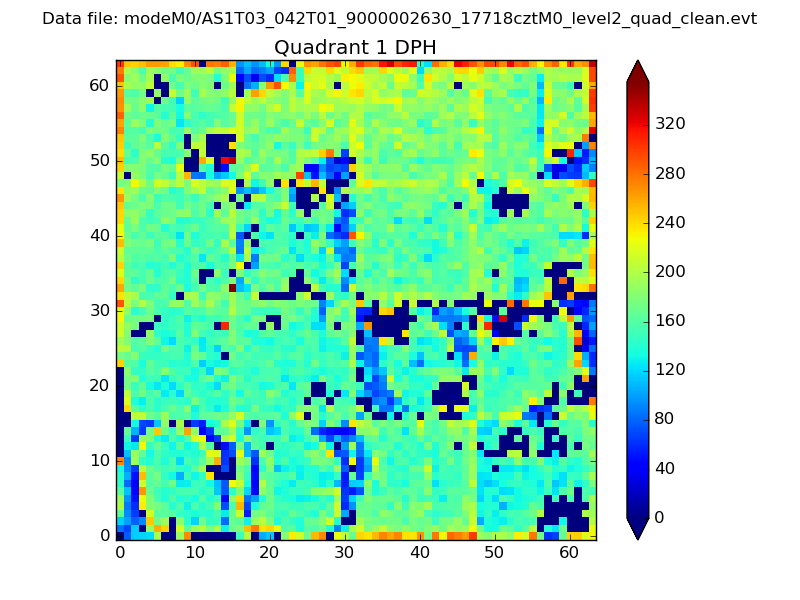 |
Quadrant B |
|---|---|---|---|
| Quadrant D | 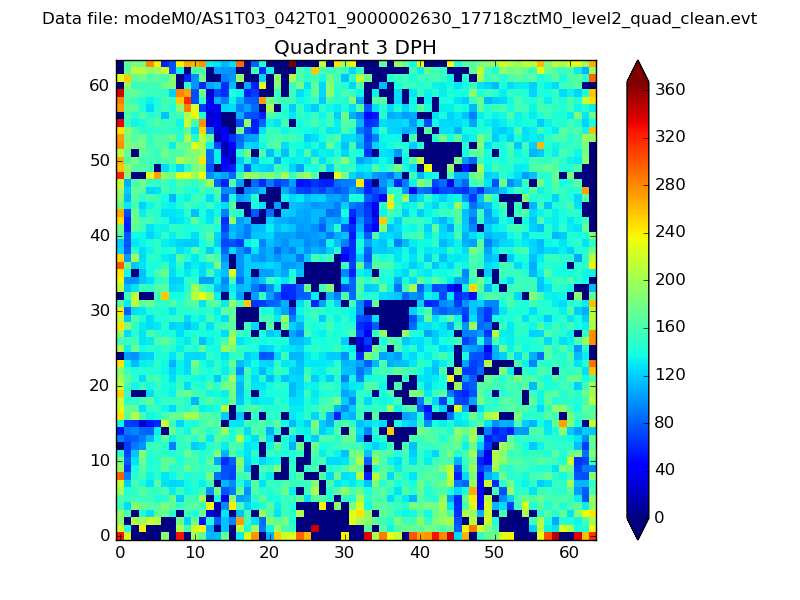 |
 |
Quadrant C |
| Plot type | Count rate plots | Images |
|---|---|---|
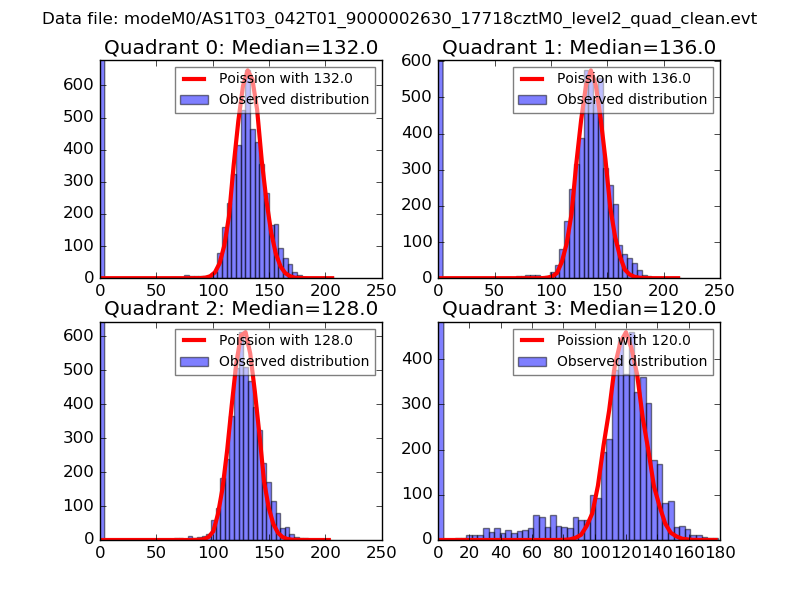
| Comparison with Poisson distribution Blue bars denote a histogram of data divided into 1 sec bins. Red curve is a Poisson curve with rate = median count rate of data. |
 |
 |
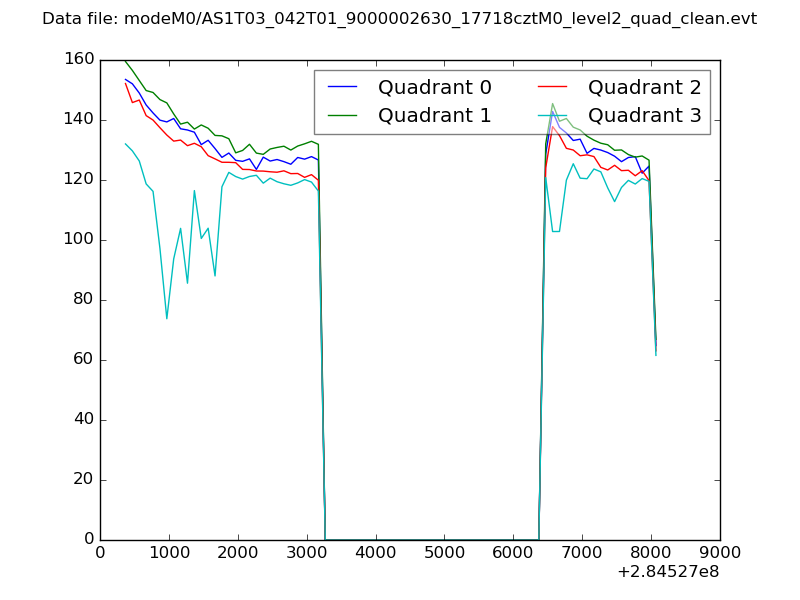
| Quadrant-wise count rates Data is divided into 100 sec bins |
 |
|
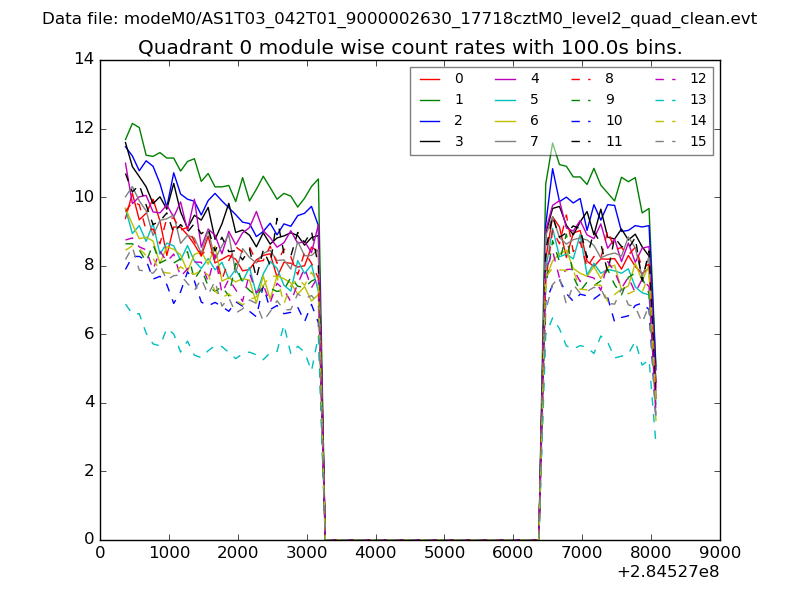
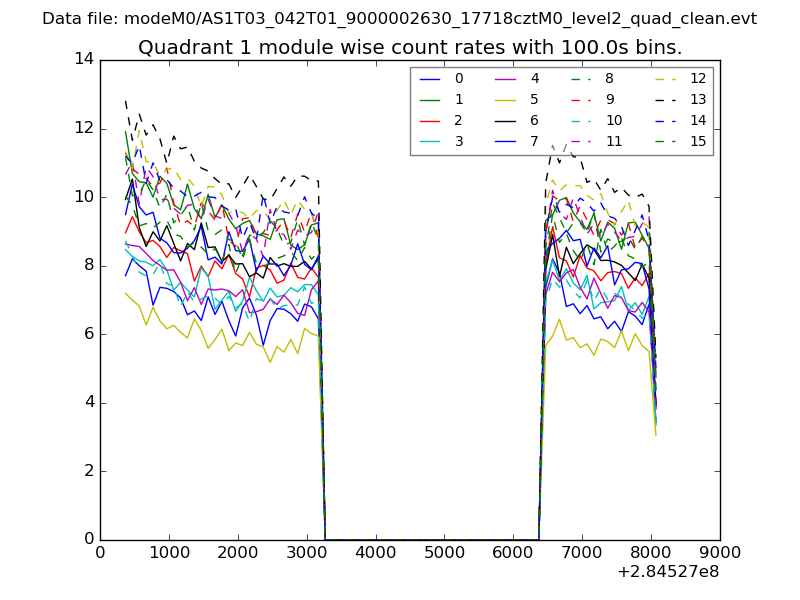
| Module-wise count rates for Quadrant A Data is divided into 100 sec bins |
 |
 |
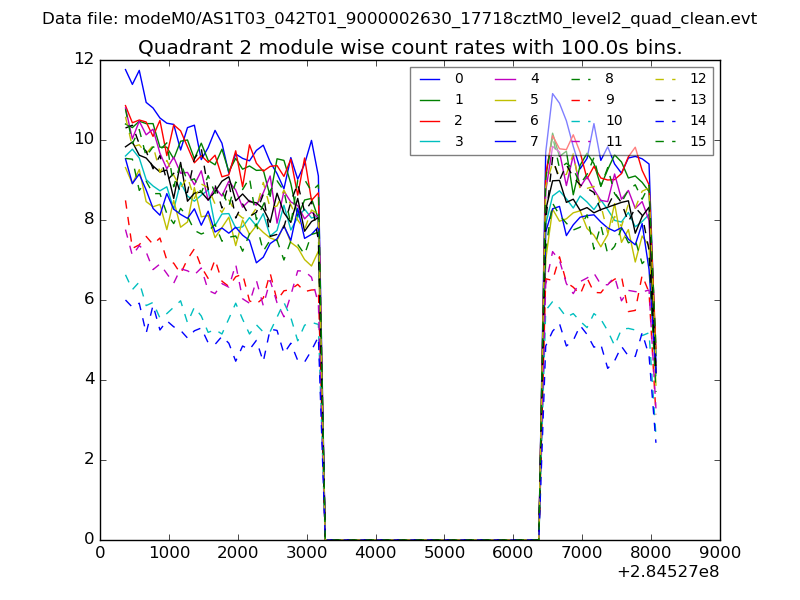
| Module-wise count rates for Quadrant B Data is divided into 100 sec bins |
 |
 |
| Module-wise count rates for Quadrant C Data is divided into 100 sec bins |
 |
 |
| Module-wise count rates for Quadrant D Data is divided into 100 sec bins |
 |
 |
| Parameter | Plot |
|---|---|
| CZT HV Monitor | 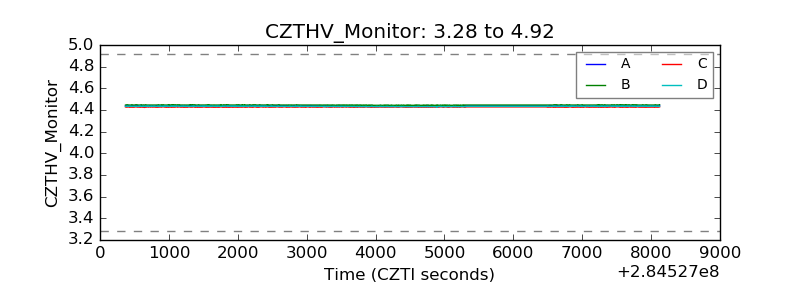 |
| D_VDD | 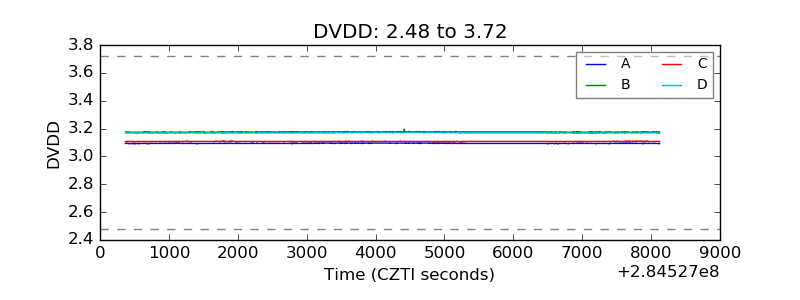 |
| Temperature 1 | 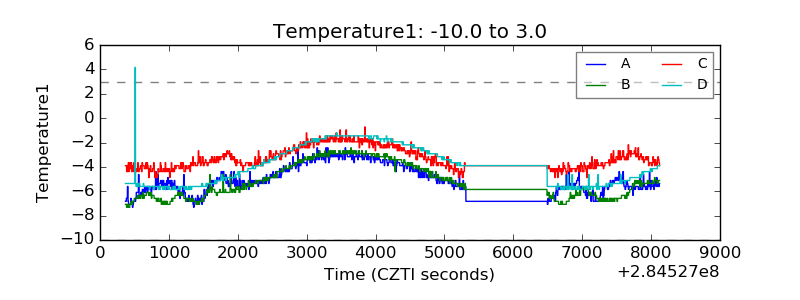 |
| Veto HV Monitor | 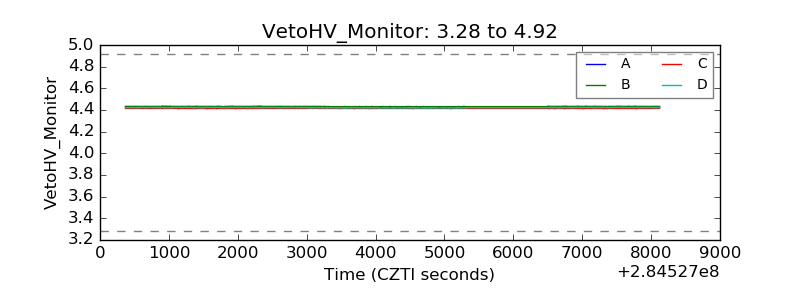 |
| Veto LLD | 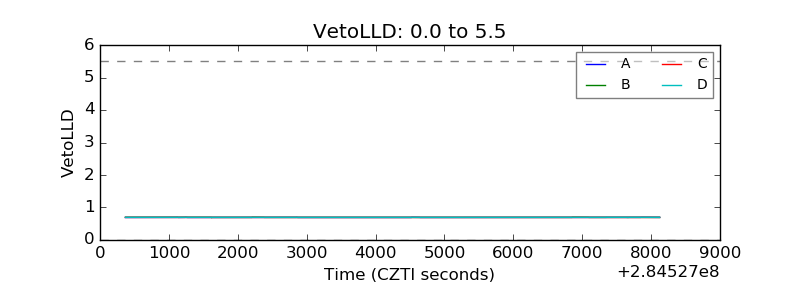 |
| Alpha Counter | 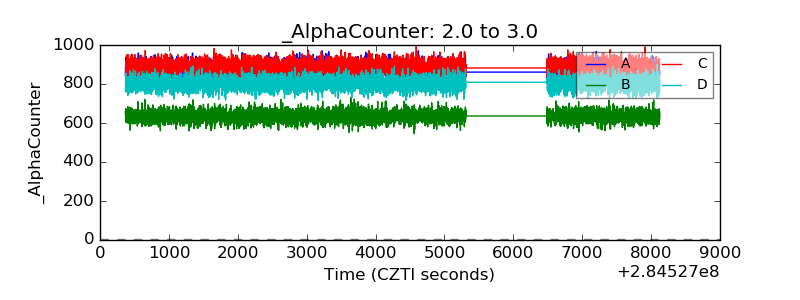 |
| _CPM_Rate | 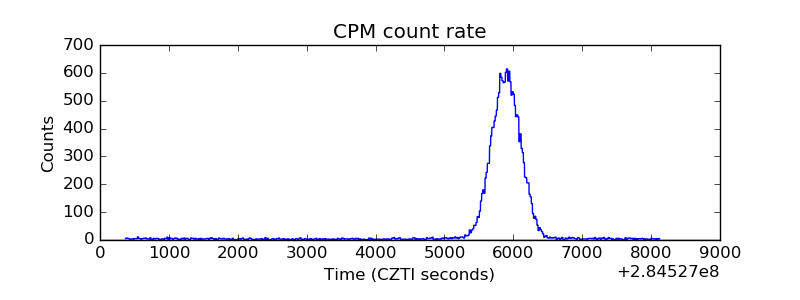 |
| CZT Counter | 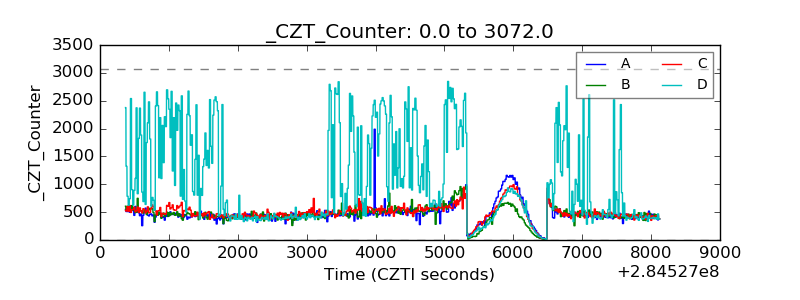 |
| +2.5 Volts monitor |  |
| +5 Volts monitor |  |
| _ROLL_ROT |  |
| _Roll_DEC | 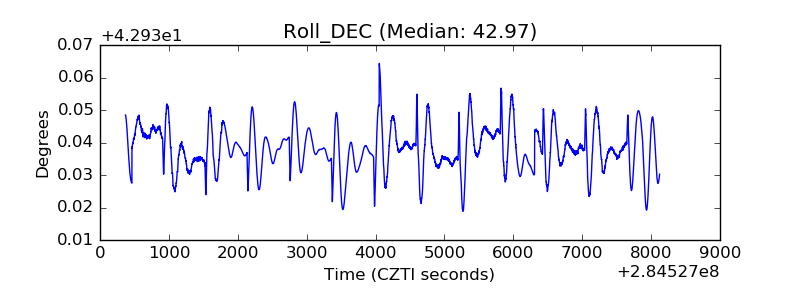 |
| _Roll_RA | 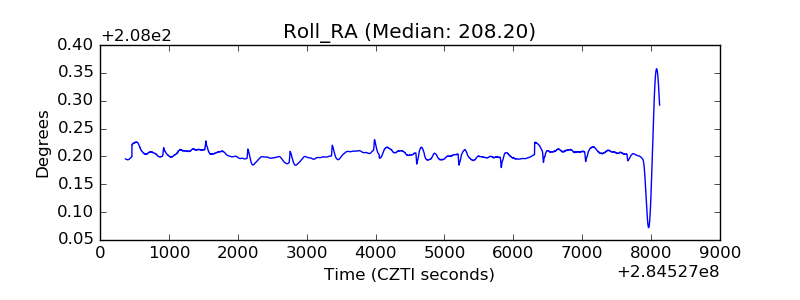 |
| Veto Counter | 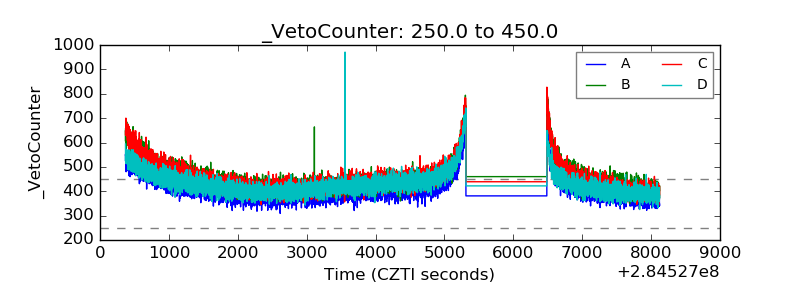 |