| Param | Original file | Final file |
|---|---|---|
| Filename | modeM0/AS1T03_042T01_9000002630_17719cztM0_level2.evt | modeM0/AS1T03_042T01_9000002630_17719cztM0_level2_quad_clean.evt |
| Size (bytes) | 478,293,120 | 86,348,160 |
| Size | 456.1 MB | 82.3 MB |
| Events in quadrant A | 2,959,779 | 551,514 |
| Events in quadrant B | 3,068,861 | 563,595 |
| Events in quadrant C | 3,266,700 | 536,022 |
| Events in quadrant D | 4,751,325 | 513,560 |
| Mode M9 | |||
|---|---|---|---|
| Quadrant | BADHDUFLAG | Total packets | Discarded packets |
| A | 0 | 9 | 0 |
| B | 0 | 9 | 0 |
| C | 0 | 9 | 0 |
| D | 0 | 9 | 0 |
| Mode M0 | |||
|---|---|---|---|
| Quadrant | BADHDUFLAG | Total packets | Discarded packets |
| A | 0 | 13193 | 1 |
| B | 0 | 13351 | 1 |
| C | 0 | 13792 | 1 |
| D | 0 | 18796 | 1 |
| Mode SS | |||
|---|---|---|---|
| Quadrant | BADHDUFLAG | Total packets | Discarded packets |
| A | 0 | 130 | 0 |
| B | 0 | 130 | 0 |
| C | 0 | 130 | 0 |
| D | 0 | 130 | 0 |
| Quadrant | Total seconds | Saturated seconds | Saturation percentage |
|---|---|---|---|
| A | 6456 | 49 | 0.758984% |
| B | 6457 | 62 | 0.960198% |
| C | 6457 | 86 | 1.331888% |
| D | 6457 | 532 | 8.239120% |
Noise dominated data is calculated using 1-second bins in cleaned event files. If a bin has >2000 counts, and if more than 50% of those come from <1% of pixels, then it is considered to be noise-dominated and hence unusable.
| Quadrant | # 1 sec bins | Bins with >0 counts | Bins with >2000 counts | High rate bins dominated by noise | Noise dominated (total time) | Noise dominated (detector-on time) | Marked lightcurve |
|---|---|---|---|---|---|---|---|
| A | 7306 | 6457 | 0 | 0 | 0.00% | 0.00% | 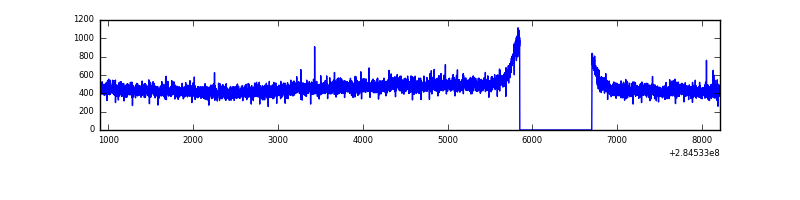 |
| B | 7307 | 6458 | 1 | 1 | 0.01% | 0.02% | 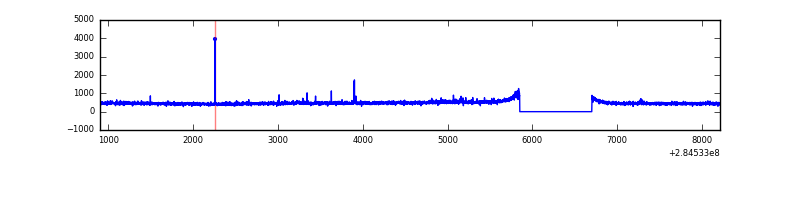 |
| C | 7307 | 6458 | 0 | 0 | 0.00% | 0.00% |  |
| D | 7307 | 6457 | 415 | 415 | 5.68% | 6.43% | 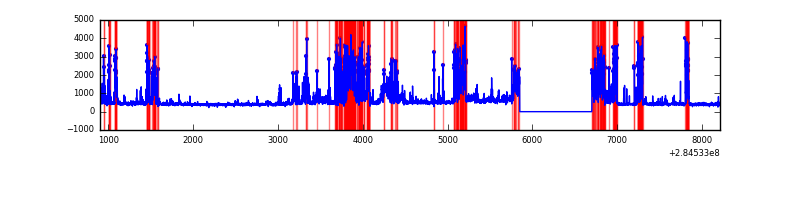 |
Top three noisy pixels from each quadrant. If the there are fewer than three noisy pixels in the level2.evt file, extra rows are filled as -1
| Pixel properties | Quadrant properties | ||||||
|---|---|---|---|---|---|---|---|
| Quadrant | DetID | PixID | Counts | Sigma | Mean | Median | Sigma |
| A | 0 | 226 | 6523 | 36.93 | 768 | 751 | 156.3 |
| A | 12 | 194 | 5801 | 32.31 | 768 | 751 | 156.3 |
| A | 3 | 137 | 5782 | 32.19 | 768 | 751 | 156.3 |
| B | 0 | 219 | 38092 | 253.31 | 766 | 747 | 147.4 |
| B | 12 | 111 | 17496 | 113.61 | 766 | 747 | 147.4 |
| B | 11 | 111 | 15233 | 98.26 | 766 | 747 | 147.4 |
| C | 3 | 233 | 301733 | 1772.92 | 727 | 733 | 169.8 |
| C | 14 | 238 | 112368 | 657.54 | 727 | 733 | 169.8 |
| C | 5 | 218 | 15573 | 87.41 | 727 | 733 | 169.8 |
| D | 7 | 238 | 1784111 | 9503.97 | 708 | 694 | 187.6 |
| D | 13 | 232 | 191794 | 1018.39 | 708 | 694 | 187.6 |
| D | 2 | 234 | 26245 | 136.16 | 708 | 694 | 187.6 |
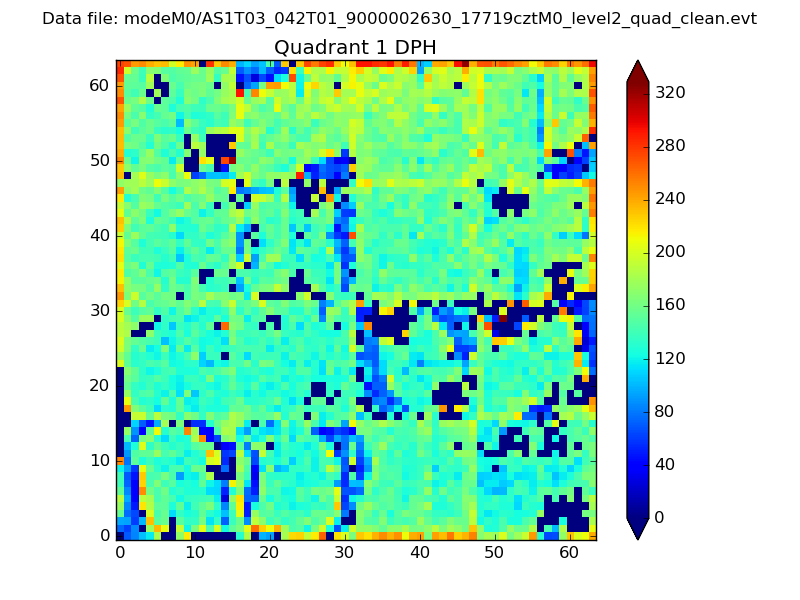
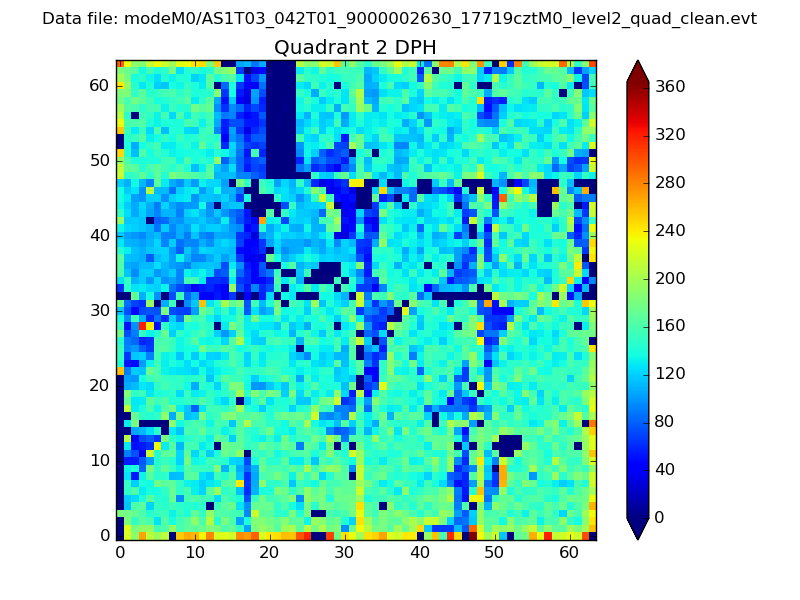
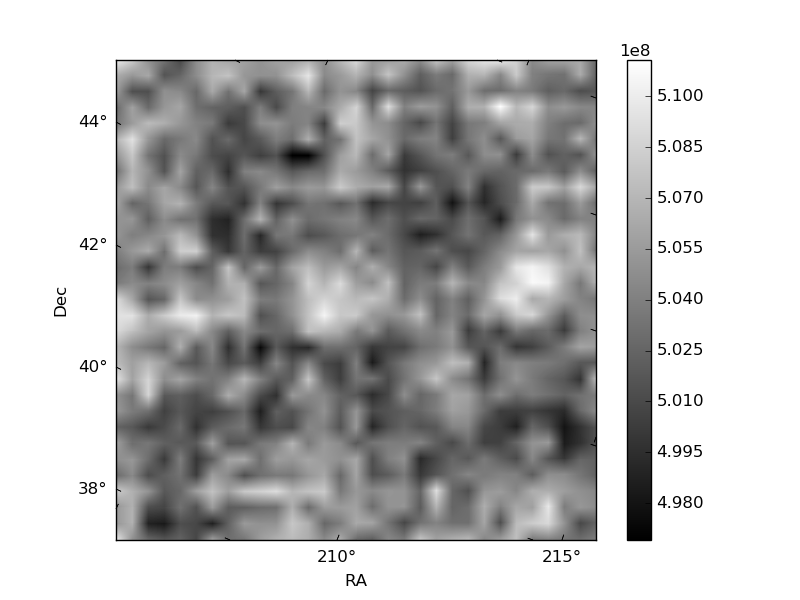
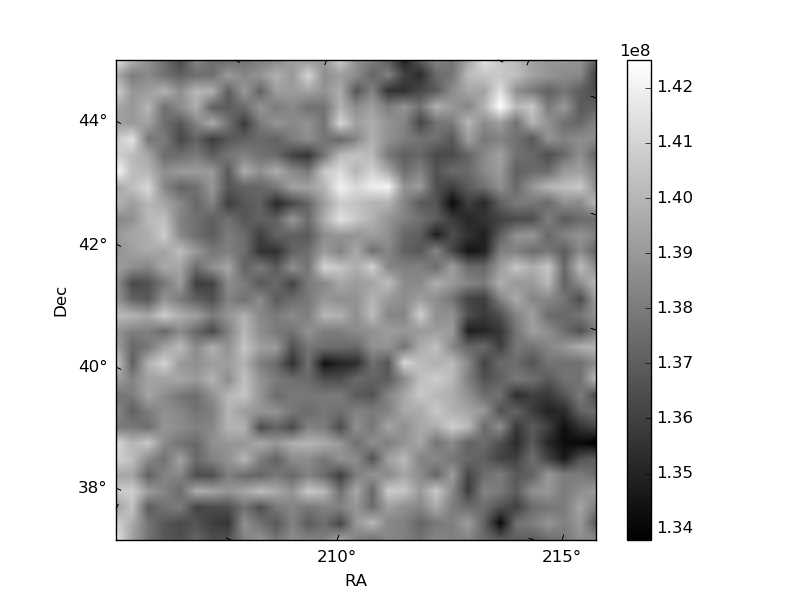
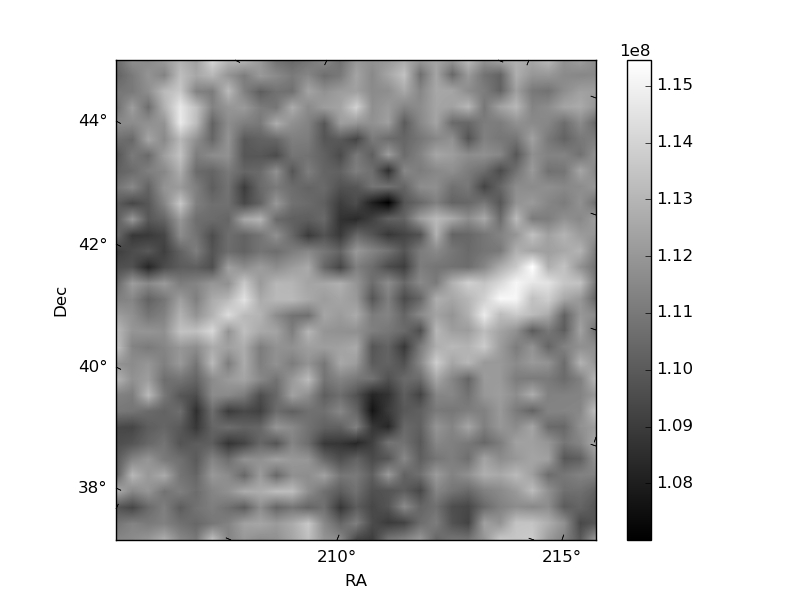
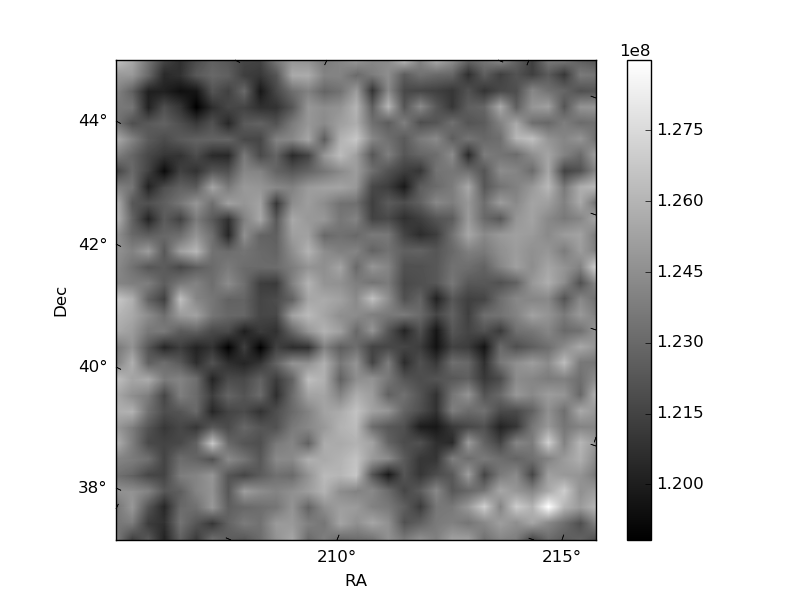
Histogram calculated using DETX and DETY for each event in the final _common_clean file
| Quadrant A | 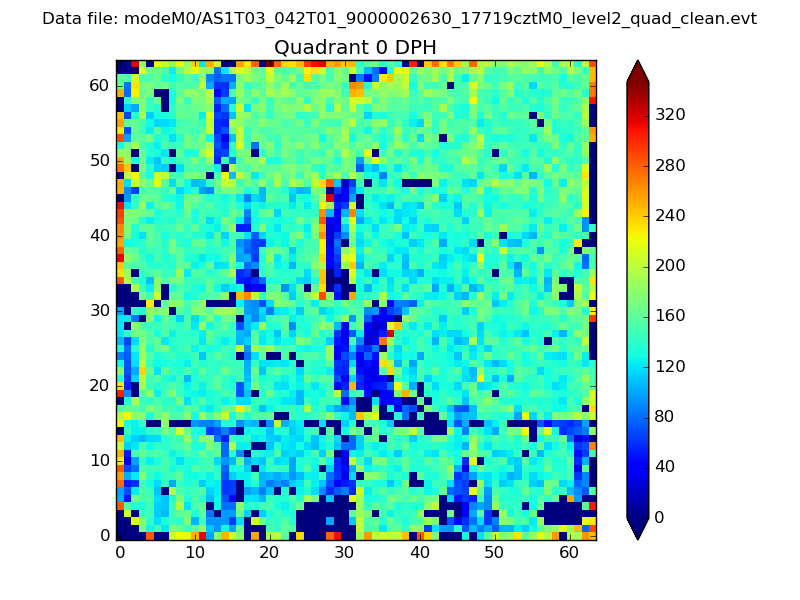 |
 |
Quadrant B |
|---|---|---|---|
| Quadrant D | 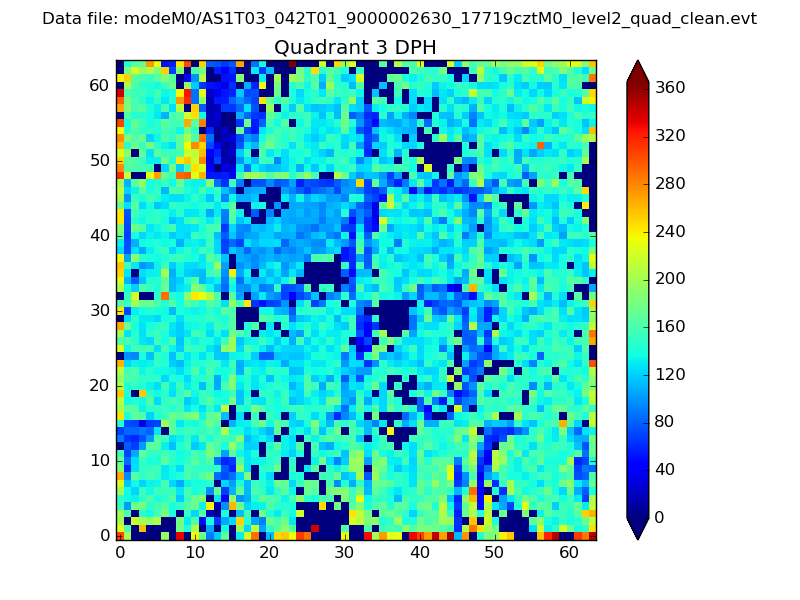 |
 |
Quadrant C |
| Plot type | Count rate plots | Images |
|---|---|---|
| Comparison with Poisson distribution Blue bars denote a histogram of data divided into 1 sec bins. Red curve is a Poisson curve with rate = median count rate of data. |
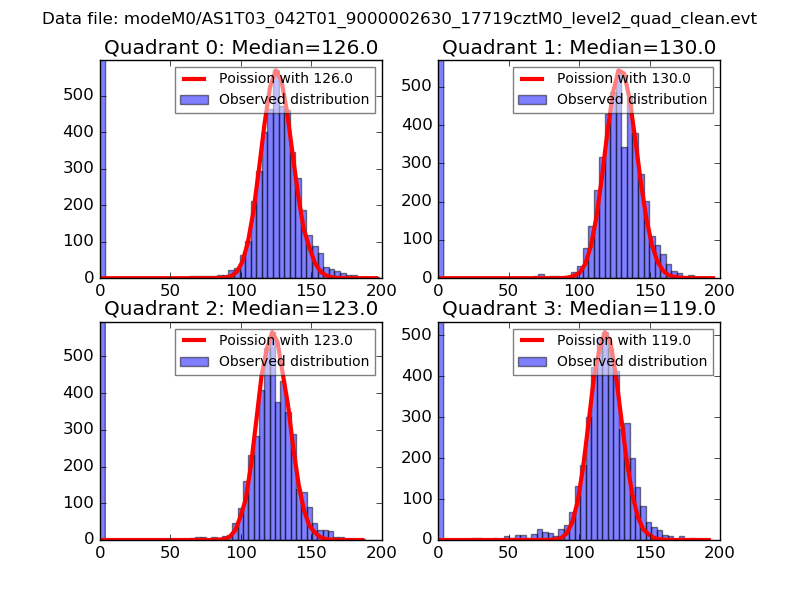 |
 |
| Quadrant-wise count rates Data is divided into 100 sec bins |
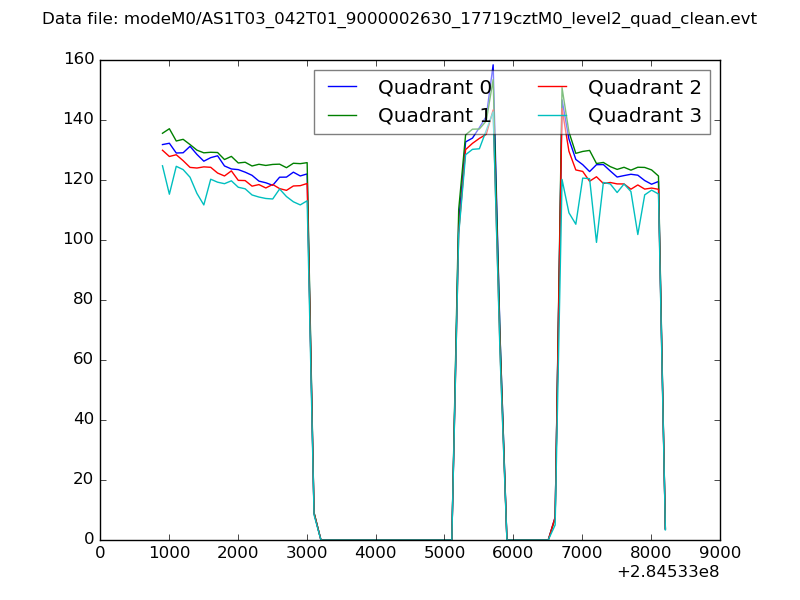 |
|
| Module-wise count rates for Quadrant A Data is divided into 100 sec bins |
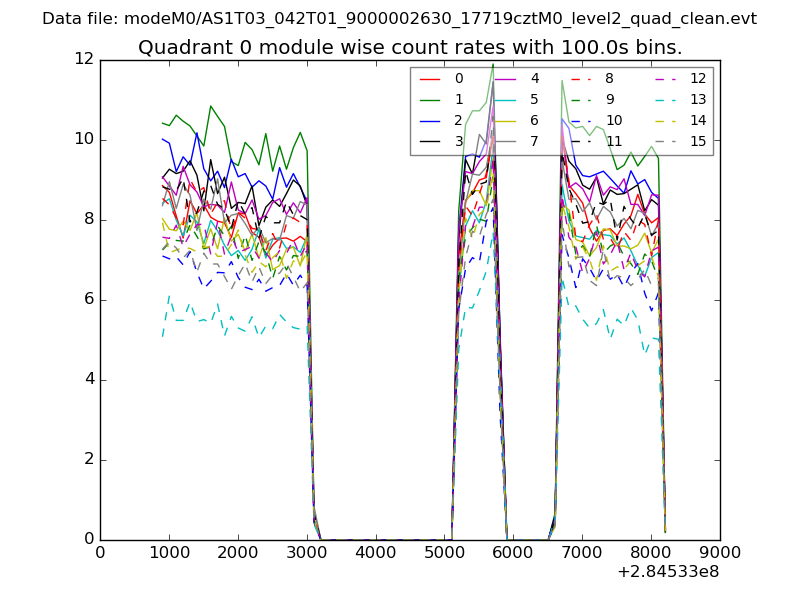 |
 |
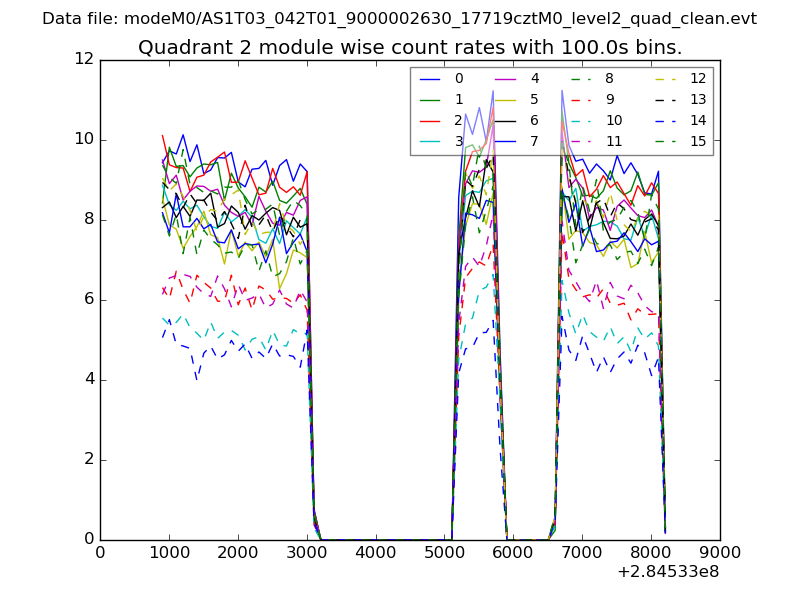
| Module-wise count rates for Quadrant B Data is divided into 100 sec bins |
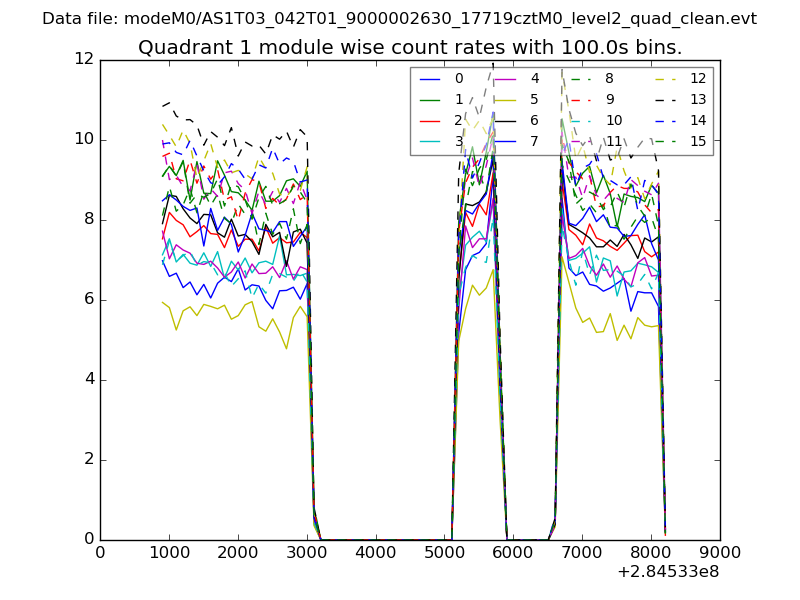 |
 |
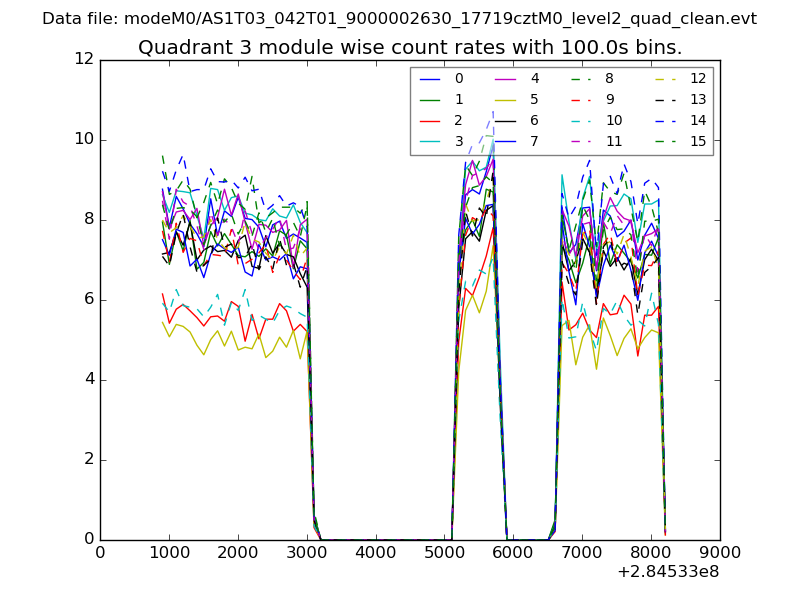
| Module-wise count rates for Quadrant C Data is divided into 100 sec bins |
 |
 |
| Module-wise count rates for Quadrant D Data is divided into 100 sec bins |
 |
 |
| Parameter | Plot |
|---|---|
| CZT HV Monitor | 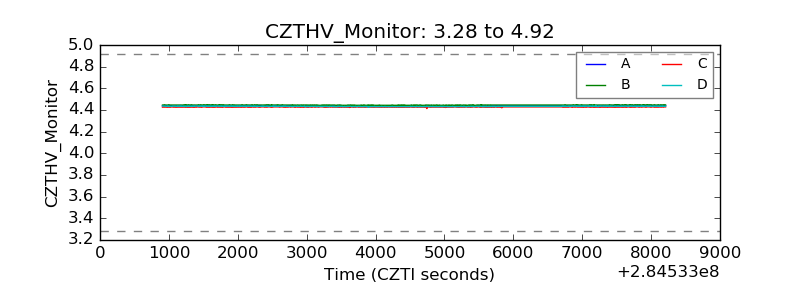 |
| D_VDD | 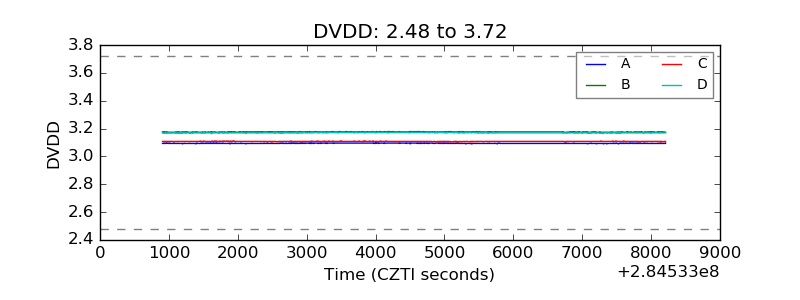 |
| Temperature 1 | 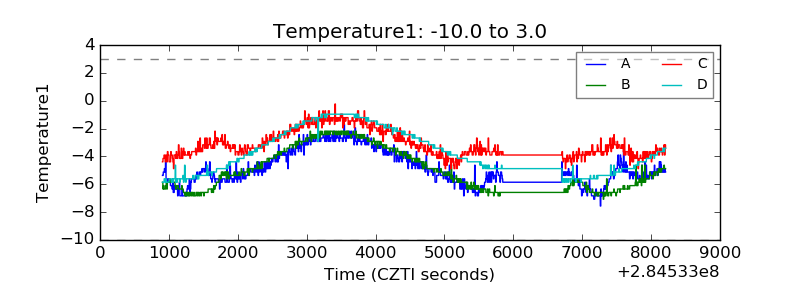 |
| Veto HV Monitor |  |
| Veto LLD | 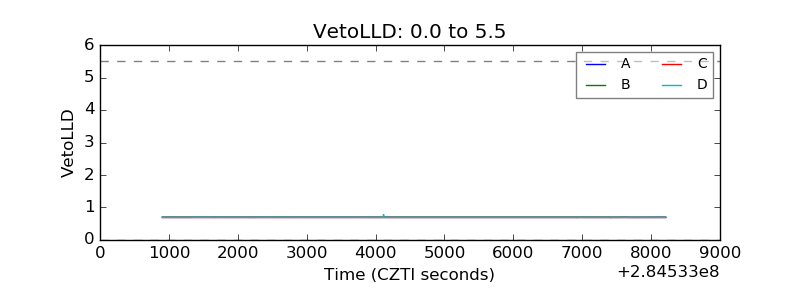 |
| Alpha Counter | 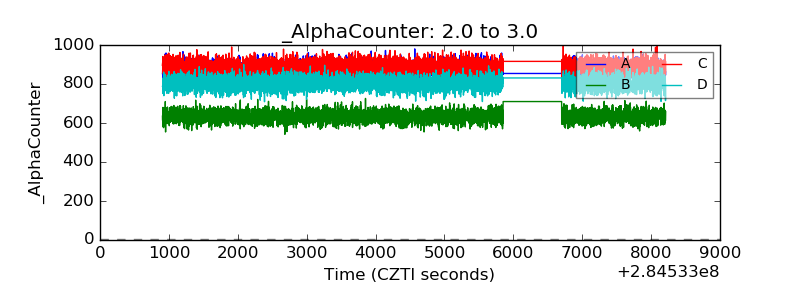 |
| _CPM_Rate | 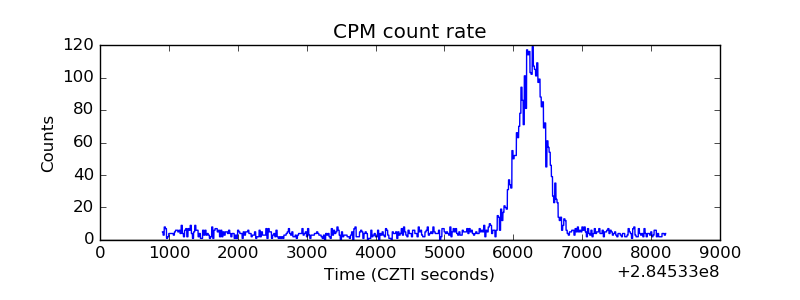 |
| CZT Counter | 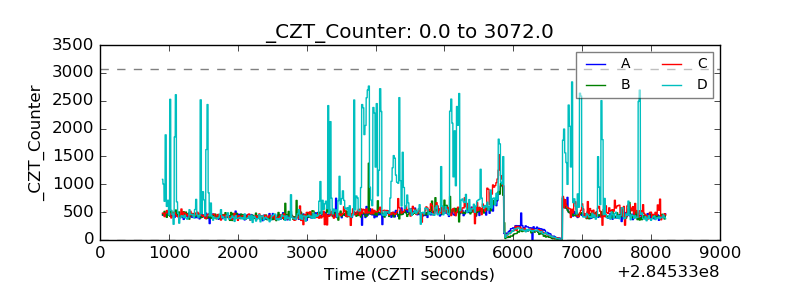 |
| +2.5 Volts monitor |  |
| +5 Volts monitor |  |
| _ROLL_ROT | 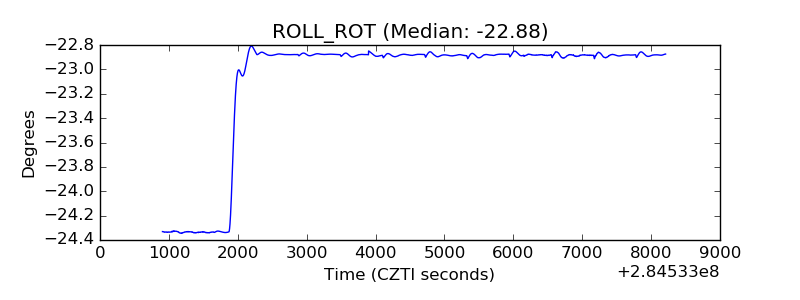 |
| _Roll_DEC | 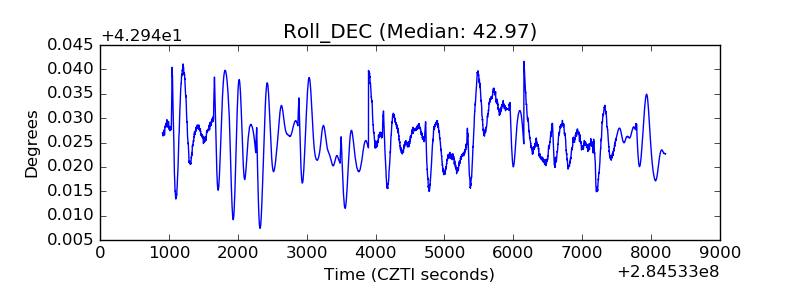 |
| _Roll_RA | 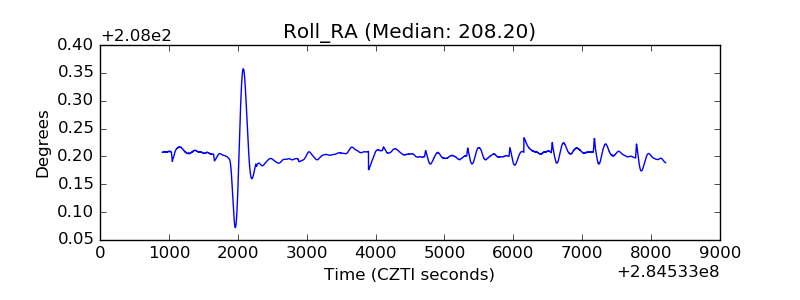 |
| Veto Counter | 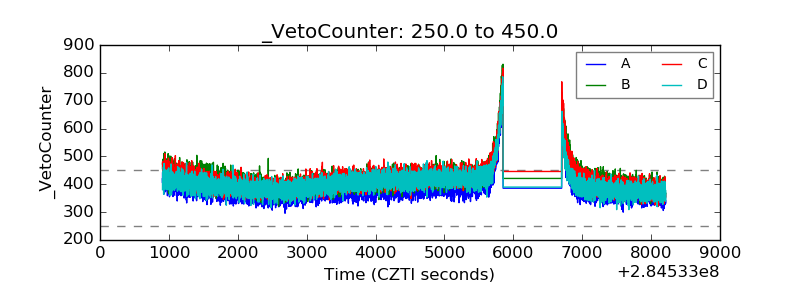 |