| Param | Original file | Final file |
|---|---|---|
| Filename | modeM0/AS1T03_042T01_9000002630_17720cztM0_level2.evt | modeM0/AS1T03_042T01_9000002630_17720cztM0_level2_quad_clean.evt |
| Size (bytes) | 518,731,200 | 86,978,880 |
| Size | 494.7 MB | 82.9 MB |
| Events in quadrant A | 3,043,600 | 554,984 |
| Events in quadrant B | 3,212,113 | 571,577 |
| Events in quadrant C | 3,141,374 | 542,722 |
| Events in quadrant D | 5,863,979 | 503,898 |
| Mode M9 | |||
|---|---|---|---|
| Quadrant | BADHDUFLAG | Total packets | Discarded packets |
| A | 0 | 4 | 0 |
| B | 0 | 4 | 0 |
| C | 0 | 4 | 0 |
| D | 0 | 4 | 0 |
| Mode M0 | |||
|---|---|---|---|
| Quadrant | BADHDUFLAG | Total packets | Discarded packets |
| A | 0 | 13546 | 1 |
| B | 0 | 13946 | 1 |
| C | 0 | 13629 | 1 |
| D | 0 | 22063 | 1 |
| Mode SS | |||
|---|---|---|---|
| Quadrant | BADHDUFLAG | Total packets | Discarded packets |
| A | 0 | 134 | 0 |
| B | 0 | 134 | 0 |
| C | 0 | 134 | 0 |
| D | 0 | 134 | 0 |
| Quadrant | Total seconds | Saturated seconds | Saturation percentage |
|---|---|---|---|
| A | 6609 | 131 | 1.982146% |
| B | 6608 | 161 | 2.436441% |
| C | 6608 | 158 | 2.391041% |
| D | 6608 | 1104 | 16.707022% |
Noise dominated data is calculated using 1-second bins in cleaned event files. If a bin has >2000 counts, and if more than 50% of those come from <1% of pixels, then it is considered to be noise-dominated and hence unusable.
| Quadrant | # 1 sec bins | Bins with >0 counts | Bins with >2000 counts | High rate bins dominated by noise | Noise dominated (total time) | Noise dominated (detector-on time) | Marked lightcurve |
|---|---|---|---|---|---|---|---|
| A | 6949 | 6610 | 0 | 0 | 0.00% | 0.00% | 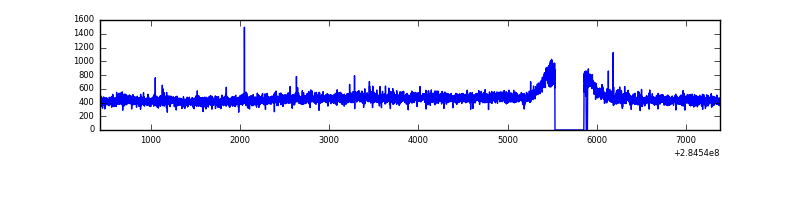 |
| B | 6948 | 6610 | 13 | 13 | 0.19% | 0.20% | 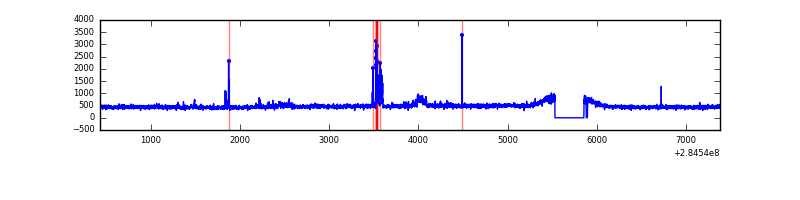 |
| C | 6948 | 6610 | 0 | 0 | 0.00% | 0.00% | 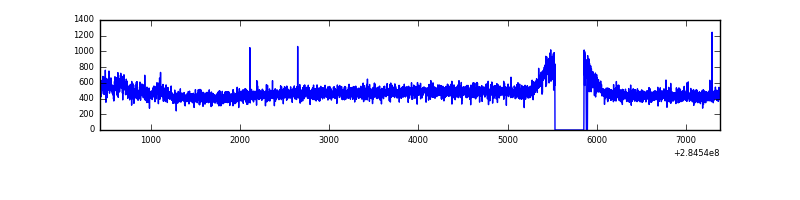 |
| D | 6948 | 6610 | 872 | 872 | 12.55% | 13.19% | 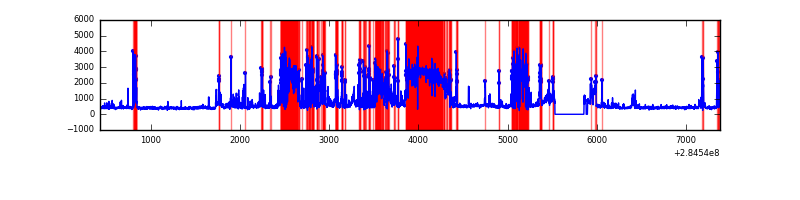 |
Top three noisy pixels from each quadrant. If the there are fewer than three noisy pixels in the level2.evt file, extra rows are filled as -1
| Pixel properties | Quadrant properties | ||||||
|---|---|---|---|---|---|---|---|
| Quadrant | DetID | PixID | Counts | Sigma | Mean | Median | Sigma |
| A | 15 | 174 | 14179 | 83.44 | 786 | 769 | 160.7 |
| A | 0 | 226 | 6848 | 37.82 | 786 | 769 | 160.7 |
| A | 3 | 137 | 5836 | 31.53 | 786 | 769 | 160.7 |
| B | 0 | 182 | 72918 | 480.19 | 782 | 762 | 150.3 |
| B | 0 | 189 | 35953 | 234.19 | 782 | 762 | 150.3 |
| B | 12 | 111 | 18103 | 115.4 | 782 | 762 | 150.3 |
| C | 14 | 238 | 115591 | 655.89 | 749 | 754 | 175.1 |
| C | 3 | 233 | 84242 | 476.84 | 749 | 754 | 175.1 |
| C | 5 | 218 | 17694 | 96.75 | 749 | 754 | 175.1 |
| D | 7 | 238 | 2905845 | 15317.15 | 698 | 682 | 189.7 |
| D | 13 | 232 | 162624 | 853.82 | 698 | 682 | 189.7 |
| D | 1 | 52 | 64132 | 334.53 | 698 | 682 | 189.7 |
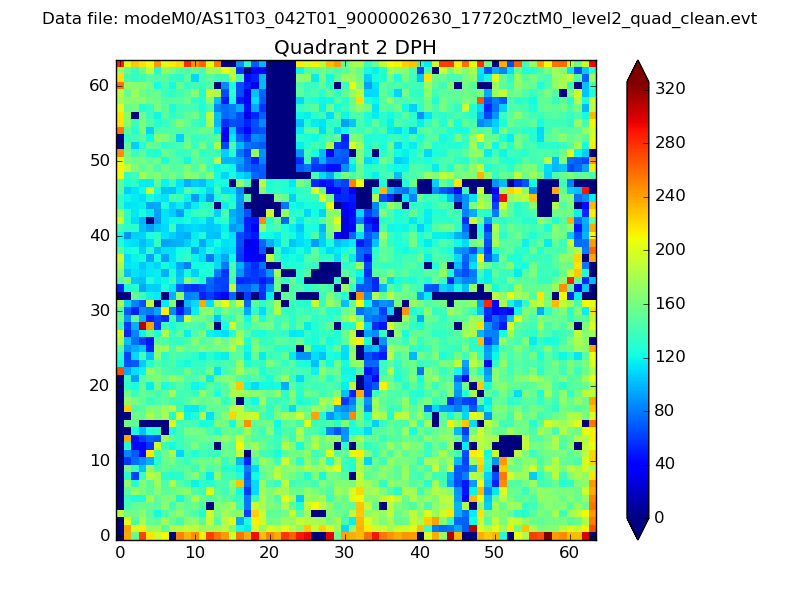
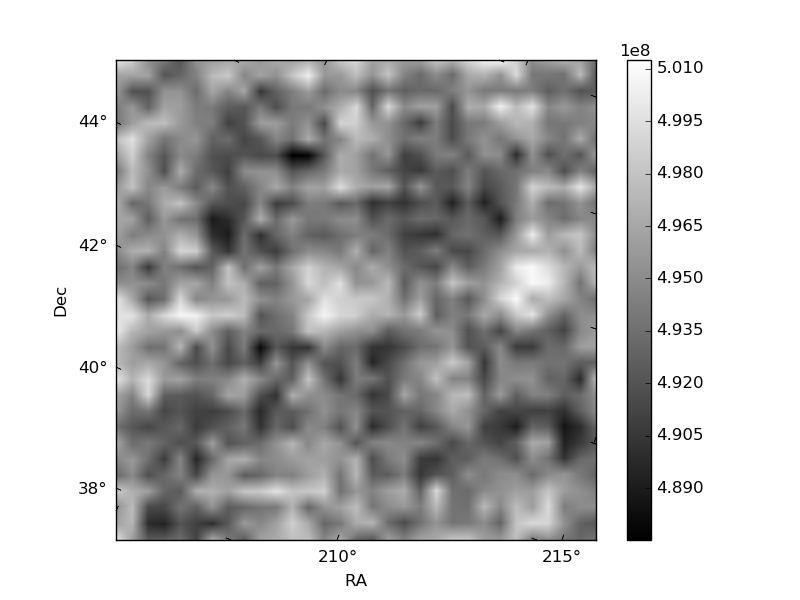
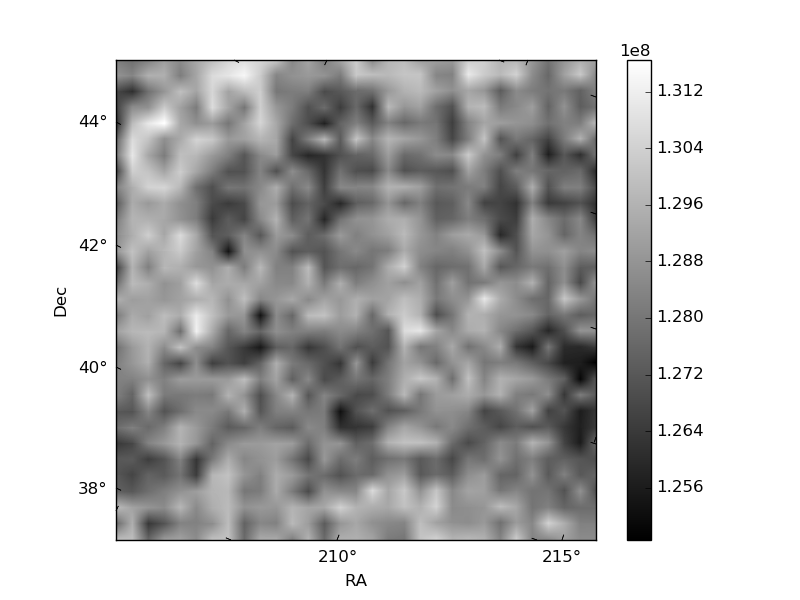
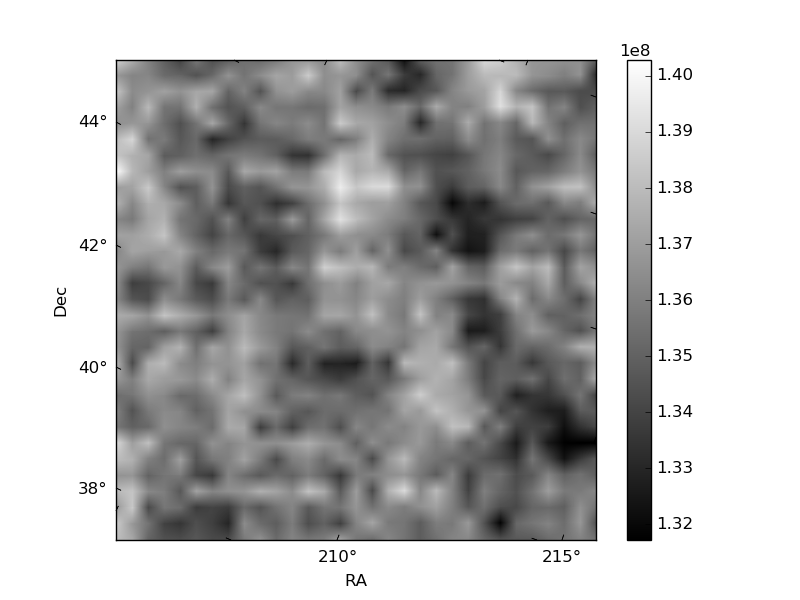
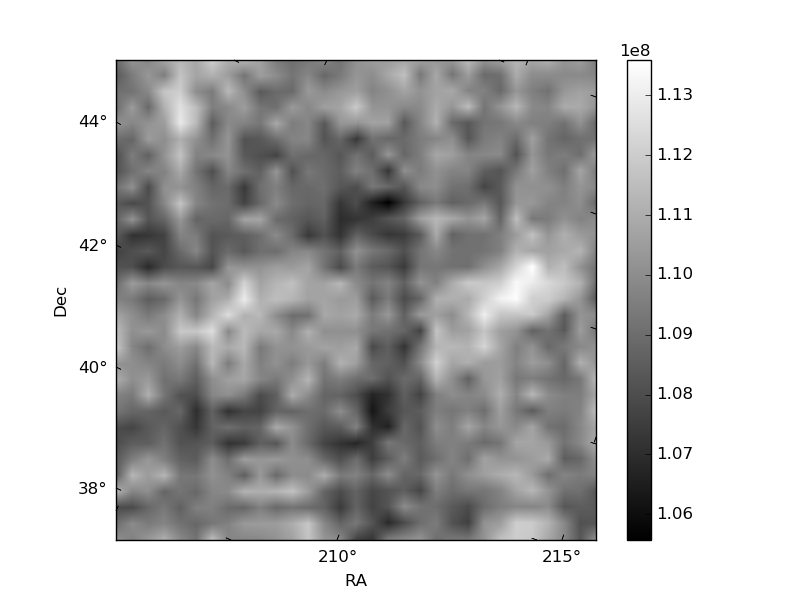
Histogram calculated using DETX and DETY for each event in the final _common_clean file
| Quadrant A | 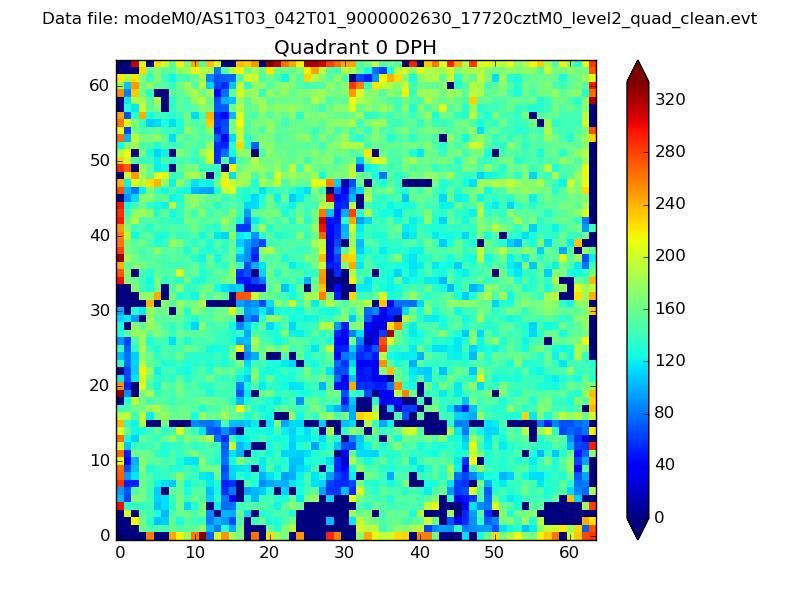 |
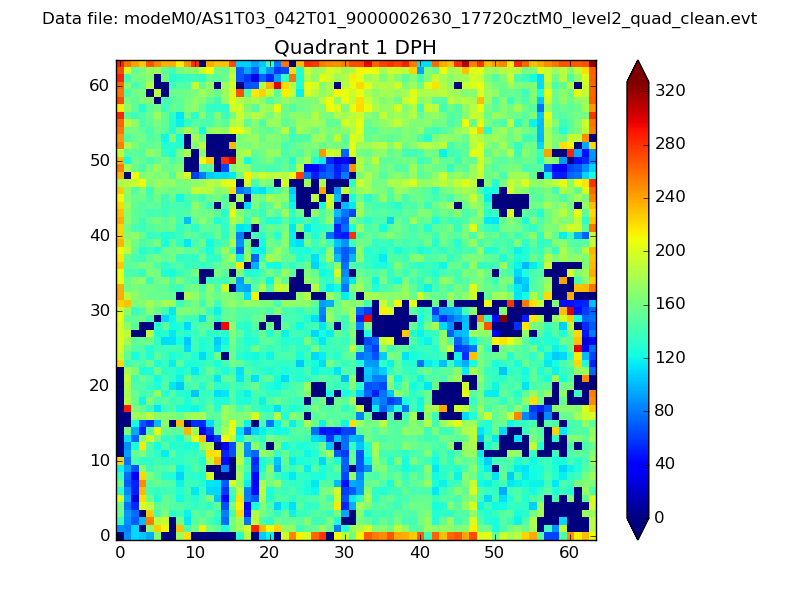 |
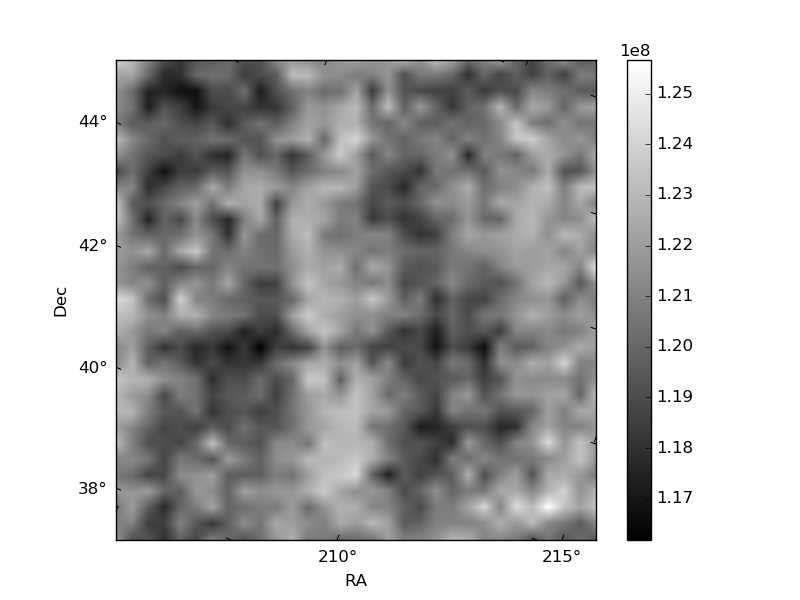
Quadrant B |
|---|---|---|---|
| Quadrant D | 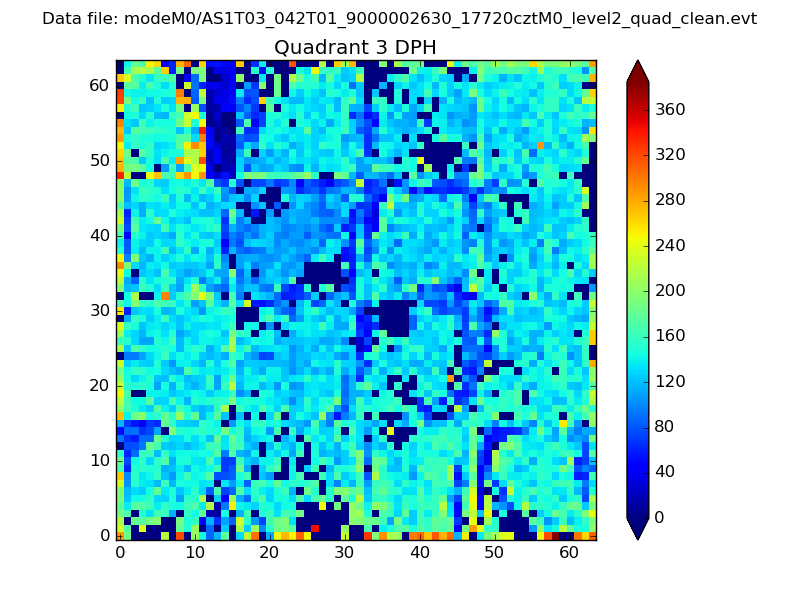 |
 |
Quadrant C |
| Plot type | Count rate plots | Images |
|---|---|---|
| Comparison with Poisson distribution Blue bars denote a histogram of data divided into 1 sec bins. Red curve is a Poisson curve with rate = median count rate of data. |
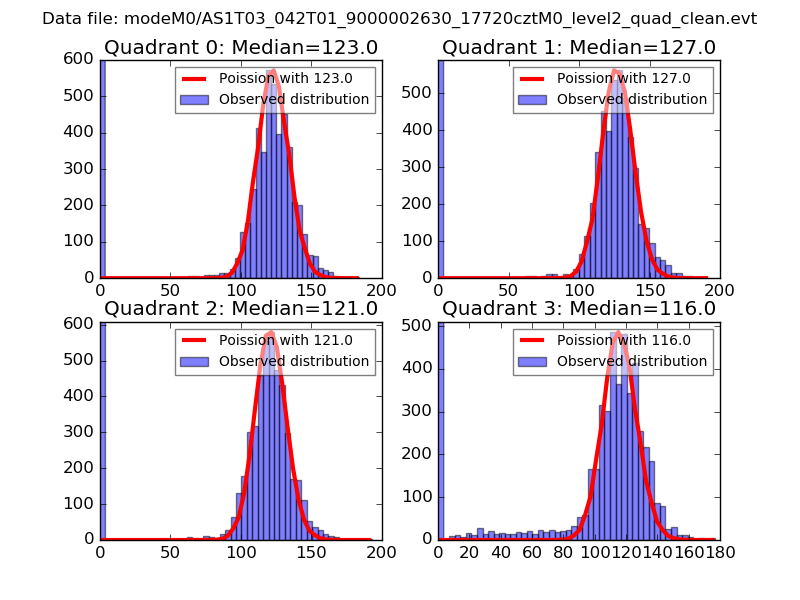 |
 |
| Quadrant-wise count rates Data is divided into 100 sec bins |
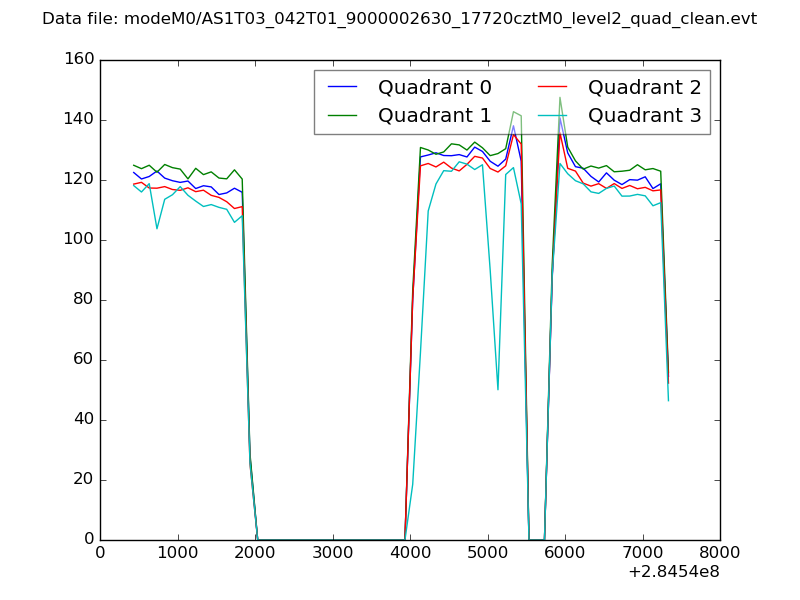 |
|
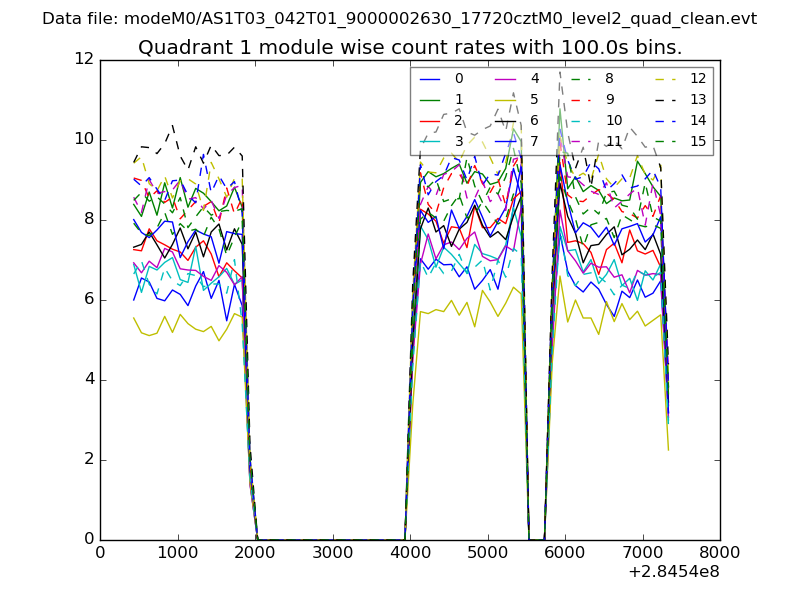
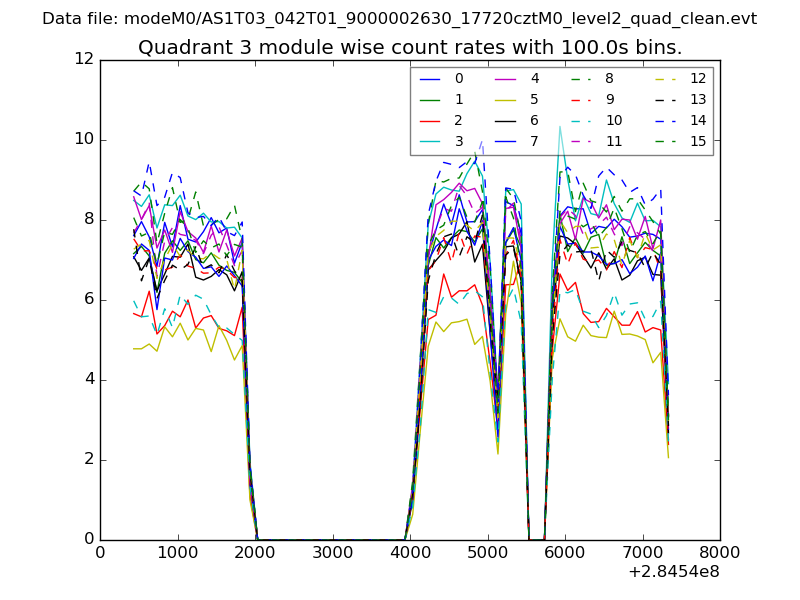
| Module-wise count rates for Quadrant A Data is divided into 100 sec bins |
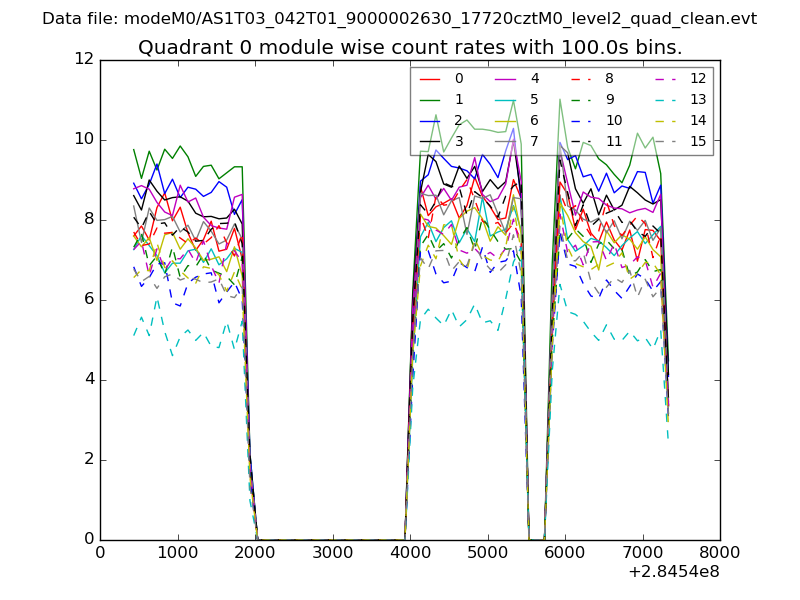 |
 |
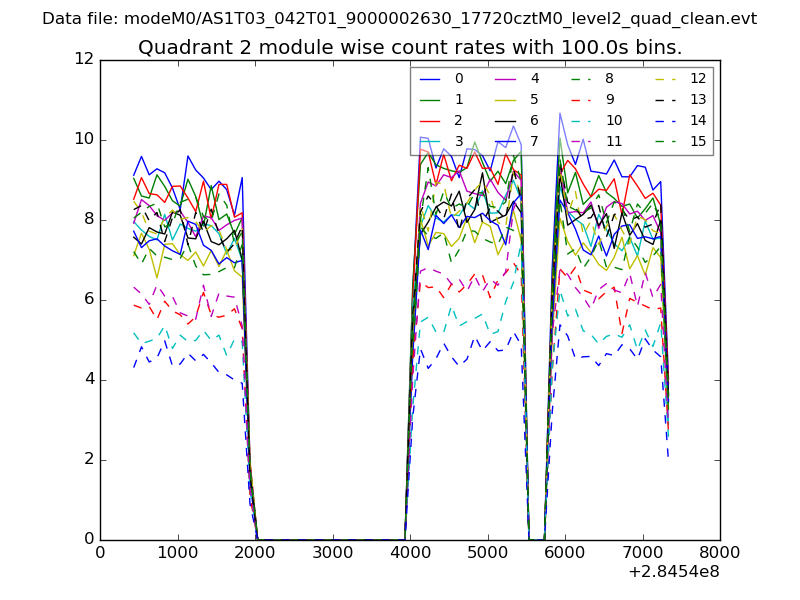
| Module-wise count rates for Quadrant B Data is divided into 100 sec bins |
 |
 |
| Module-wise count rates for Quadrant C Data is divided into 100 sec bins |
 |
 |
| Module-wise count rates for Quadrant D Data is divided into 100 sec bins |
 |
 |
| Parameter | Plot |
|---|---|
| CZT HV Monitor | 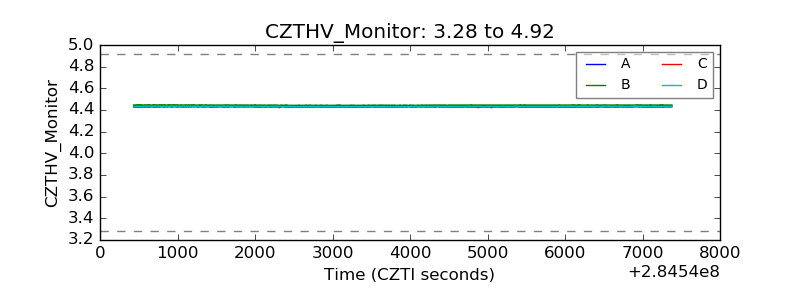 |
| D_VDD | 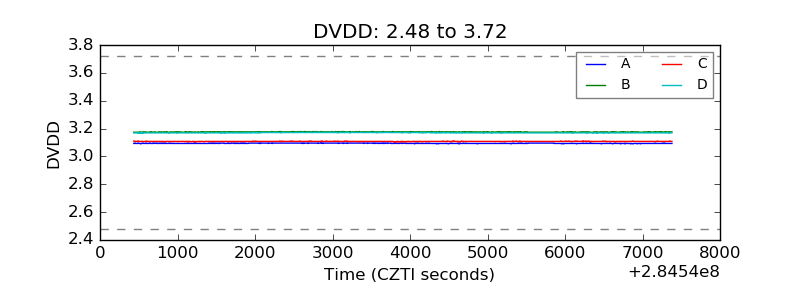 |
| Temperature 1 | 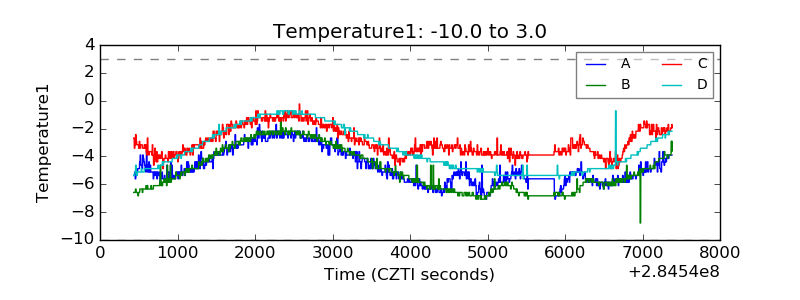 |
| Veto HV Monitor | 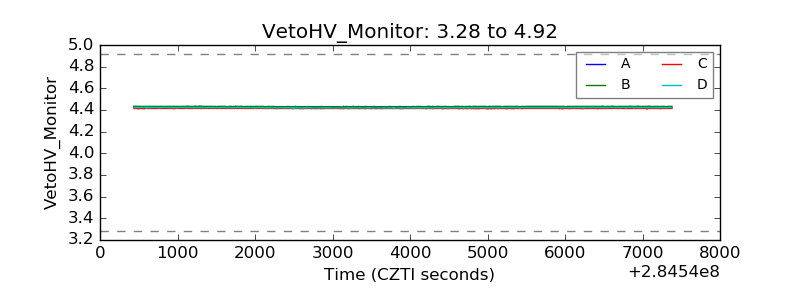 |
| Veto LLD | 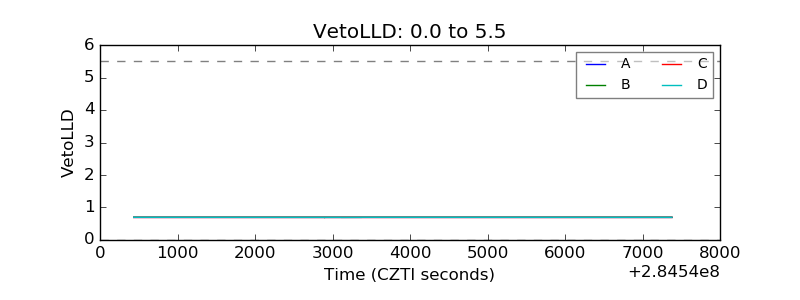 |
| Alpha Counter | 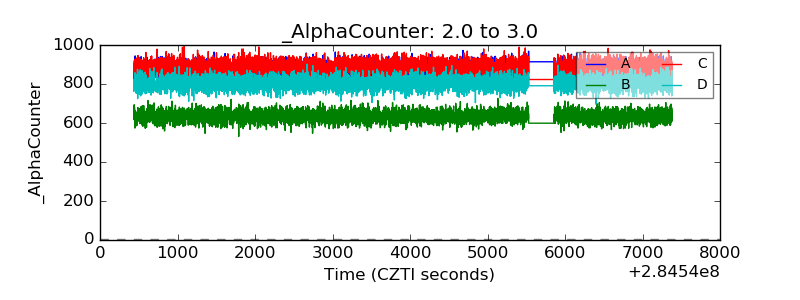 |
| _CPM_Rate | 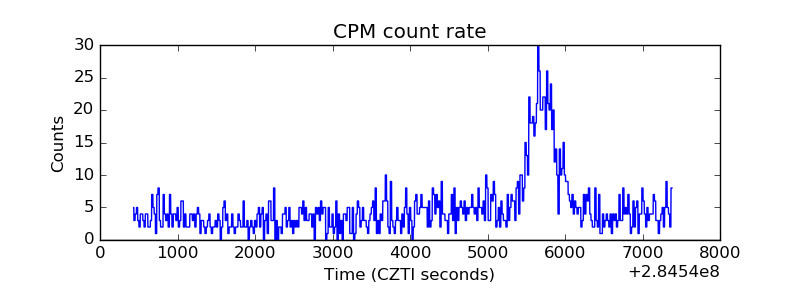 |
| CZT Counter | 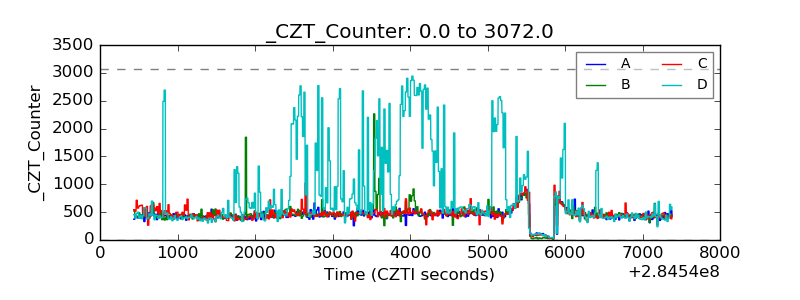 |
| +2.5 Volts monitor | 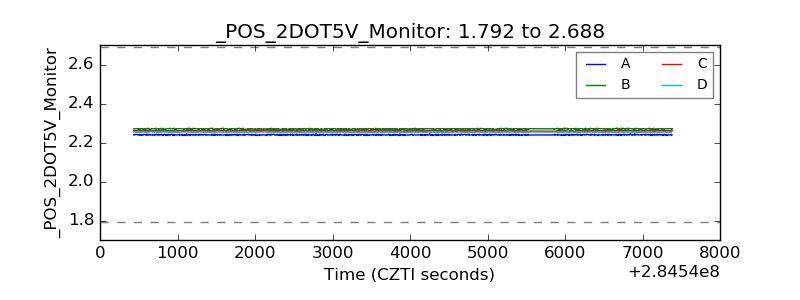 |
| +5 Volts monitor |  |
| _ROLL_ROT | 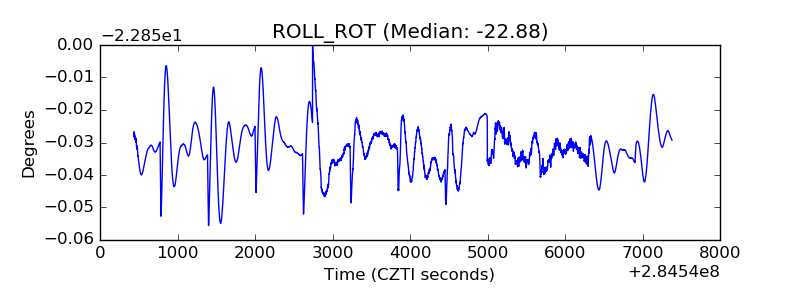 |
| _Roll_DEC | 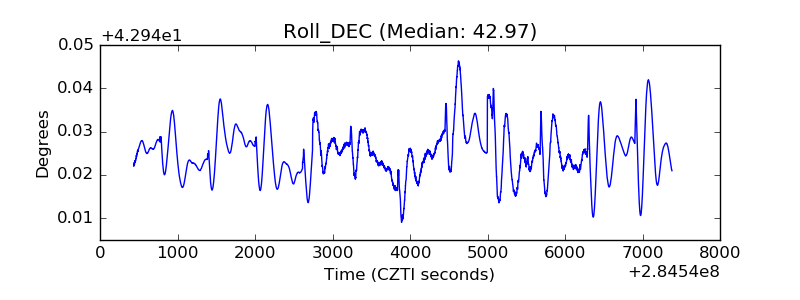 |
| _Roll_RA | 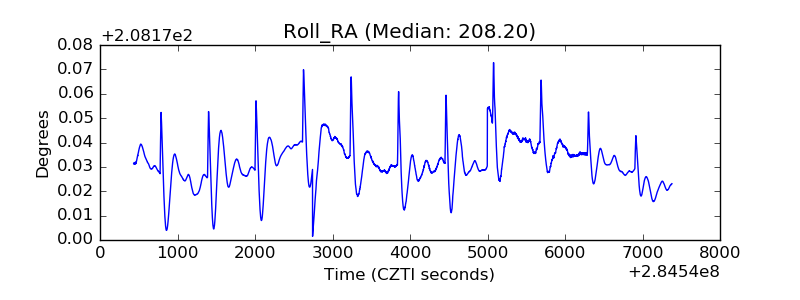 |
| Veto Counter | 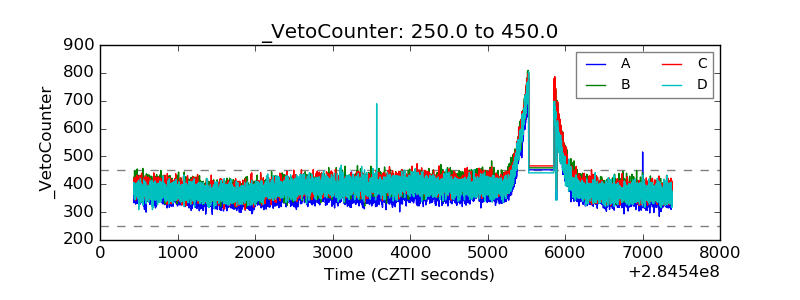 |