| Param | Original file | Final file |
|---|---|---|
| Filename | modeM0/AS1T03_042T01_9000002630_17721cztM0_level2.evt | modeM0/AS1T03_042T01_9000002630_17721cztM0_level2_quad_clean.evt |
| Size (bytes) | 524,093,760 | 104,852,160 |
| Size | 499.8 MB | 100.0 MB |
| Events in quadrant A | 3,501,902 | 669,852 |
| Events in quadrant B | 3,608,921 | 688,247 |
| Events in quadrant C | 3,546,584 | 654,451 |
| Events in quadrant D | 4,697,261 | 632,702 |
| Mode M9 | |||
|---|---|---|---|
| Quadrant | BADHDUFLAG | Total packets | Discarded packets |
| A | 0 | 2 | 0 |
| B | 0 | 2 | 0 |
| C | 0 | 2 | 0 |
| D | 0 | 2 | 0 |
| Mode M0 | |||
|---|---|---|---|
| Quadrant | BADHDUFLAG | Total packets | Discarded packets |
| A | 0 | 15617 | 1 |
| B | 0 | 15772 | 1 |
| C | 0 | 15614 | 1 |
| D | 0 | 19221 | 1 |
| Mode SS | |||
|---|---|---|---|
| Quadrant | BADHDUFLAG | Total packets | Discarded packets |
| A | 0 | 154 | 0 |
| B | 0 | 154 | 0 |
| C | 0 | 154 | 0 |
| D | 0 | 154 | 0 |
| Quadrant | Total seconds | Saturated seconds | Saturation percentage |
|---|---|---|---|
| A | 7624 | 162 | 2.124869% |
| B | 7625 | 183 | 2.400000% |
| C | 7625 | 193 | 2.531148% |
| D | 7625 | 351 | 4.603279% |
Noise dominated data is calculated using 1-second bins in cleaned event files. If a bin has >2000 counts, and if more than 50% of those come from <1% of pixels, then it is considered to be noise-dominated and hence unusable.
| Quadrant | # 1 sec bins | Bins with >0 counts | Bins with >2000 counts | High rate bins dominated by noise | Noise dominated (total time) | Noise dominated (detector-on time) | Marked lightcurve |
|---|---|---|---|---|---|---|---|
| A | 7714 | 7626 | 0 | 0 | 0.00% | 0.00% | 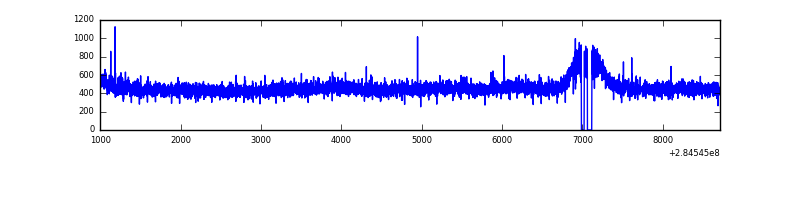 |
| B | 7715 | 7627 | 4 | 4 | 0.05% | 0.05% | 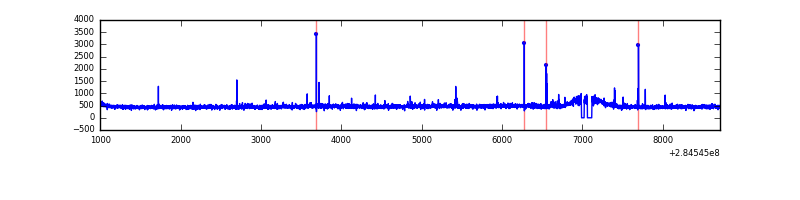 |
| C | 7715 | 7627 | 0 | 0 | 0.00% | 0.00% | 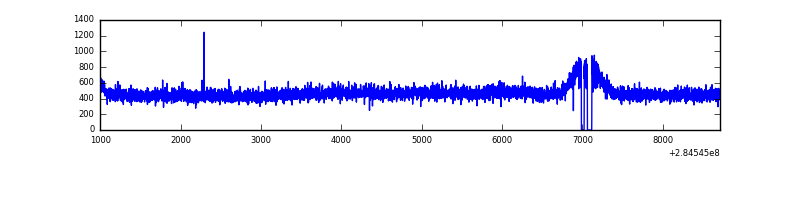 |
| D | 7715 | 7626 | 195 | 195 | 2.53% | 2.56% | 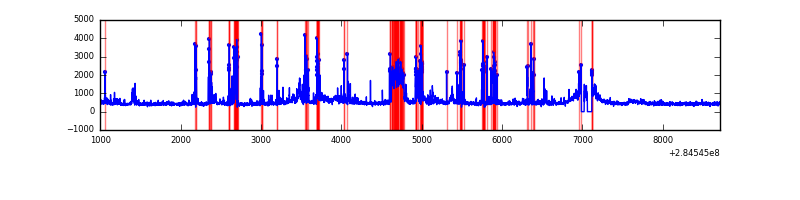 |
Top three noisy pixels from each quadrant. If the there are fewer than three noisy pixels in the level2.evt file, extra rows are filled as -1
| Pixel properties | Quadrant properties | ||||||
|---|---|---|---|---|---|---|---|
| Quadrant | DetID | PixID | Counts | Sigma | Mean | Median | Sigma |
| A | 15 | 174 | 12319 | 62.11 | 904 | 881 | 184.2 |
| A | 12 | 16 | 10573 | 52.63 | 904 | 881 | 184.2 |
| A | 12 | 194 | 8195 | 39.72 | 904 | 881 | 184.2 |
| B | 10 | 245 | 40260 | 228.44 | 899 | 874 | 172.4 |
| B | 12 | 111 | 21082 | 117.21 | 899 | 874 | 172.4 |
| B | 0 | 189 | 20556 | 114.15 | 899 | 874 | 172.4 |
| C | 14 | 238 | 132665 | 655.35 | 860 | 861 | 201.1 |
| C | 5 | 218 | 36717 | 178.28 | 860 | 861 | 201.1 |
| C | 3 | 233 | 20100 | 95.66 | 860 | 861 | 201.1 |
| D | 7 | 238 | 1113297 | 4821.67 | 853 | 833 | 230.7 |
| D | 13 | 232 | 156845 | 676.19 | 853 | 833 | 230.7 |
| D | 1 | 52 | 64266 | 274.93 | 853 | 833 | 230.7 |
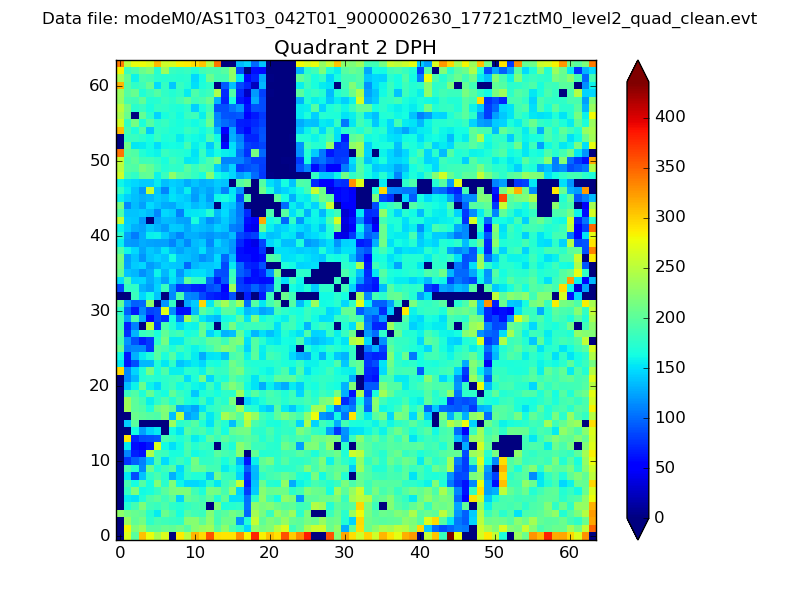
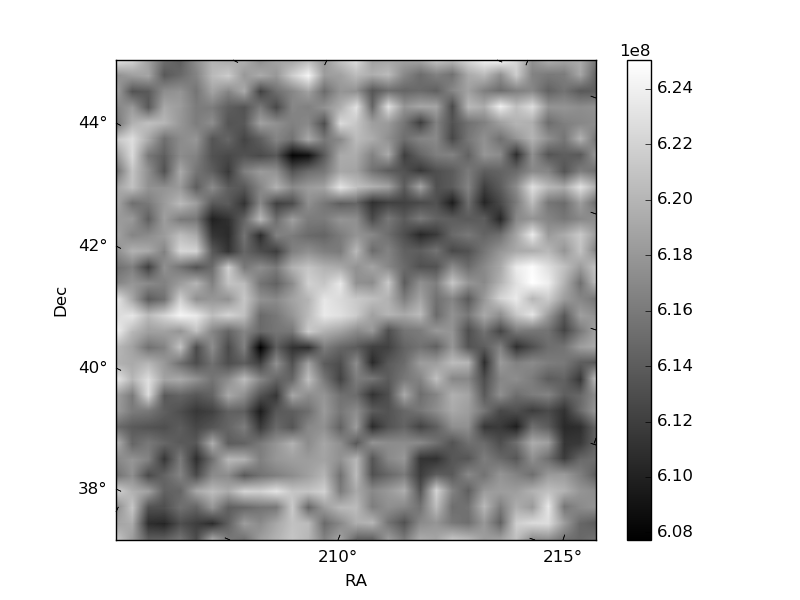
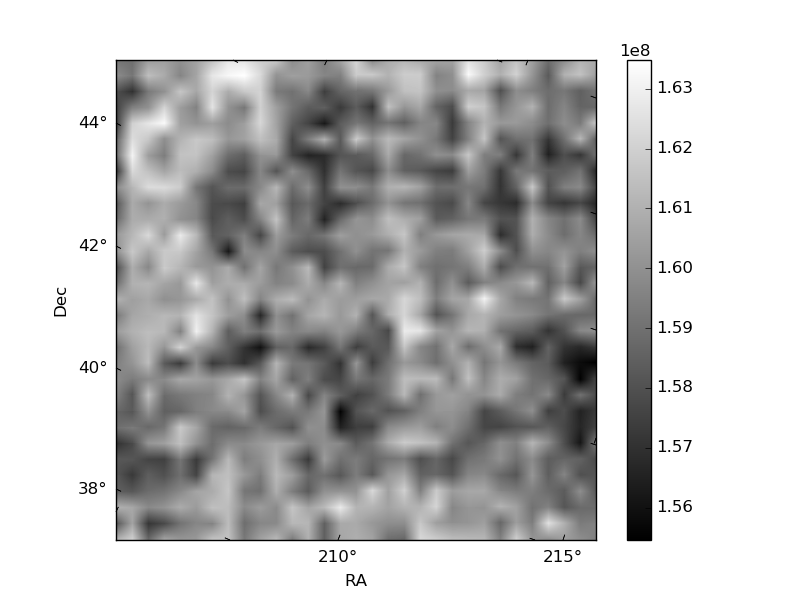
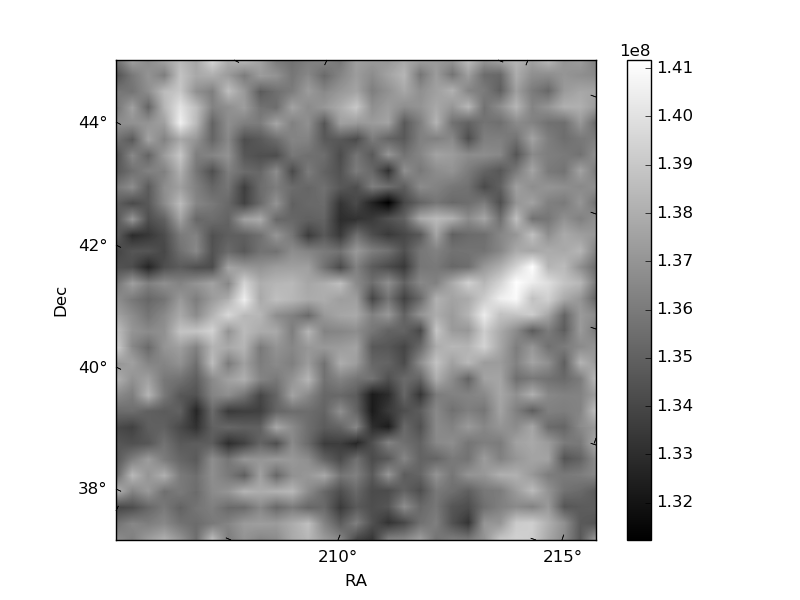
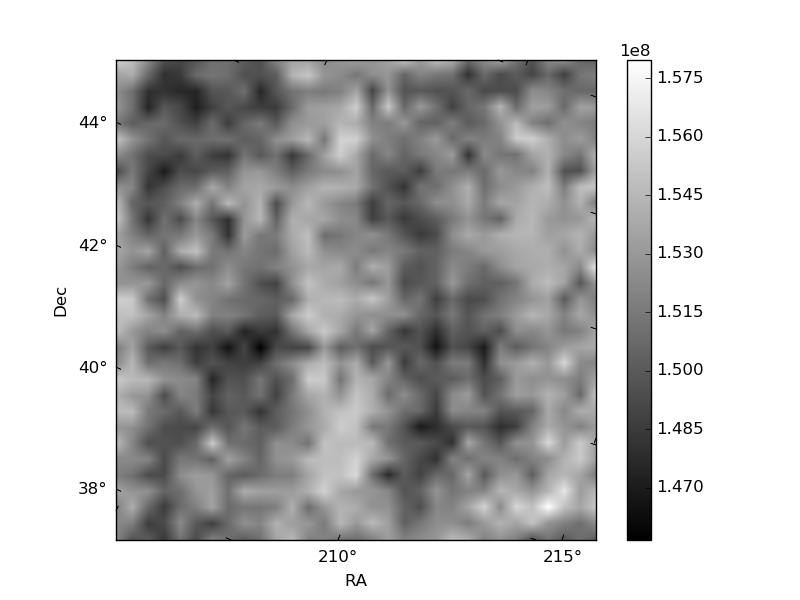
Histogram calculated using DETX and DETY for each event in the final _common_clean file
| Quadrant A | 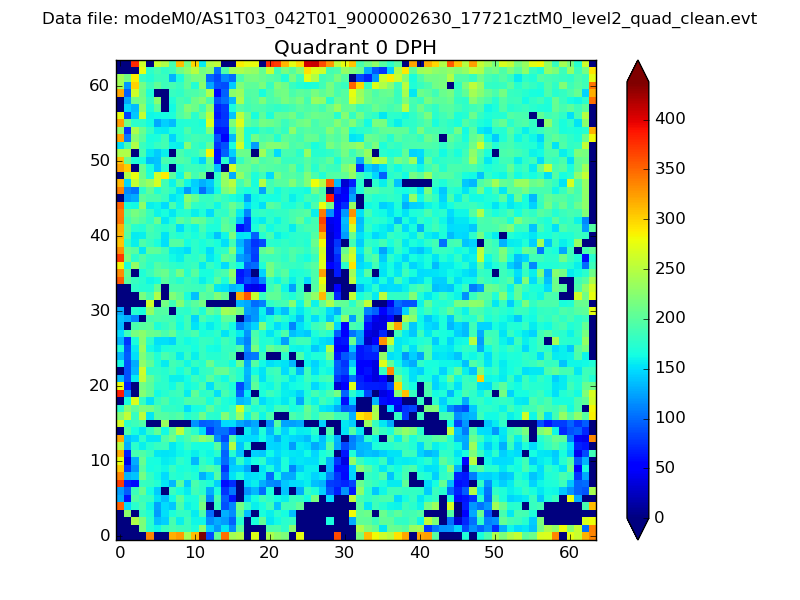 |
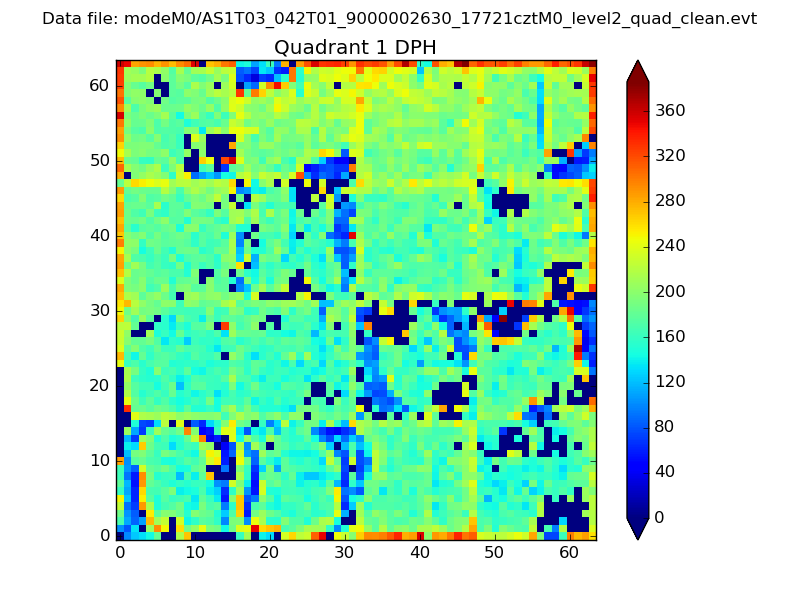 |
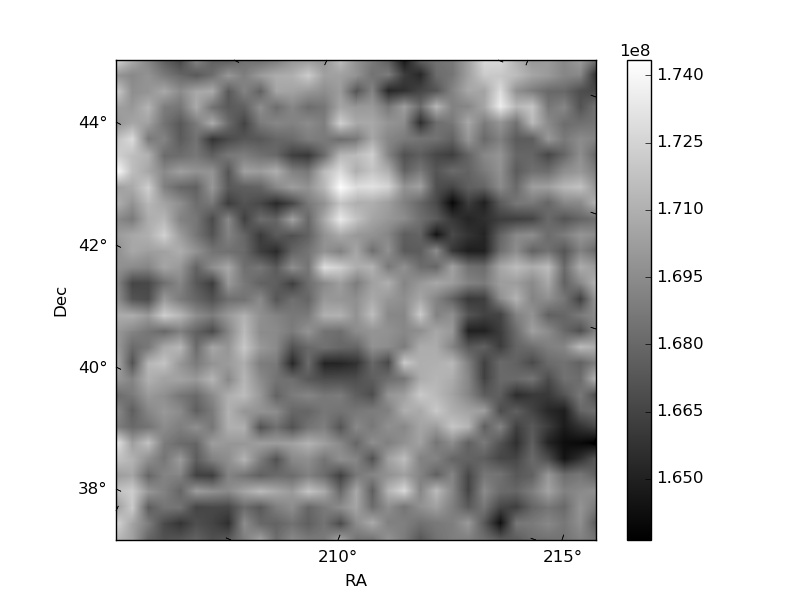
Quadrant B |
|---|---|---|---|
| Quadrant D | 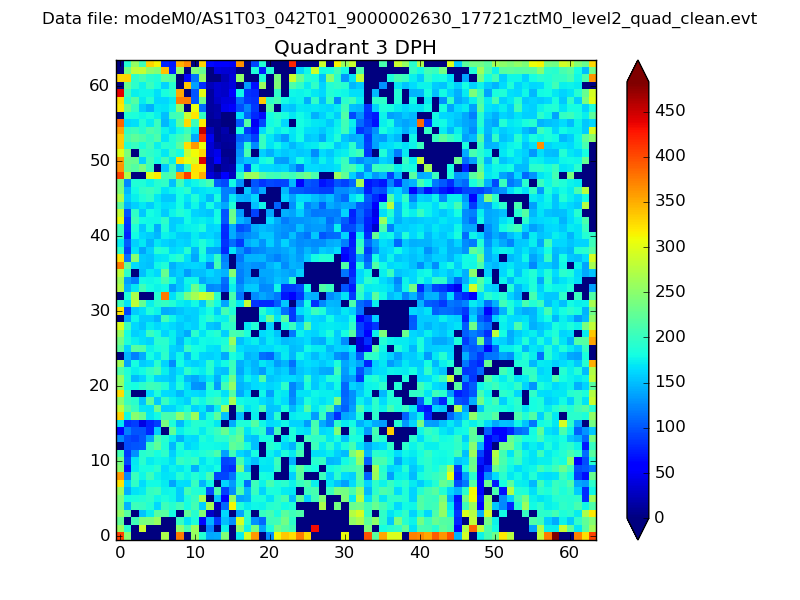 |
 |
Quadrant C |
| Plot type | Count rate plots | Images |
|---|---|---|
| Comparison with Poisson distribution Blue bars denote a histogram of data divided into 1 sec bins. Red curve is a Poisson curve with rate = median count rate of data. |
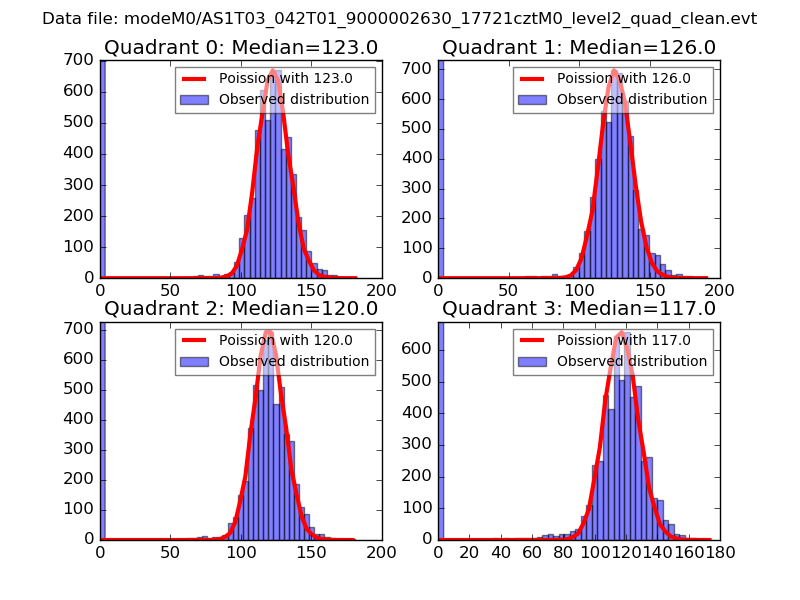 |
 |
| Quadrant-wise count rates Data is divided into 100 sec bins |
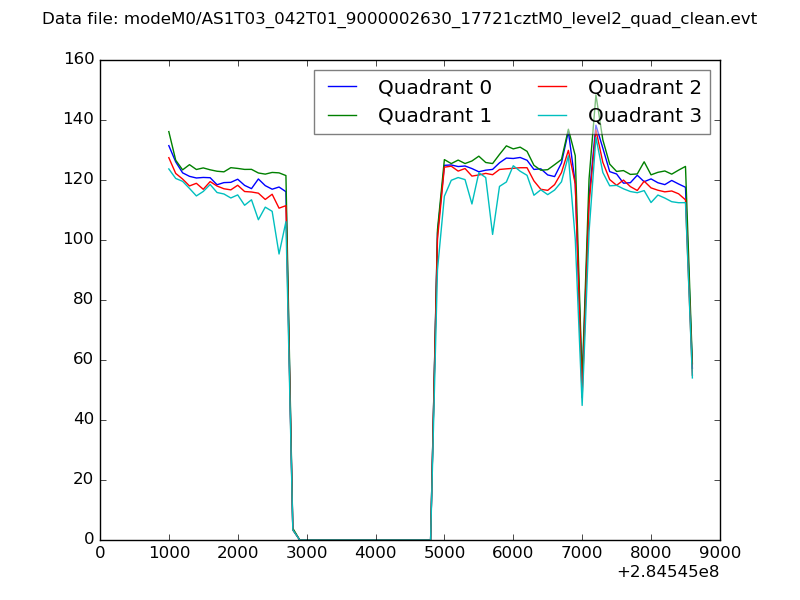 |
|
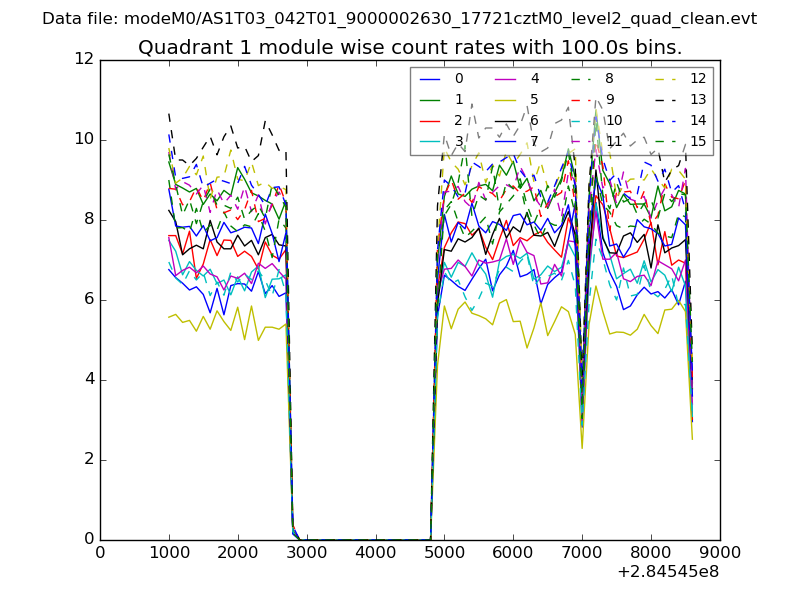
| Module-wise count rates for Quadrant A Data is divided into 100 sec bins |
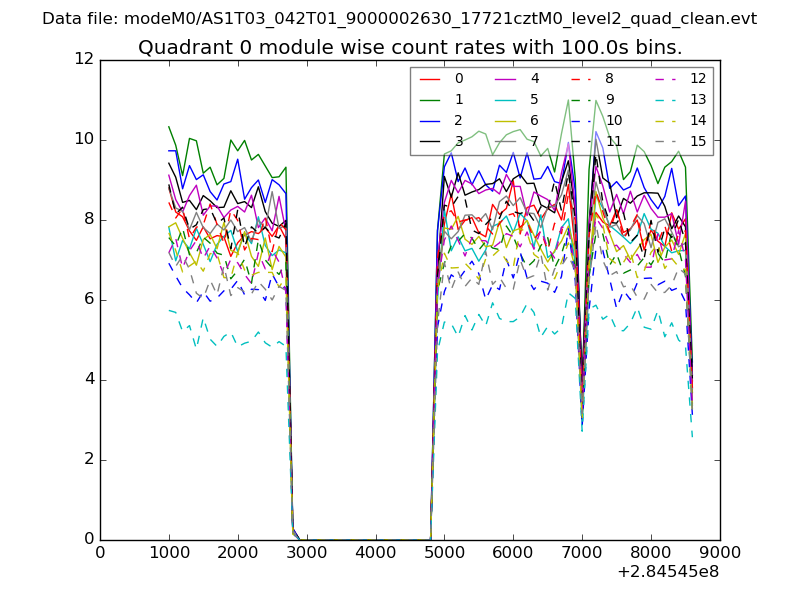 |
 |
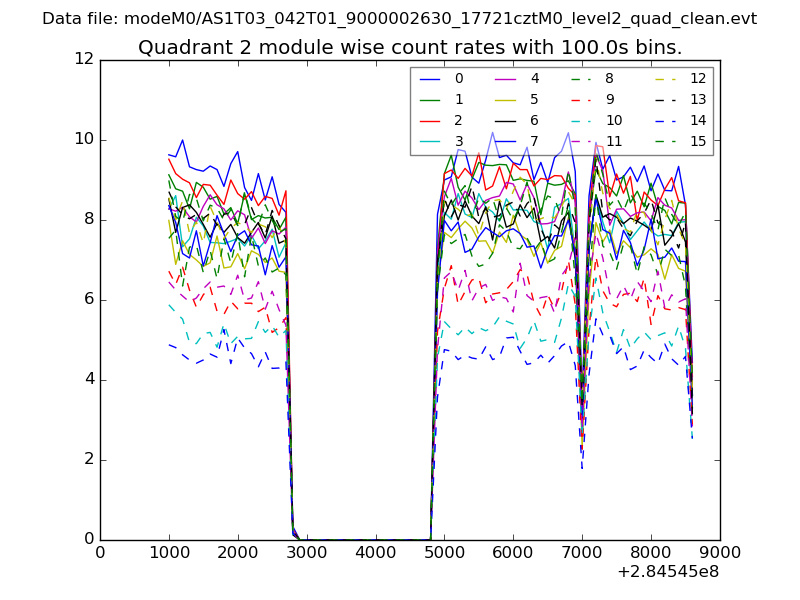
| Module-wise count rates for Quadrant B Data is divided into 100 sec bins |
 |
 |
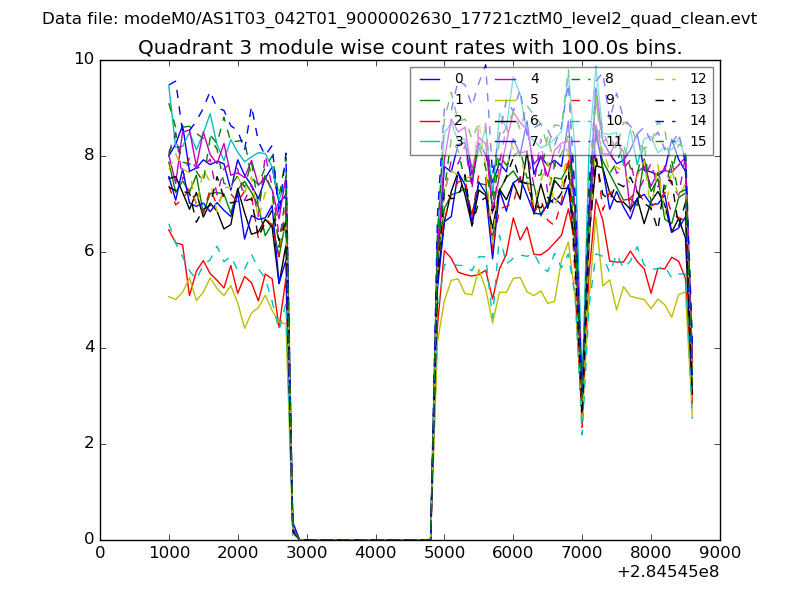
| Module-wise count rates for Quadrant C Data is divided into 100 sec bins |
 |
 |
| Module-wise count rates for Quadrant D Data is divided into 100 sec bins |
 |
 |
| Parameter | Plot |
|---|---|
| CZT HV Monitor | 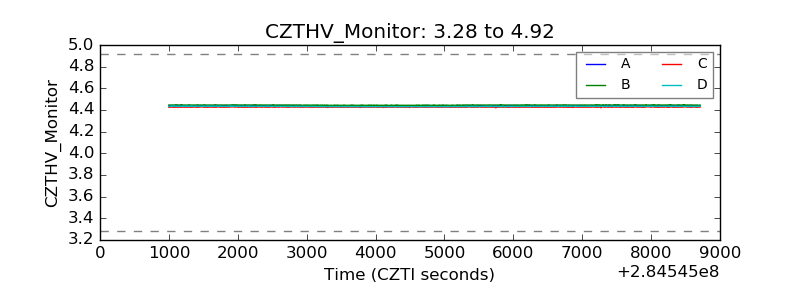 |
| D_VDD | 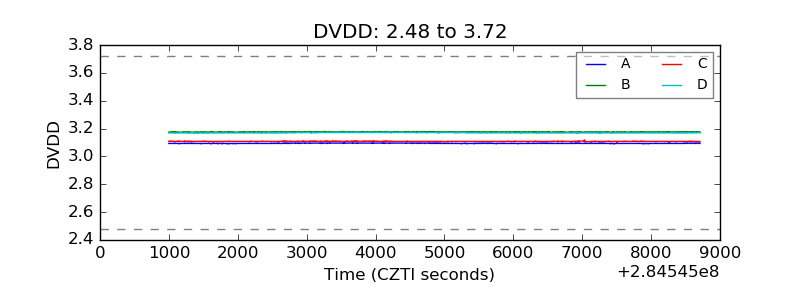 |
| Temperature 1 | 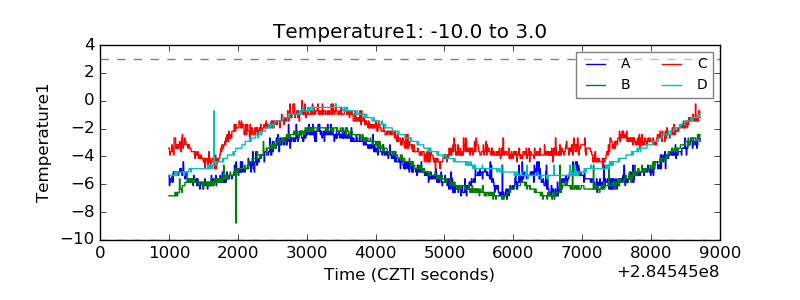 |
| Veto HV Monitor | 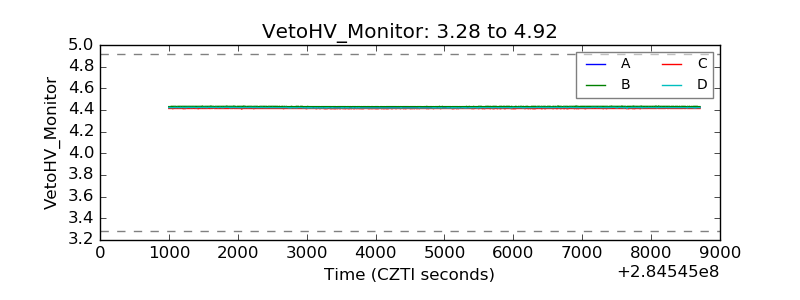 |
| Veto LLD | 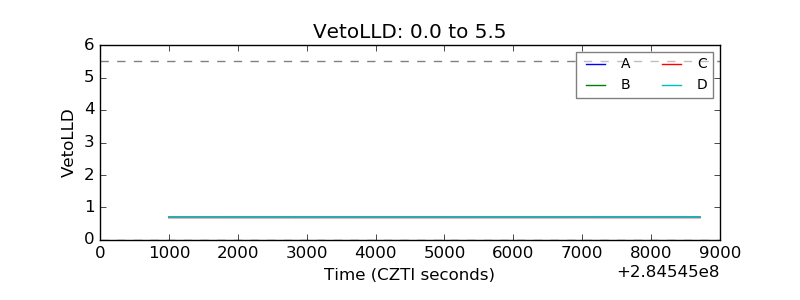 |
| Alpha Counter | 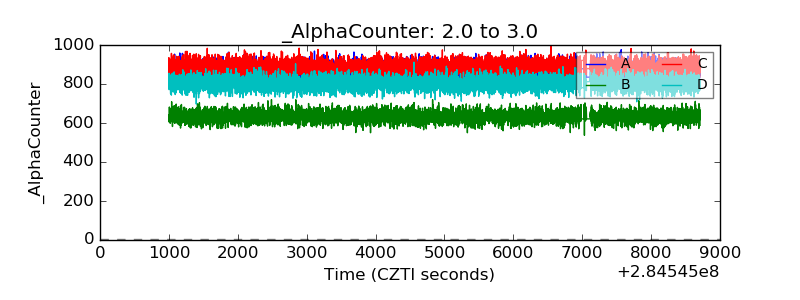 |
| _CPM_Rate | 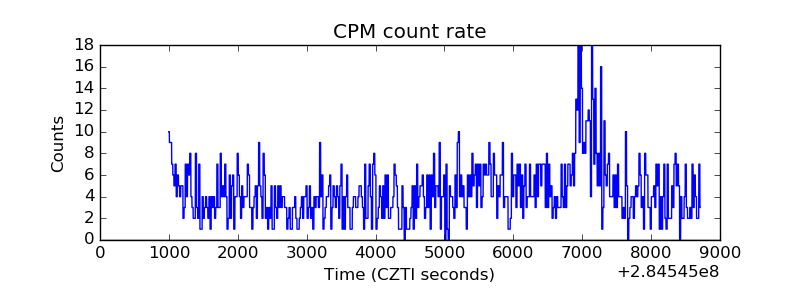 |
| CZT Counter | 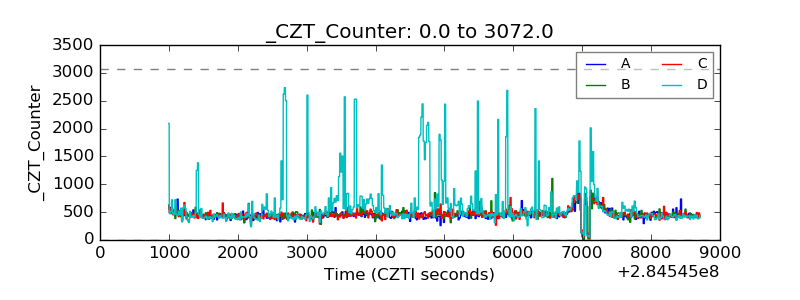 |
| +2.5 Volts monitor |  |
| +5 Volts monitor |  |
| _ROLL_ROT | 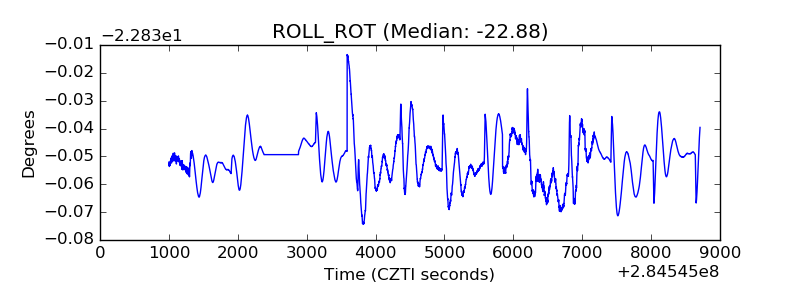 |
| _Roll_DEC | 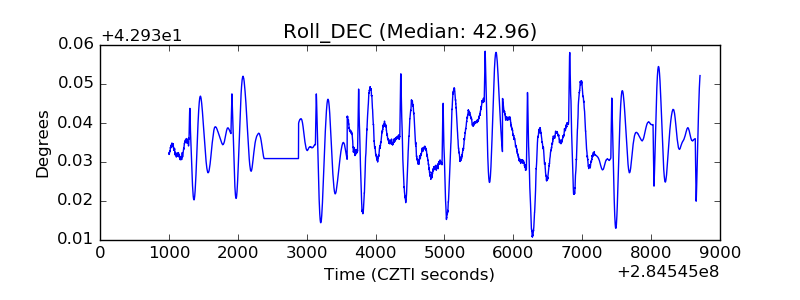 |
| _Roll_RA | 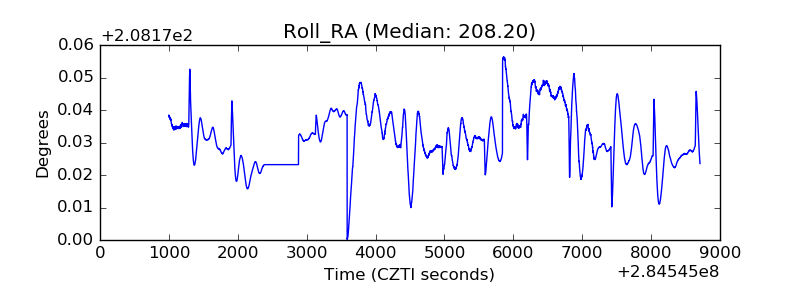 |
| Veto Counter | 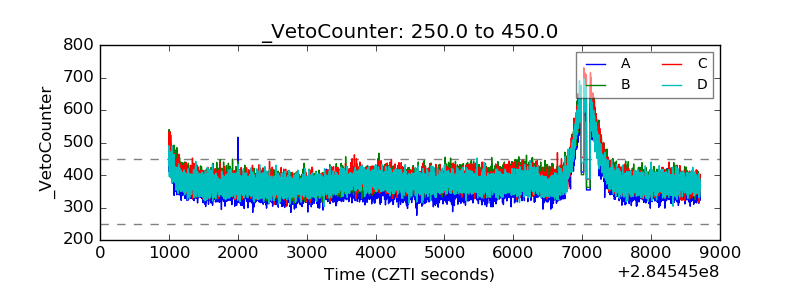 |