| Param | Original file | Final file |
|---|---|---|
| Filename | modeM0/AS1T03_042T01_9000002630_17722cztM0_level2.evt | modeM0/AS1T03_042T01_9000002630_17722cztM0_level2_quad_clean.evt |
| Size (bytes) | 520,853,760 | 90,146,880 |
| Size | 496.7 MB | 86.0 MB |
| Events in quadrant A | 3,415,023 | 566,990 |
| Events in quadrant B | 3,398,618 | 578,907 |
| Events in quadrant C | 3,365,294 | 552,964 |
| Events in quadrant D | 5,100,832 | 524,170 |
| Mode M9 | |||
|---|---|---|---|
| Quadrant | BADHDUFLAG | Total packets | Discarded packets |
| A | 0 | 3 | 0 |
| B | 0 | 3 | 0 |
| C | 0 | 3 | 0 |
| D | 0 | 3 | 0 |
| Mode M0 | |||
|---|---|---|---|
| Quadrant | BADHDUFLAG | Total packets | Discarded packets |
| A | 0 | 15023 | 1 |
| B | 0 | 14854 | 1 |
| C | 0 | 14760 | 1 |
| D | 0 | 20172 | 1 |
| Mode SS | |||
|---|---|---|---|
| Quadrant | BADHDUFLAG | Total packets | Discarded packets |
| A | 0 | 148 | 0 |
| B | 0 | 148 | 0 |
| C | 0 | 148 | 0 |
| D | 0 | 148 | 0 |
| Quadrant | Total seconds | Saturated seconds | Saturation percentage |
|---|---|---|---|
| A | 7275 | 98 | 1.347079% |
| B | 7276 | 97 | 1.333150% |
| C | 7276 | 128 | 1.759208% |
| D | 7276 | 475 | 6.528312% |
Noise dominated data is calculated using 1-second bins in cleaned event files. If a bin has >2000 counts, and if more than 50% of those come from <1% of pixels, then it is considered to be noise-dominated and hence unusable.
| Quadrant | # 1 sec bins | Bins with >0 counts | Bins with >2000 counts | High rate bins dominated by noise | Noise dominated (total time) | Noise dominated (detector-on time) | Marked lightcurve |
|---|---|---|---|---|---|---|---|
| A | 7590 | 7275 | 0 | 0 | 0.00% | 0.00% | 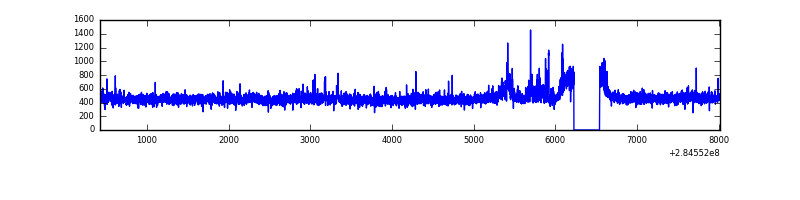 |
| B | 7591 | 7277 | 1 | 1 | 0.01% | 0.01% | 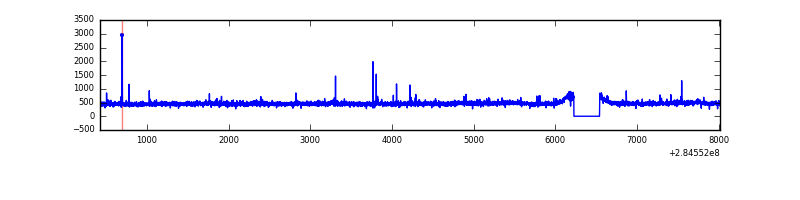 |
| C | 7591 | 7277 | 0 | 0 | 0.00% | 0.00% | 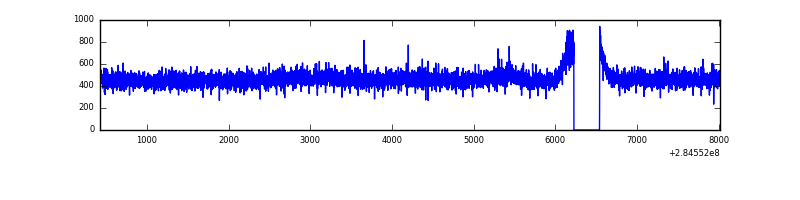 |
| D | 7591 | 7277 | 322 | 322 | 4.24% | 4.42% | 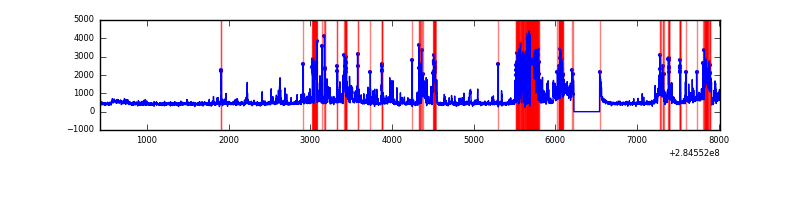 |
Top three noisy pixels from each quadrant. If the there are fewer than three noisy pixels in the level2.evt file, extra rows are filled as -1
| Pixel properties | Quadrant properties | ||||||
|---|---|---|---|---|---|---|---|
| Quadrant | DetID | PixID | Counts | Sigma | Mean | Median | Sigma |
| A | 12 | 16 | 99581 | 562.98 | 855 | 835 | 175.4 |
| A | 12 | 194 | 22519 | 123.63 | 855 | 835 | 175.4 |
| A | 0 | 226 | 7323 | 36.99 | 855 | 835 | 175.4 |
| B | 0 | 219 | 20740 | 120.95 | 851 | 830 | 164.6 |
| B | 12 | 111 | 20136 | 117.28 | 851 | 830 | 164.6 |
| B | 11 | 111 | 17428 | 100.83 | 851 | 830 | 164.6 |
| C | 14 | 238 | 126233 | 655.57 | 812 | 815 | 191.3 |
| C | 3 | 233 | 44374 | 227.69 | 812 | 815 | 191.3 |
| C | 5 | 218 | 28189 | 143.09 | 812 | 815 | 191.3 |
| D | 7 | 238 | 1707665 | 7959.43 | 800 | 779 | 214.4 |
| D | 5 | 222 | 115402 | 534.5 | 800 | 779 | 214.4 |
| D | 1 | 52 | 94956 | 439.16 | 800 | 779 | 214.4 |
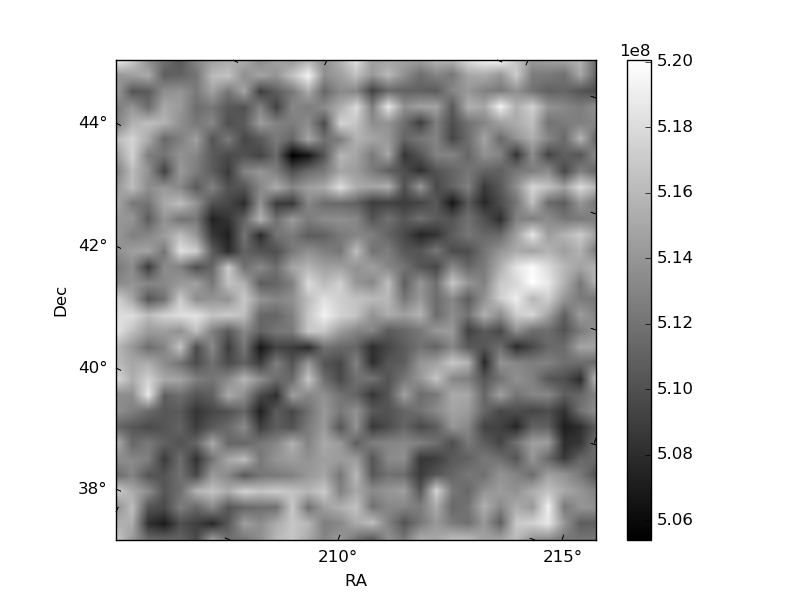
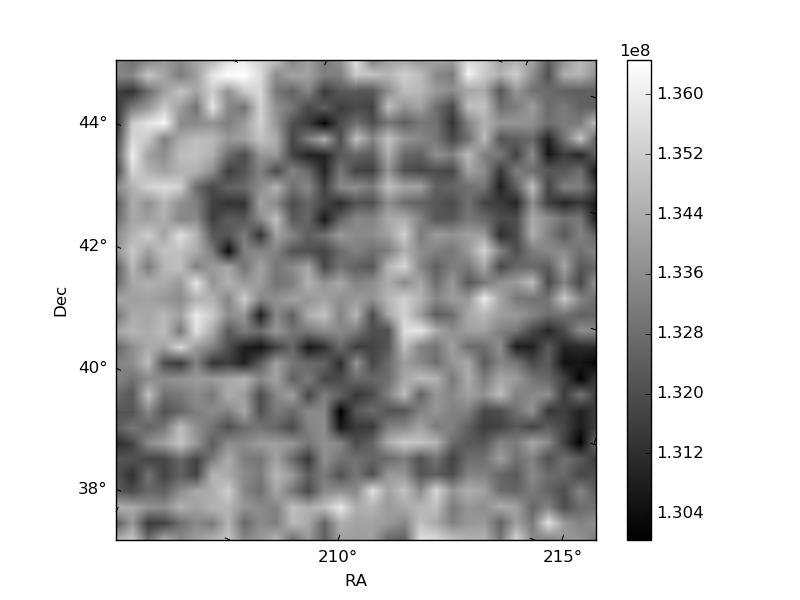
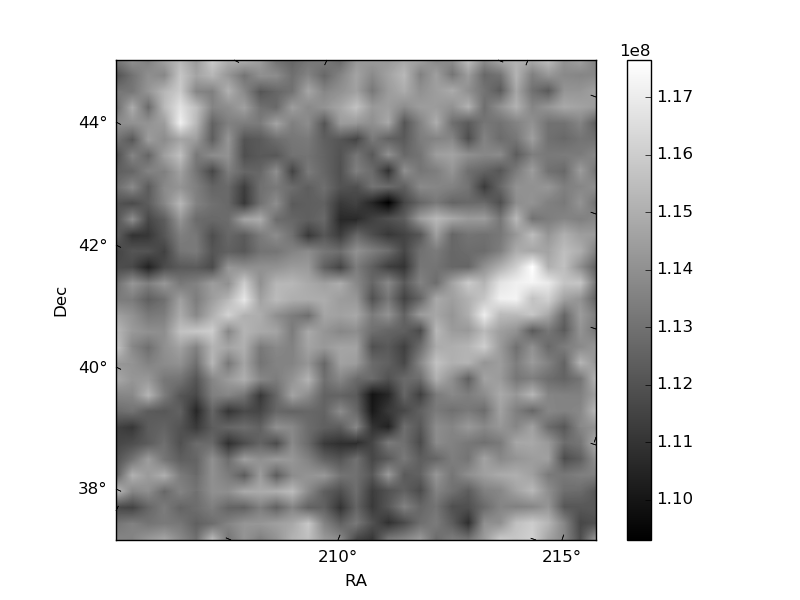
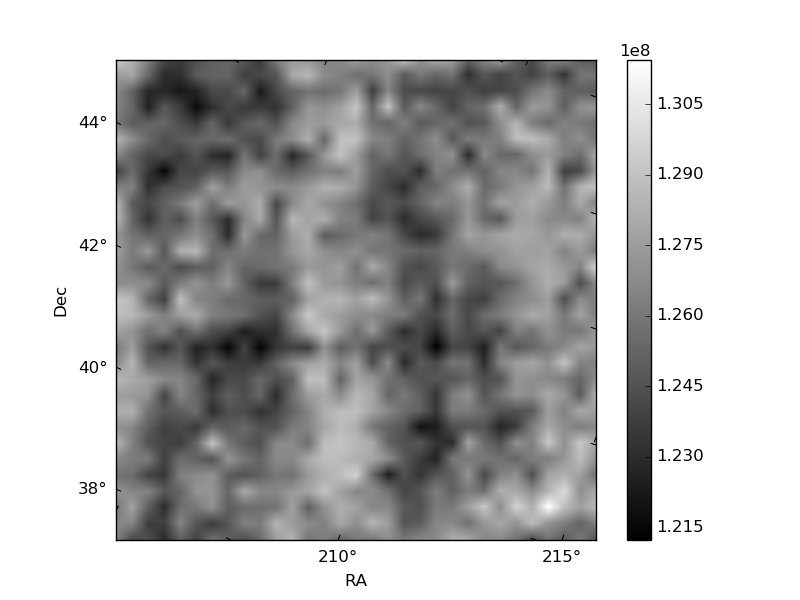
Histogram calculated using DETX and DETY for each event in the final _common_clean file
| Quadrant A | 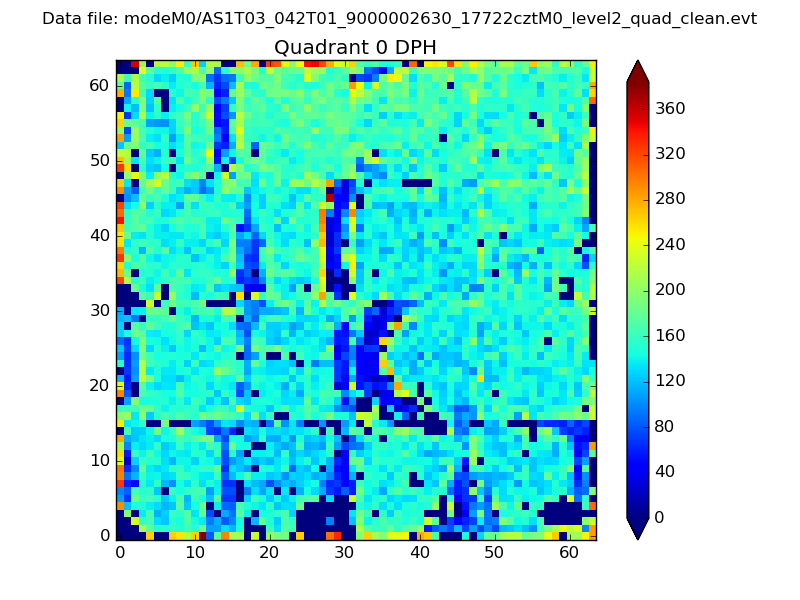 |
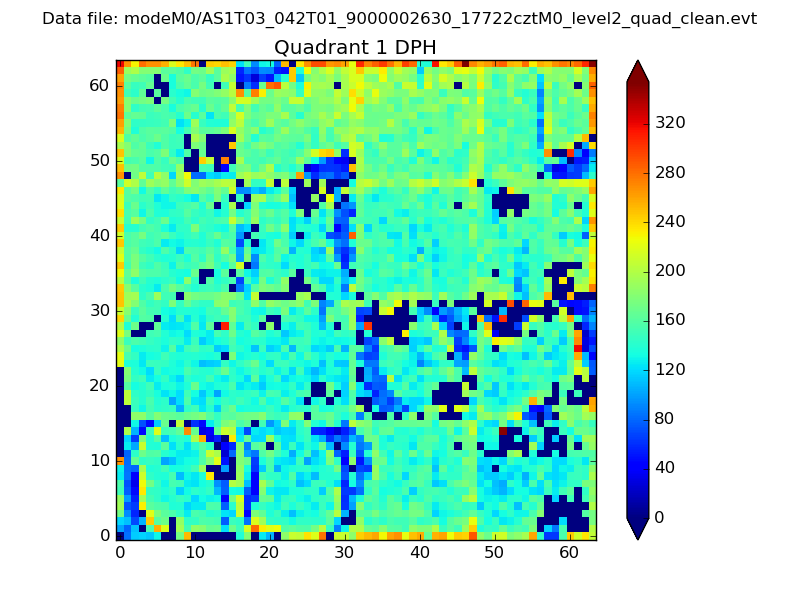 |
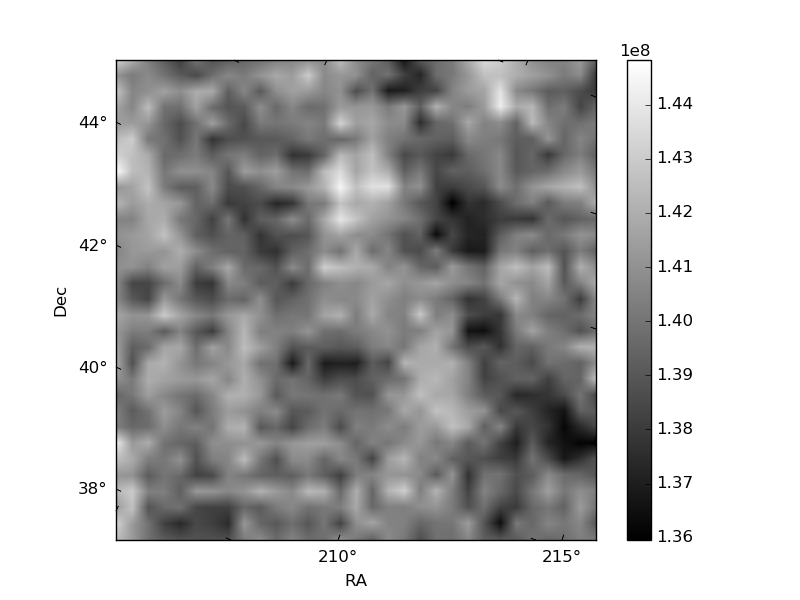
Quadrant B |
|---|---|---|---|
| Quadrant D | 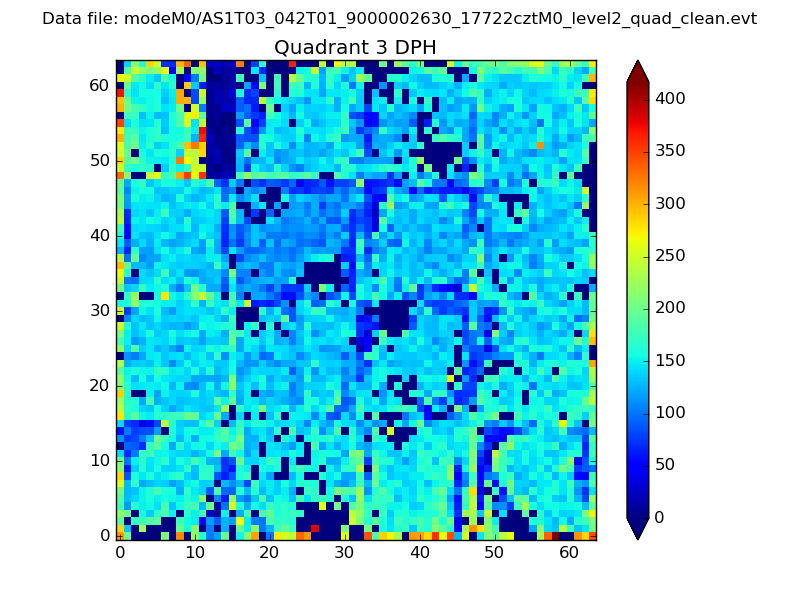 |
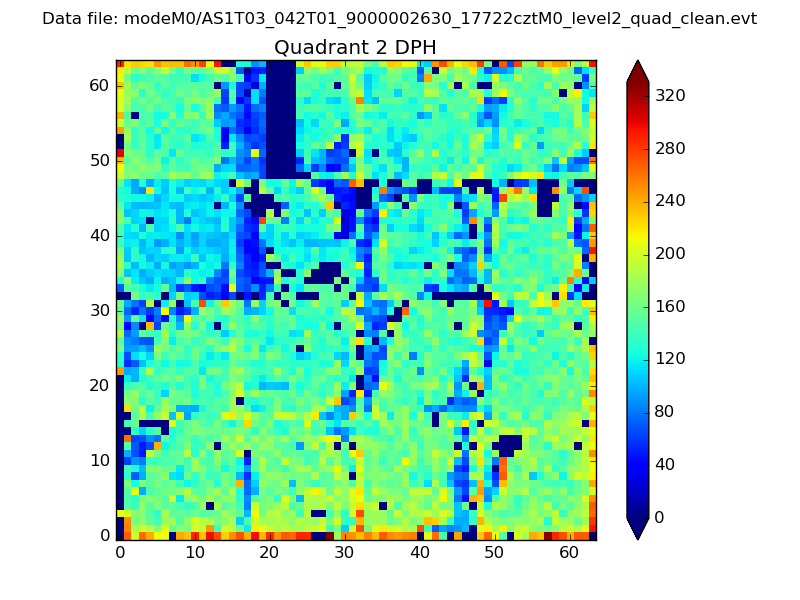 |
Quadrant C |
| Plot type | Count rate plots | Images |
|---|---|---|
| Comparison with Poisson distribution Blue bars denote a histogram of data divided into 1 sec bins. Red curve is a Poisson curve with rate = median count rate of data. |
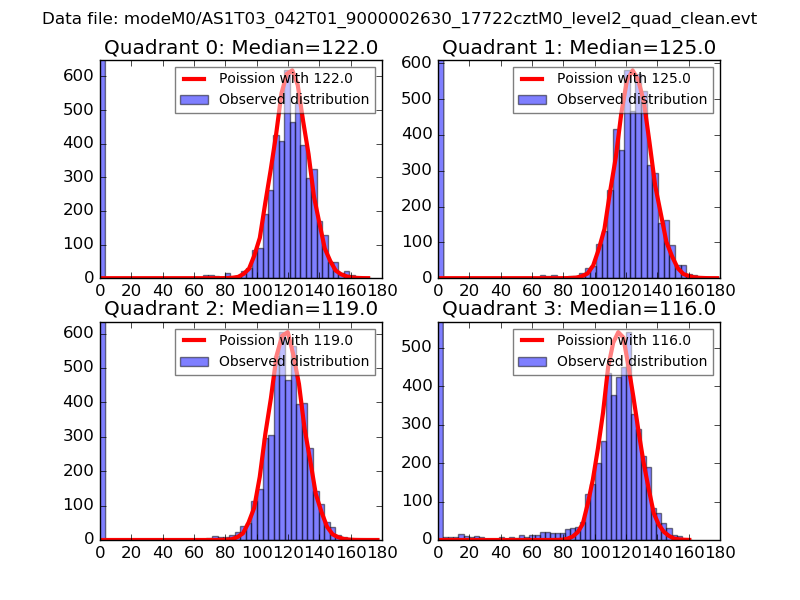 |
 |
| Quadrant-wise count rates Data is divided into 100 sec bins |
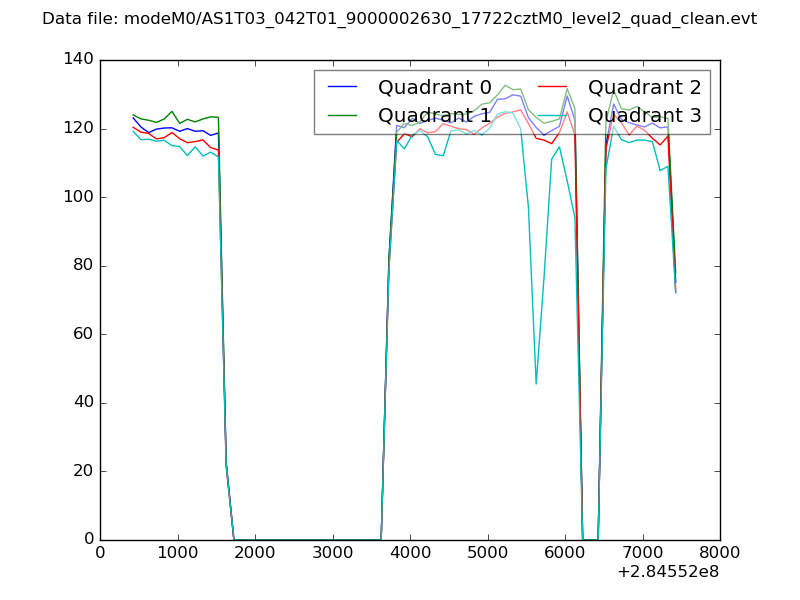 |
|
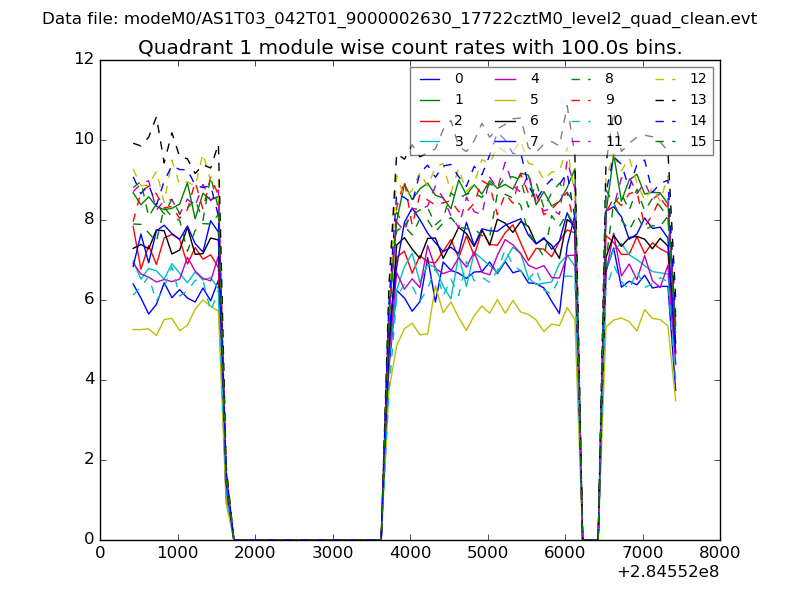
| Module-wise count rates for Quadrant A Data is divided into 100 sec bins |
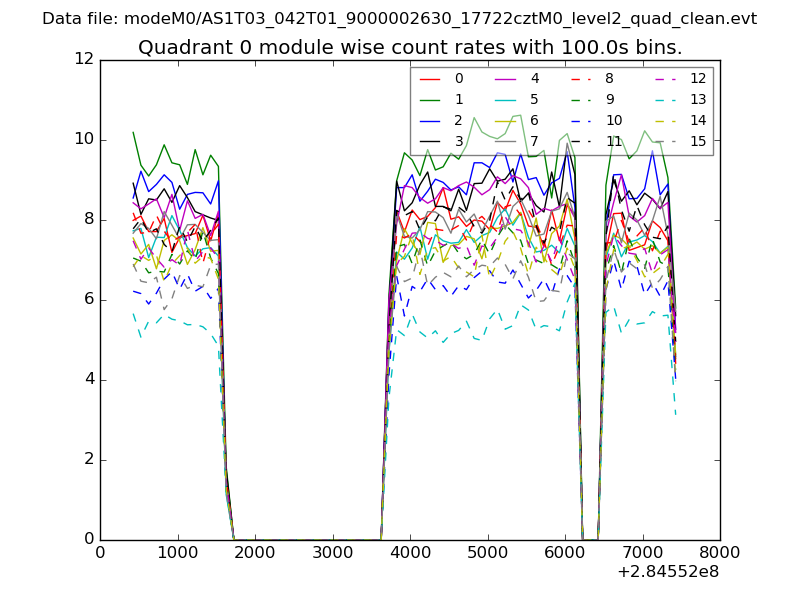 |
 |
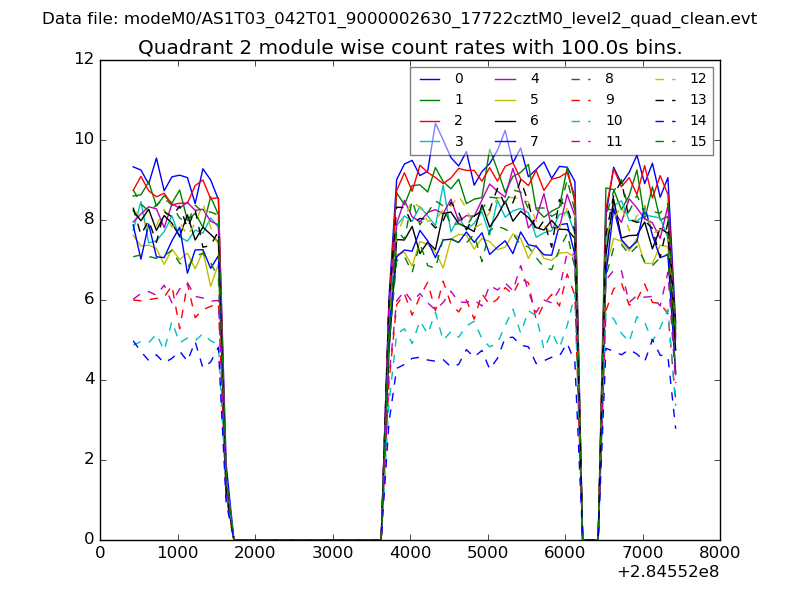
| Module-wise count rates for Quadrant B Data is divided into 100 sec bins |
 |
 |
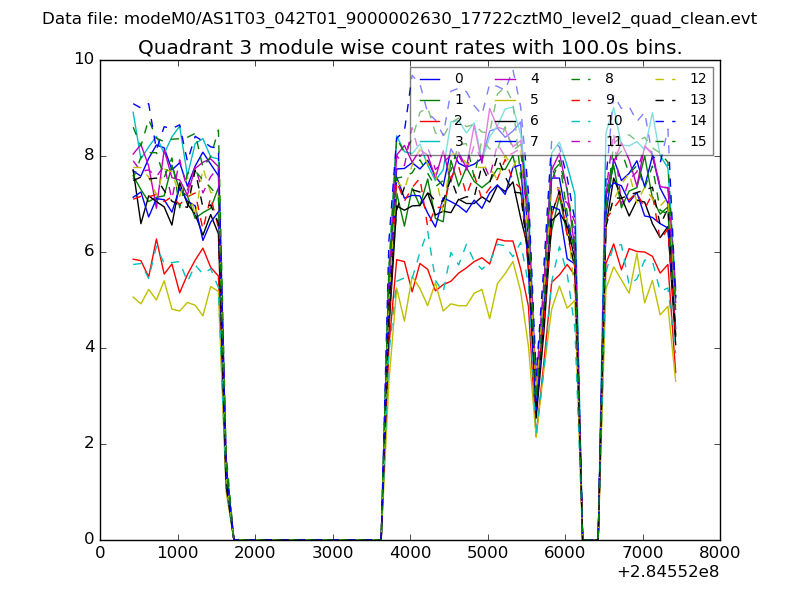
| Module-wise count rates for Quadrant C Data is divided into 100 sec bins |
 |
 |
| Module-wise count rates for Quadrant D Data is divided into 100 sec bins |
 |
 |
| Parameter | Plot |
|---|---|
| CZT HV Monitor | 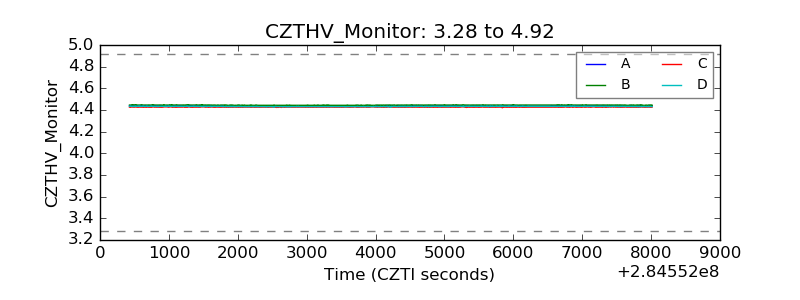 |
| D_VDD | 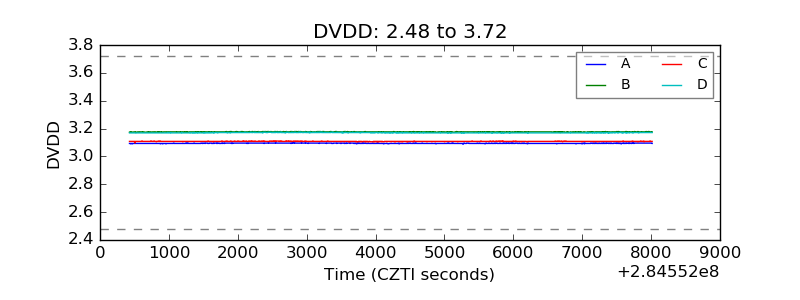 |
| Temperature 1 | 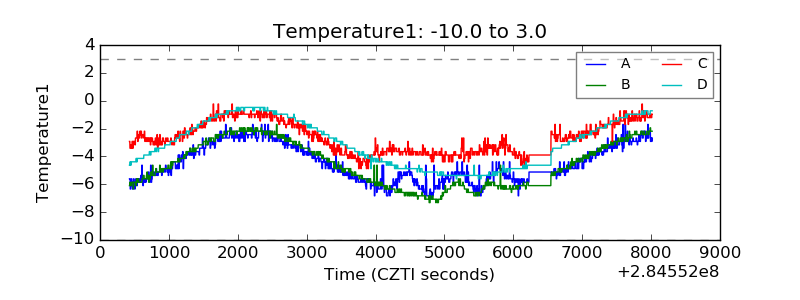 |
| Veto HV Monitor | 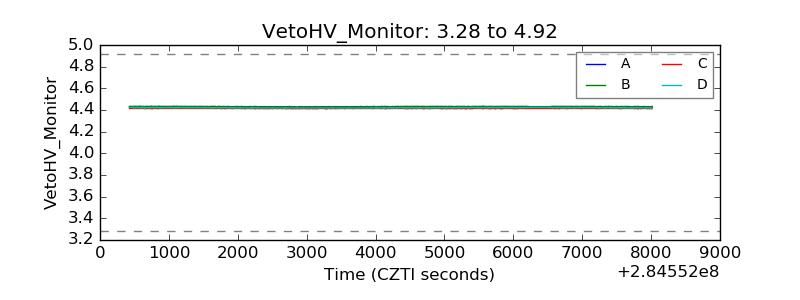 |
| Veto LLD | 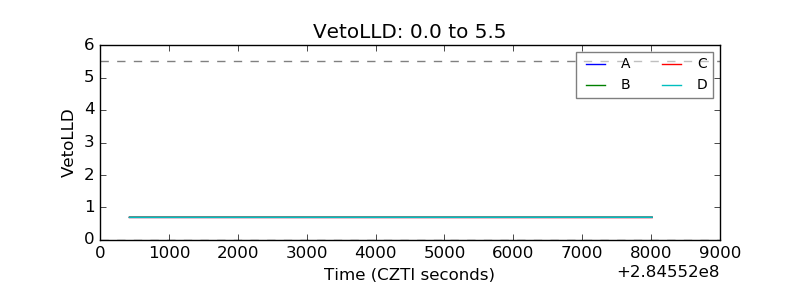 |
| Alpha Counter | 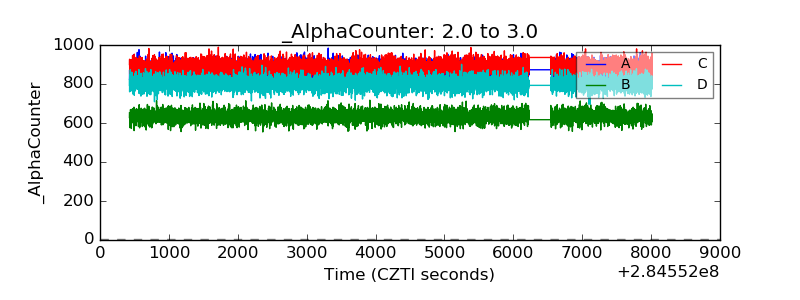 |
| _CPM_Rate | 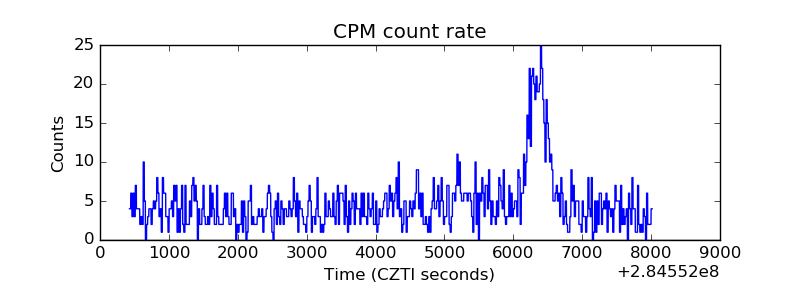 |
| CZT Counter | 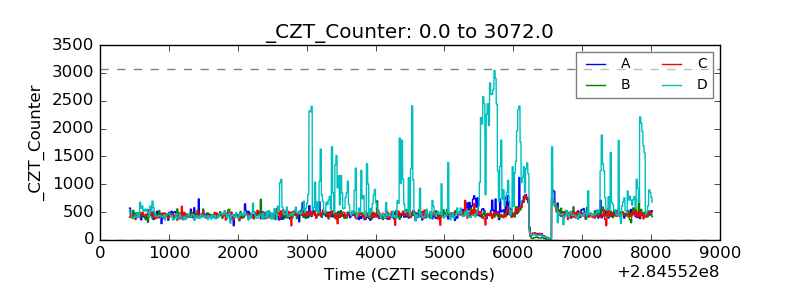 |
| +2.5 Volts monitor |  |
| +5 Volts monitor |  |
| _ROLL_ROT | 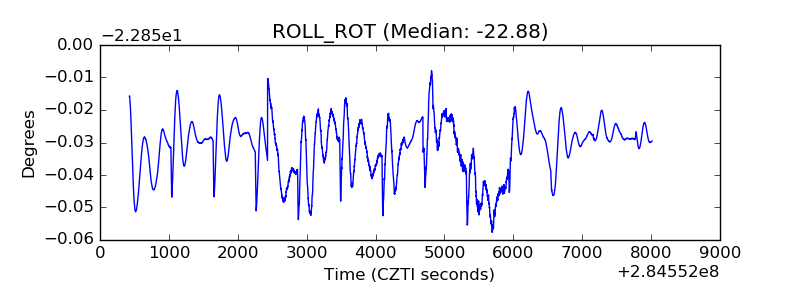 |
| _Roll_DEC | 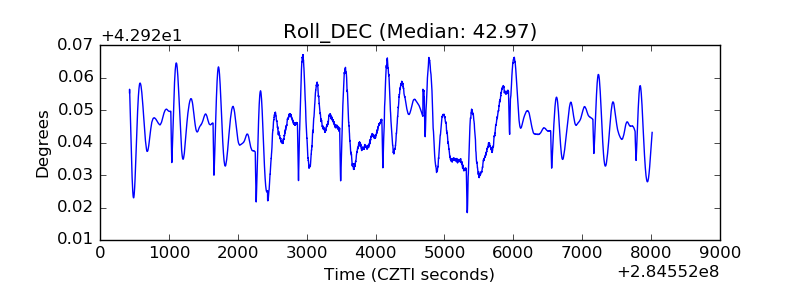 |
| _Roll_RA | 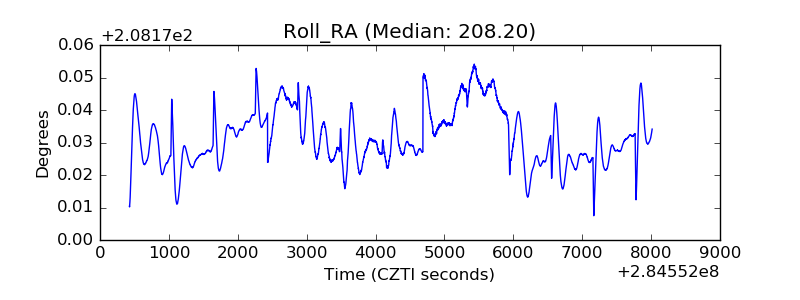 |
| Veto Counter | 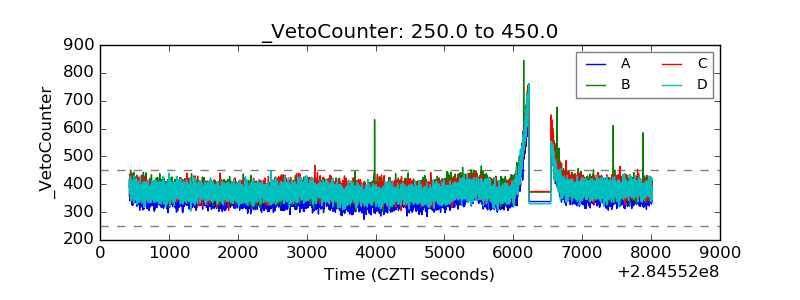 |