| Param | Original file | Final file |
|---|---|---|
| Filename | modeM0/AS1T03_042T01_9000002630_17725cztM0_level2.evt | modeM0/AS1T03_042T01_9000002630_17725cztM0_level2_quad_clean.evt |
| Size (bytes) | 1,621,419,840 | 196,709,760 |
| Size | 1.5 GB | 187.6 MB |
| Events in quadrant A | 8,709,022 | 1,236,978 |
| Events in quadrant B | 8,602,841 | 1,257,852 |
| Events in quadrant C | 8,667,376 | 1,208,058 |
| Events in quadrant D | 21,910,674 | 1,011,863 |
| Mode M9 | |||
|---|---|---|---|
| Quadrant | BADHDUFLAG | Total packets | Discarded packets |
| A | 0 | 20 | 0 |
| B | 0 | 20 | 0 |
| C | 0 | 20 | 0 |
| D | 0 | 20 | 0 |
| Mode M0 | |||
|---|---|---|---|
| Quadrant | BADHDUFLAG | Total packets | Discarded packets |
| A | 0 | 38200 | 3 |
| B | 0 | 37301 | 3 |
| C | 0 | 37022 | 3 |
| D | 0 | 77171 | 3 |
| Mode SS | |||
|---|---|---|---|
| Quadrant | BADHDUFLAG | Total packets | Discarded packets |
| A | 0 | 366 | 0 |
| B | 0 | 366 | 0 |
| C | 0 | 366 | 0 |
| D | 0 | 366 | 0 |
| Quadrant | Total seconds | Saturated seconds | Saturation percentage |
|---|---|---|---|
| A | 18011 | 260 | 1.443562% |
| B | 18011 | 195 | 1.082672% |
| C | 18012 | 215 | 1.193649% |
| D | 18012 | 4319 | 23.978459% |
Noise dominated data is calculated using 1-second bins in cleaned event files. If a bin has >2000 counts, and if more than 50% of those come from <1% of pixels, then it is considered to be noise-dominated and hence unusable.
| Quadrant | # 1 sec bins | Bins with >0 counts | Bins with >2000 counts | High rate bins dominated by noise | Noise dominated (total time) | Noise dominated (detector-on time) | Marked lightcurve |
|---|---|---|---|---|---|---|---|
| A | 20066 | 18012 | 42 | 42 | 0.21% | 0.23% |  |
| B | 20066 | 18012 | 24 | 24 | 0.12% | 0.13% | 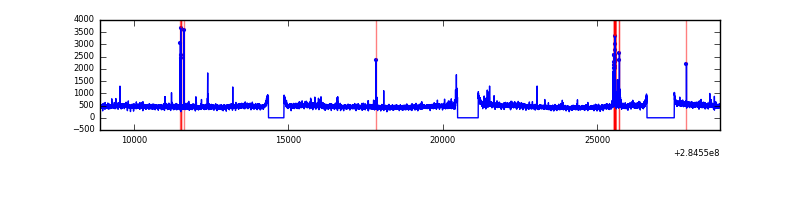 |
| C | 20067 | 18015 | 0 | 0 | 0.00% | 0.00% | 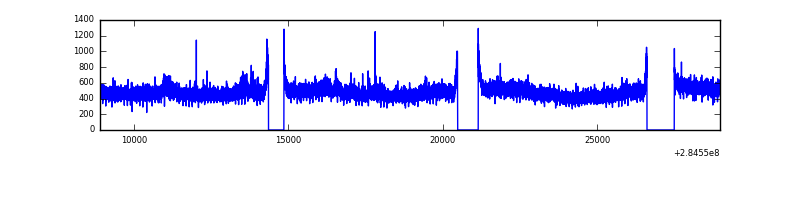 |
| D | 20067 | 18013 | 3884 | 3884 | 19.36% | 21.56% | 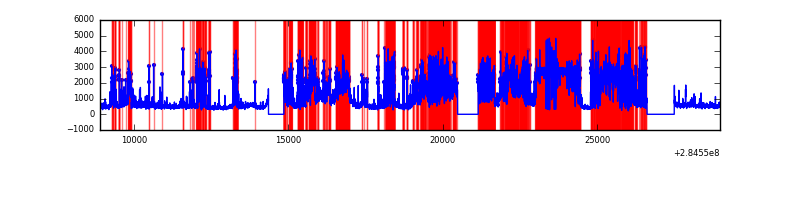 |
Top three noisy pixels from each quadrant. If the there are fewer than three noisy pixels in the level2.evt file, extra rows are filled as -1
| Pixel properties | Quadrant properties | ||||||
|---|---|---|---|---|---|---|---|
| Quadrant | DetID | PixID | Counts | Sigma | Mean | Median | Sigma |
| A | 15 | 174 | 500786 | 1162.96 | 2126 | 2075 | 428.8 |
| A | 0 | 226 | 18833 | 39.08 | 2126 | 2075 | 428.8 |
| A | 12 | 194 | 16691 | 34.08 | 2126 | 2075 | 428.8 |
| B | 10 | 245 | 166398 | 404.33 | 2127 | 2070 | 406.4 |
| B | 12 | 111 | 49765 | 117.35 | 2127 | 2070 | 406.4 |
| B | 11 | 111 | 43577 | 102.13 | 2127 | 2070 | 406.4 |
| C | 14 | 238 | 316408 | 658.72 | 2044 | 2052 | 477.2 |
| C | 3 | 233 | 264413 | 549.77 | 2044 | 2052 | 477.2 |
| C | 5 | 218 | 110028 | 226.26 | 2044 | 2052 | 477.2 |
| D | 7 | 238 | 13989178 | 28008.29 | 1842 | 1802 | 499.4 |
| D | 13 | 232 | 269028 | 535.09 | 1842 | 1802 | 499.4 |
| D | 7 | 222 | 156183 | 309.13 | 1842 | 1802 | 499.4 |
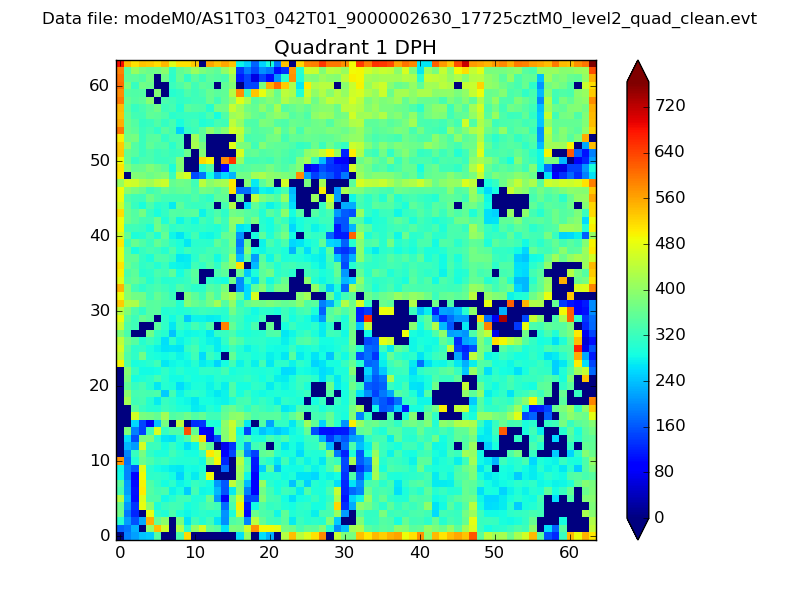
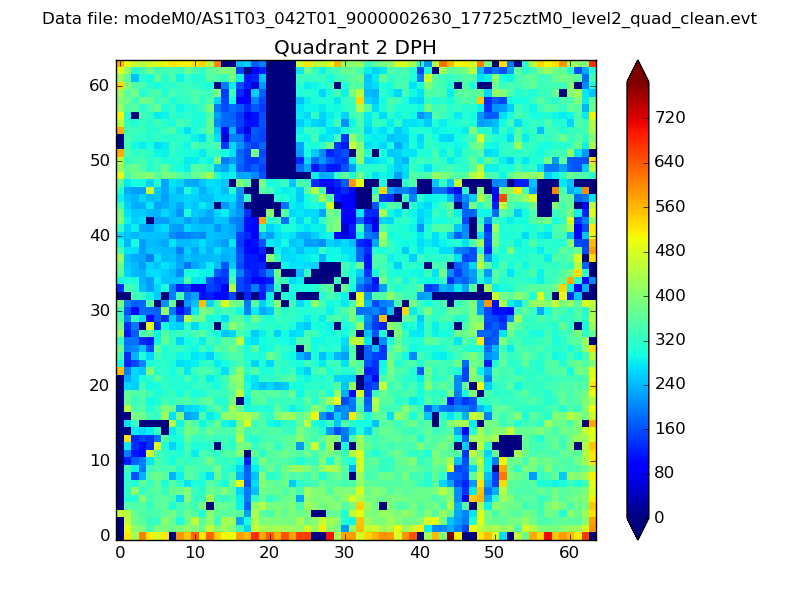
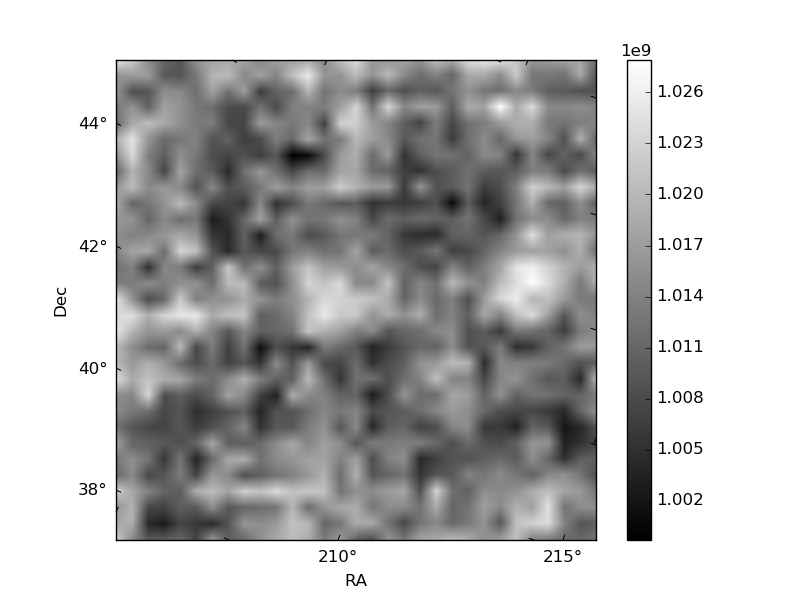
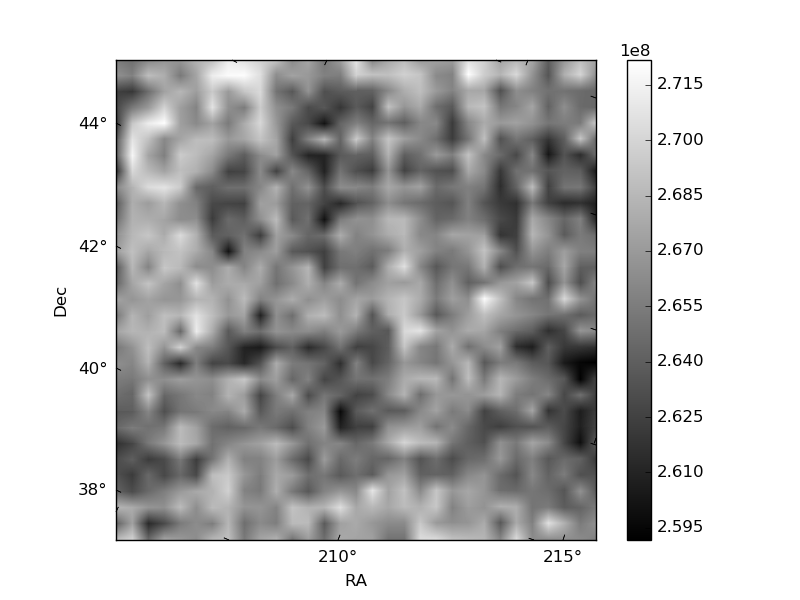
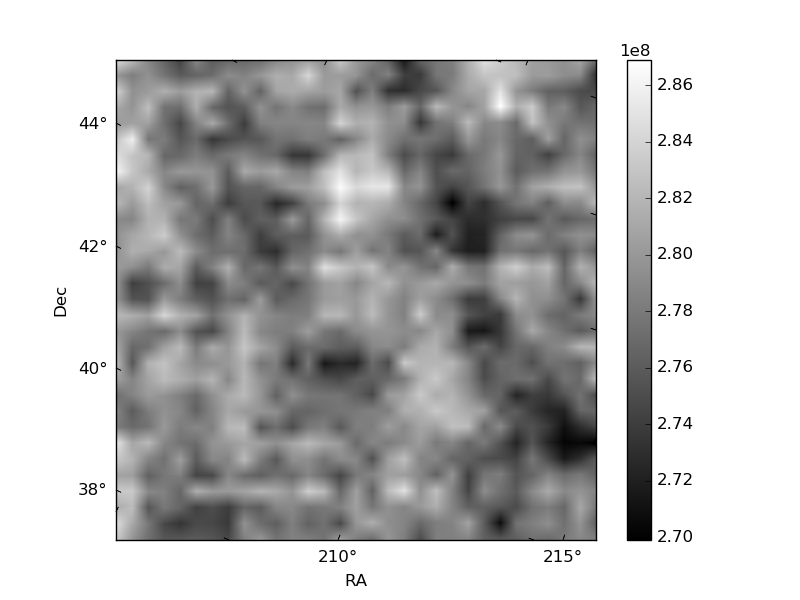
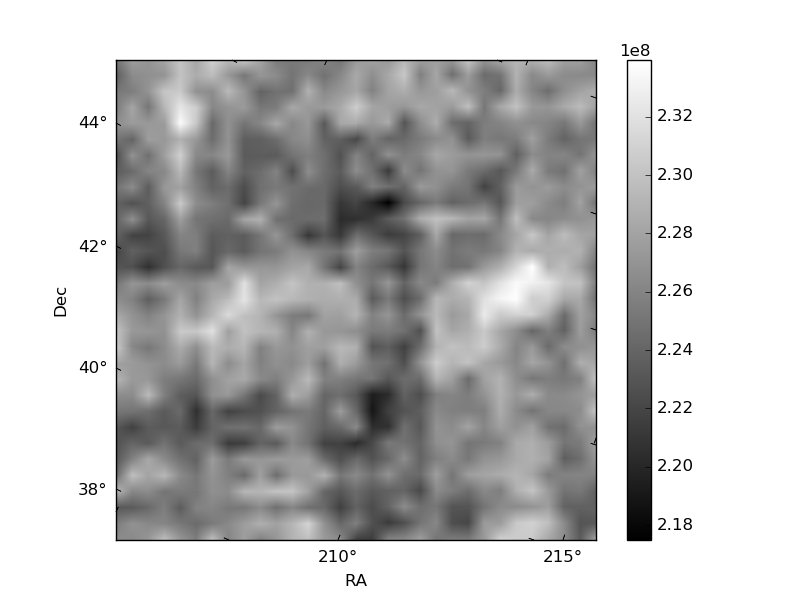
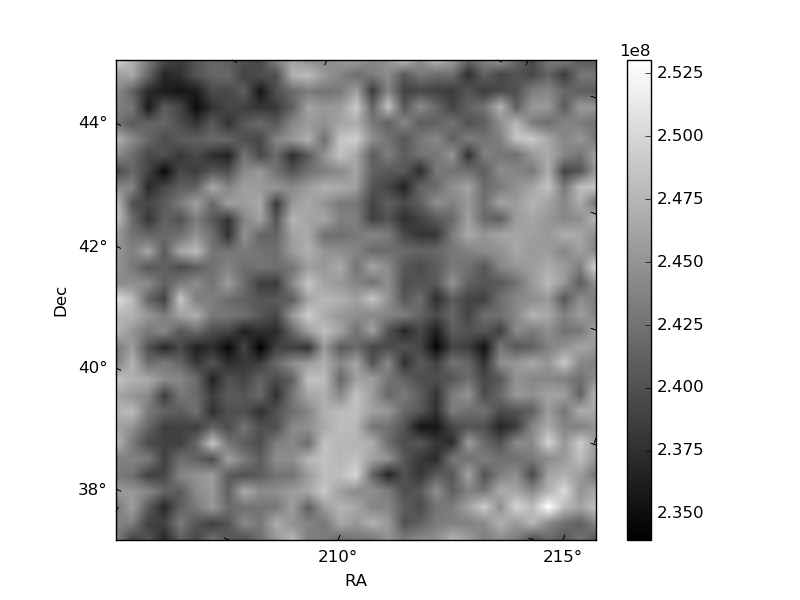
Histogram calculated using DETX and DETY for each event in the final _common_clean file
| Quadrant A | 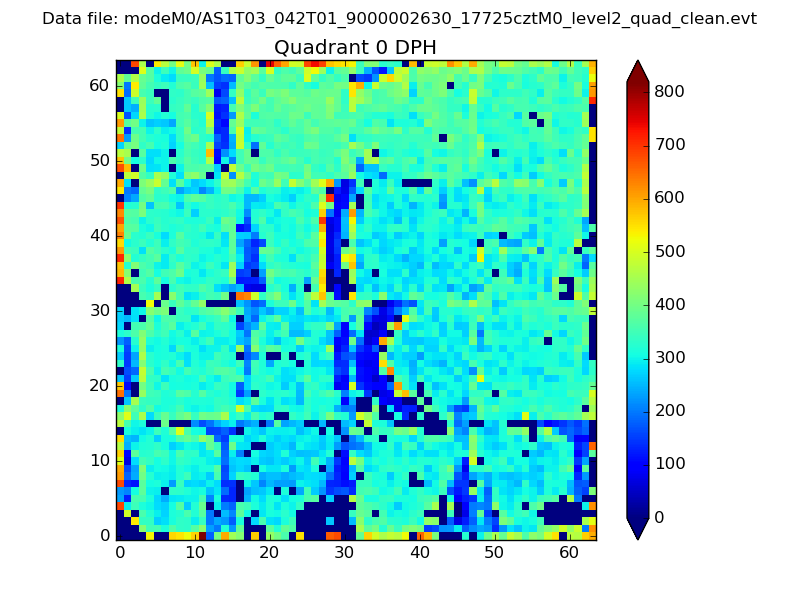 |
 |
Quadrant B |
|---|---|---|---|
| Quadrant D | 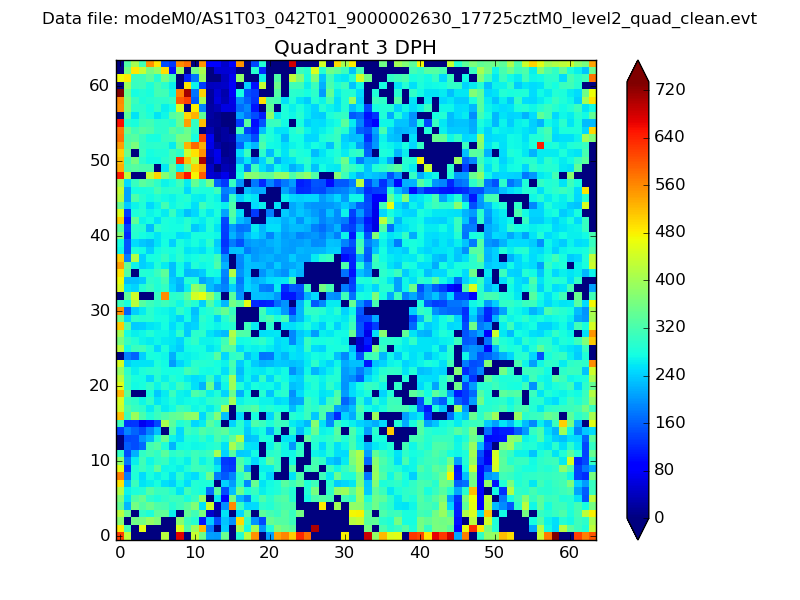 |
 |
Quadrant C |
| Plot type | Count rate plots | Images |
|---|---|---|
| Comparison with Poisson distribution Blue bars denote a histogram of data divided into 1 sec bins. Red curve is a Poisson curve with rate = median count rate of data. |
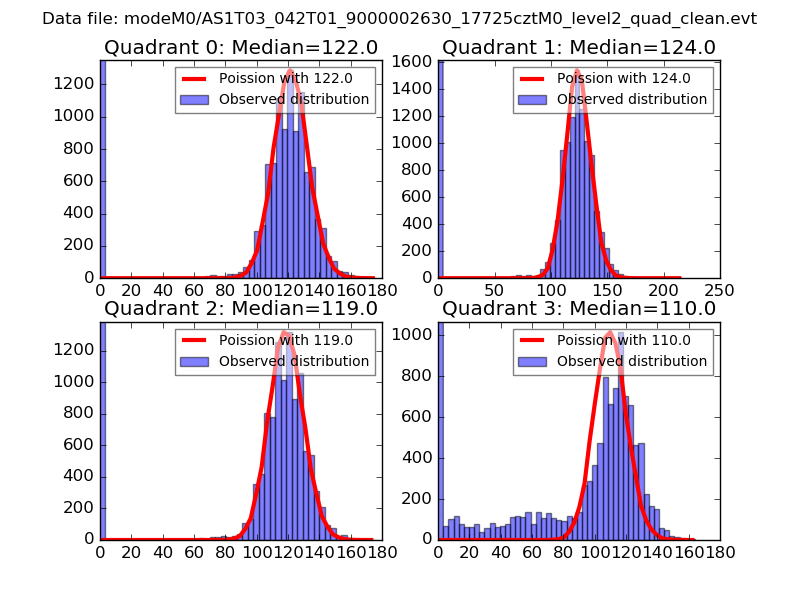 |
 |
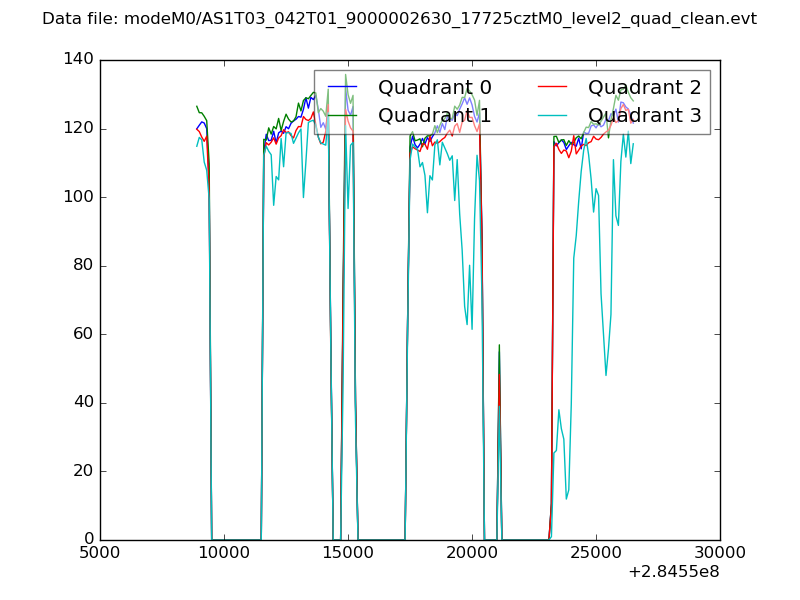
| Quadrant-wise count rates Data is divided into 100 sec bins |
 |
|
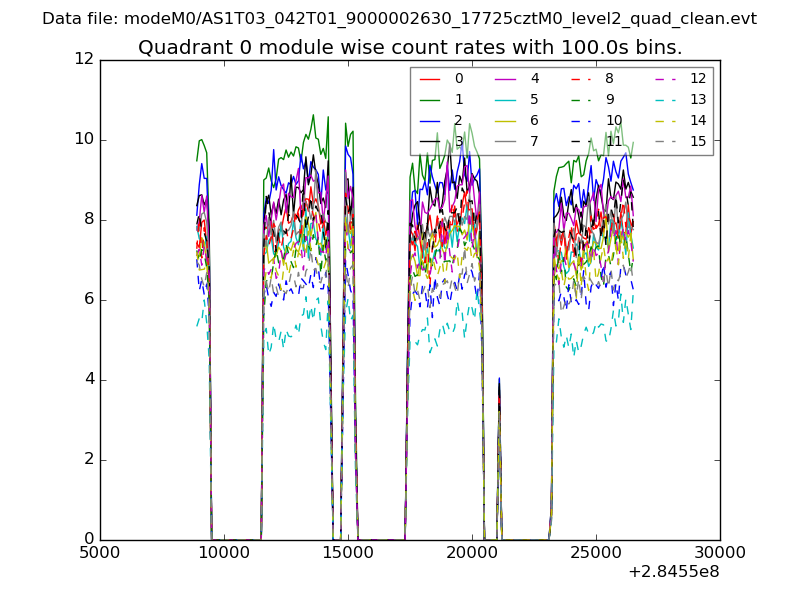
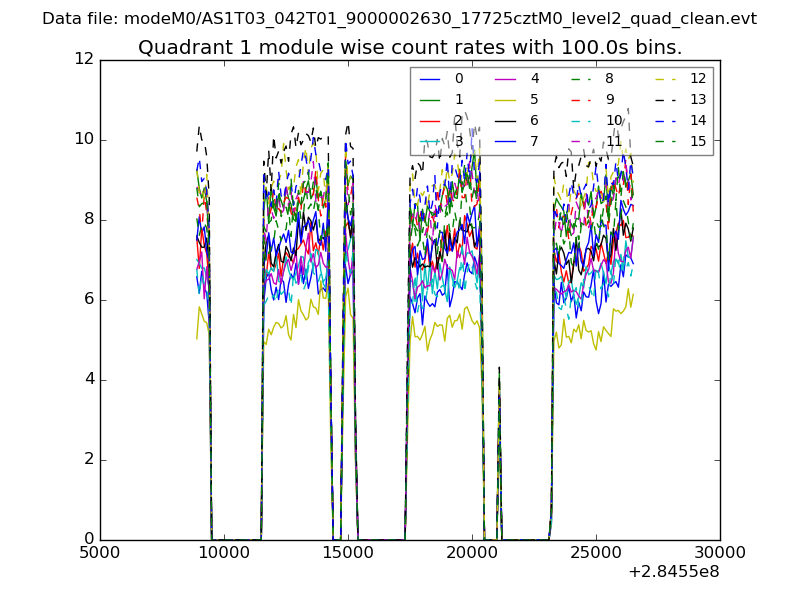
| Module-wise count rates for Quadrant A Data is divided into 100 sec bins |
 |
 |
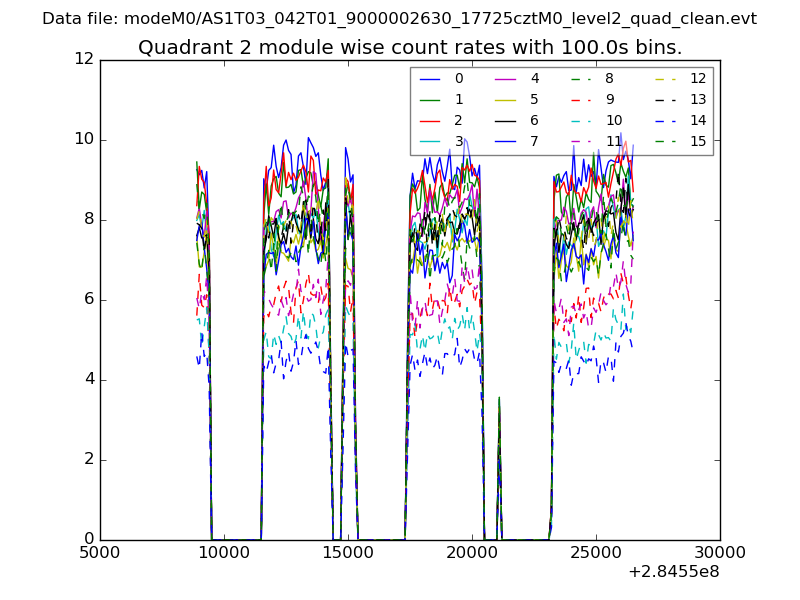
| Module-wise count rates for Quadrant B Data is divided into 100 sec bins |
 |
 |
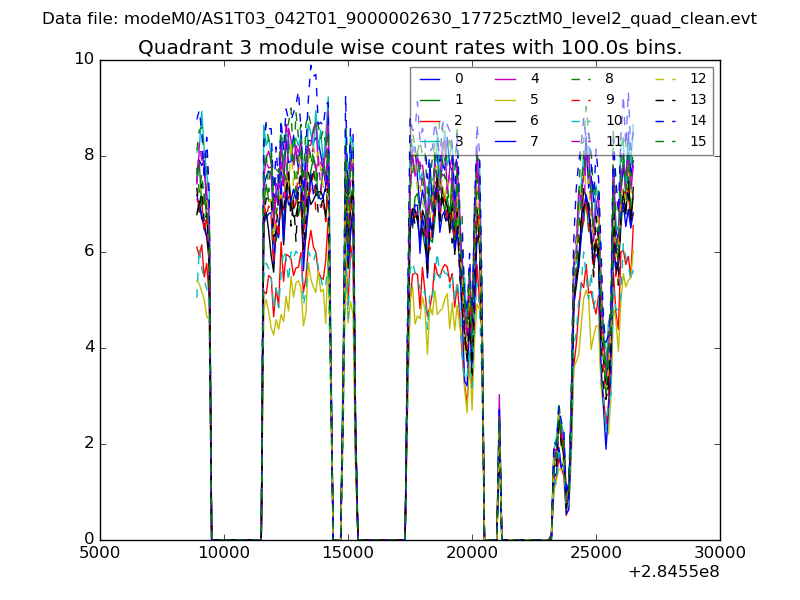
| Module-wise count rates for Quadrant C Data is divided into 100 sec bins |
 |
 |
| Module-wise count rates for Quadrant D Data is divided into 100 sec bins |
 |
 |
| Parameter | Plot |
|---|---|
| CZT HV Monitor | 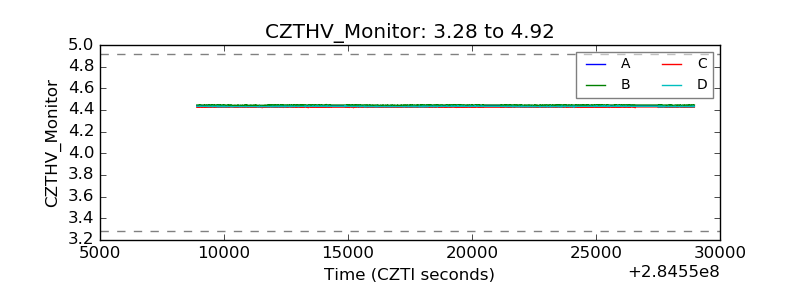 |
| D_VDD |  |
| Temperature 1 | 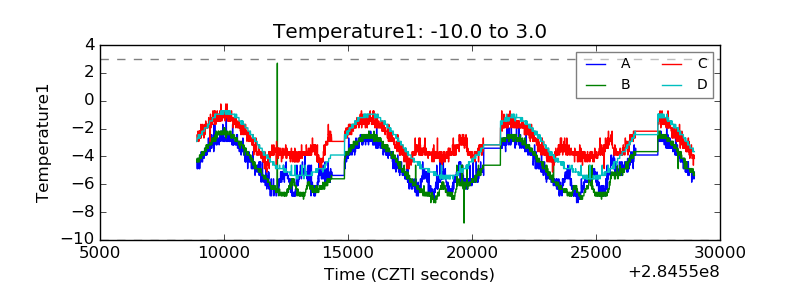 |
| Veto HV Monitor | 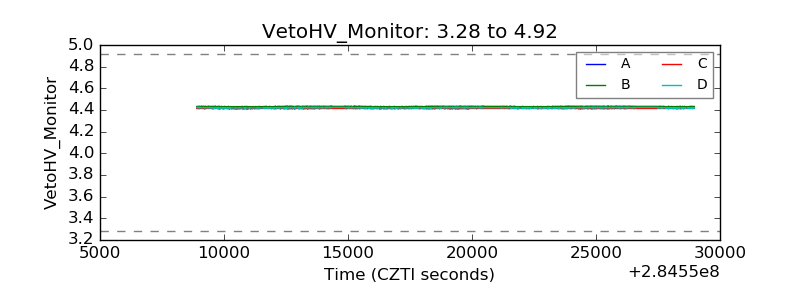 |
| Veto LLD | 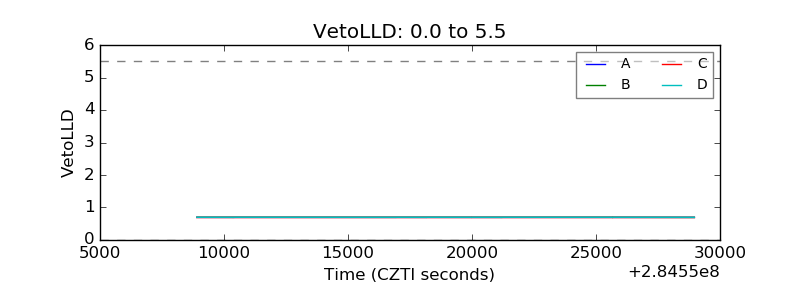 |
| Alpha Counter | 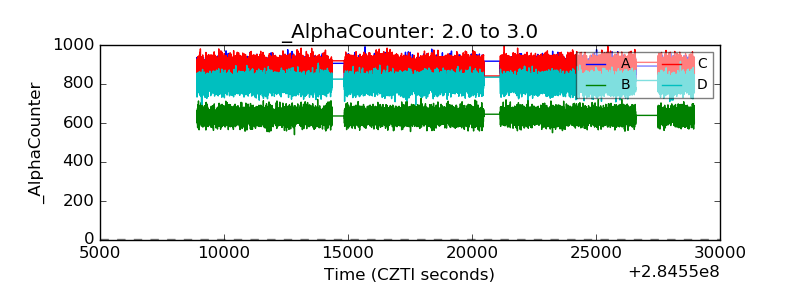 |
| _CPM_Rate | 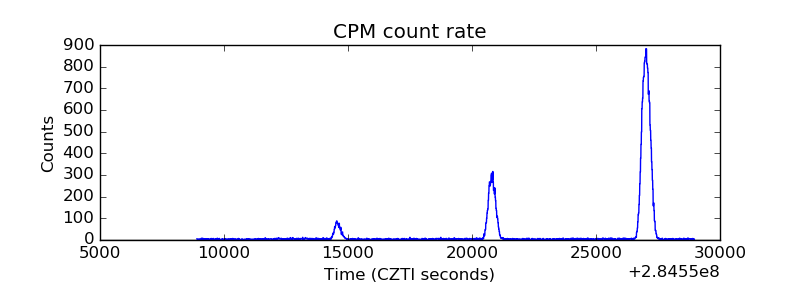 |
| CZT Counter | 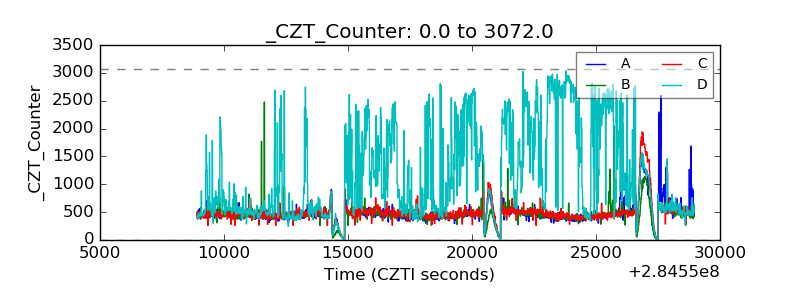 |
| +2.5 Volts monitor |  |
| +5 Volts monitor |  |
| _ROLL_ROT | 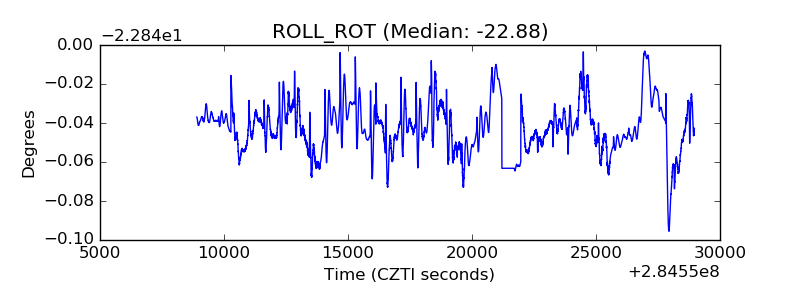 |
| _Roll_DEC | 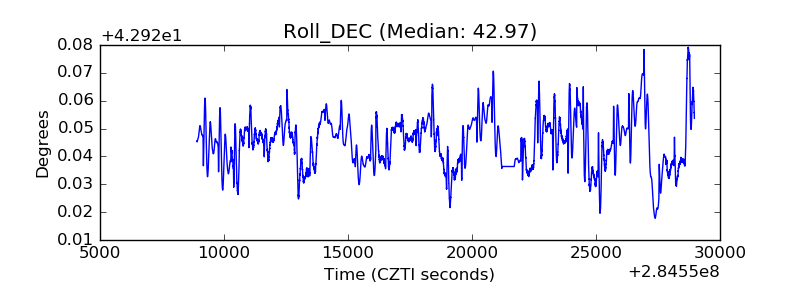 |
| _Roll_RA | 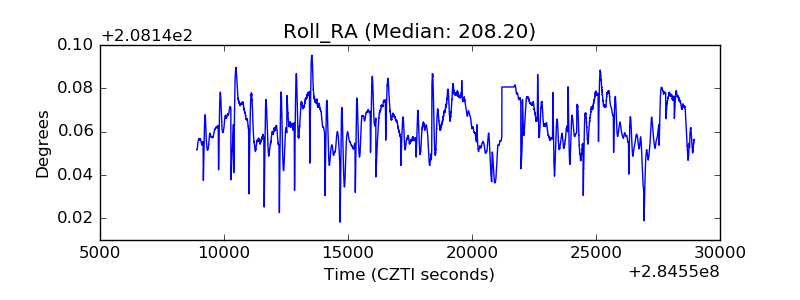 |
| Veto Counter | 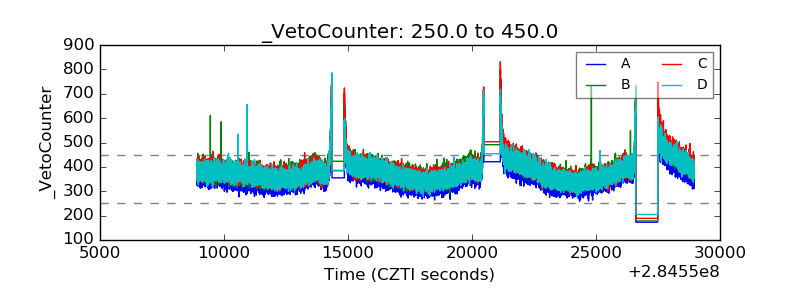 |