| Param | Original file | Final file |
|---|---|---|
| Filename | modeM0/AS1T03_042T01_9000002630_17729cztM0_level2.evt | modeM0/AS1T03_042T01_9000002630_17729cztM0_level2_quad_clean.evt |
| Size (bytes) | 506,309,760 | 95,221,440 |
| Size | 482.9 MB | 90.8 MB |
| Events in quadrant A | 3,207,833 | 619,085 |
| Events in quadrant B | 3,195,917 | 639,455 |
| Events in quadrant C | 3,181,381 | 614,516 |
| Events in quadrant D | 5,323,258 | 573,243 |
| Mode M9 | |||
|---|---|---|---|
| Quadrant | BADHDUFLAG | Total packets | Discarded packets |
| A | 0 | 16 | 0 |
| B | 0 | 17 | 0 |
| C | 0 | 17 | 0 |
| D | 0 | 17 | 0 |
| Mode M0 | |||
|---|---|---|---|
| Quadrant | BADHDUFLAG | Total packets | Discarded packets |
| A | 0 | 13702 | 2 |
| B | 0 | 13659 | 2 |
| C | 0 | 13571 | 2 |
| D | 0 | 20112 | 2 |
| Mode SS | |||
|---|---|---|---|
| Quadrant | BADHDUFLAG | Total packets | Discarded packets |
| A | 0 | 126 | 0 |
| B | 0 | 126 | 0 |
| C | 0 | 126 | 0 |
| D | 0 | 126 | 0 |
| Quadrant | Total seconds | Saturated seconds | Saturation percentage |
|---|---|---|---|
| A | 6272 | 47 | 0.749362% |
| B | 6272 | 53 | 0.845026% |
| C | 6272 | 94 | 1.498724% |
| D | 6271 | 676 | 10.779780% |
Noise dominated data is calculated using 1-second bins in cleaned event files. If a bin has >2000 counts, and if more than 50% of those come from <1% of pixels, then it is considered to be noise-dominated and hence unusable.
| Quadrant | # 1 sec bins | Bins with >0 counts | Bins with >2000 counts | High rate bins dominated by noise | Noise dominated (total time) | Noise dominated (detector-on time) | Marked lightcurve |
|---|---|---|---|---|---|---|---|
| A | 7527 | 6273 | 11 | 11 | 0.15% | 0.18% | 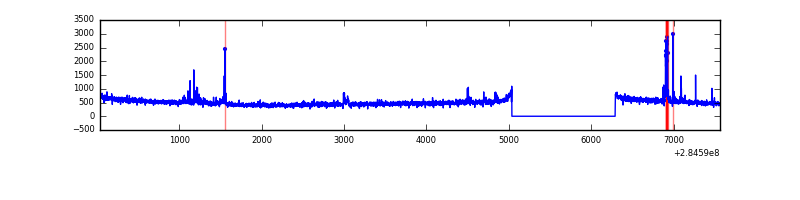 |
| B | 7527 | 6273 | 1 | 1 | 0.01% | 0.02% | 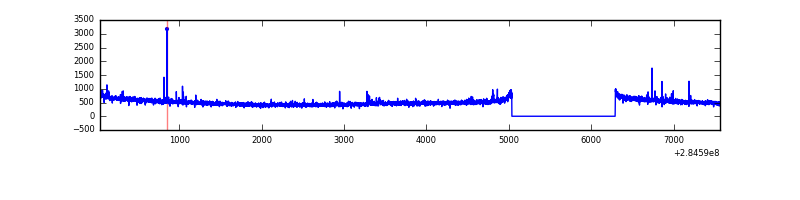 |
| C | 7527 | 6272 | 0 | 0 | 0.00% | 0.00% | 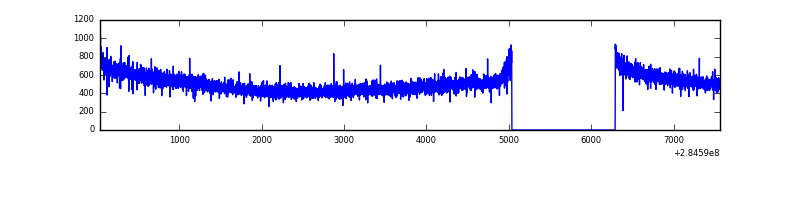 |
| D | 7526 | 6271 | 531 | 531 | 7.06% | 8.47% | 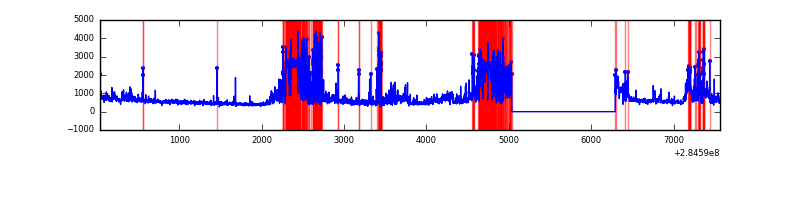 |
Top three noisy pixels from each quadrant. If the there are fewer than three noisy pixels in the level2.evt file, extra rows are filled as -1
| Pixel properties | Quadrant properties | ||||||
|---|---|---|---|---|---|---|---|
| Quadrant | DetID | PixID | Counts | Sigma | Mean | Median | Sigma |
| A | 15 | 174 | 117328 | 730.62 | 795 | 781 | 159.5 |
| A | 15 | 31 | 23393 | 141.75 | 795 | 781 | 159.5 |
| A | 15 | 191 | 12487 | 73.38 | 795 | 781 | 159.5 |
| B | 10 | 245 | 24170 | 154.84 | 802 | 782 | 151.0 |
| B | 12 | 111 | 17496 | 110.65 | 802 | 782 | 151.0 |
| B | 11 | 111 | 15121 | 94.93 | 802 | 782 | 151.0 |
| C | 14 | 238 | 123390 | 682.89 | 774 | 781 | 179.5 |
| C | 5 | 218 | 21499 | 115.39 | 774 | 781 | 179.5 |
| C | 3 | 233 | 16427 | 87.14 | 774 | 781 | 179.5 |
| D | 7 | 238 | 2422809 | 12396.1 | 725 | 710 | 195.4 |
| D | 1 | 52 | 81743 | 414.72 | 725 | 710 | 195.4 |
| D | 2 | 234 | 26585 | 132.43 | 725 | 710 | 195.4 |
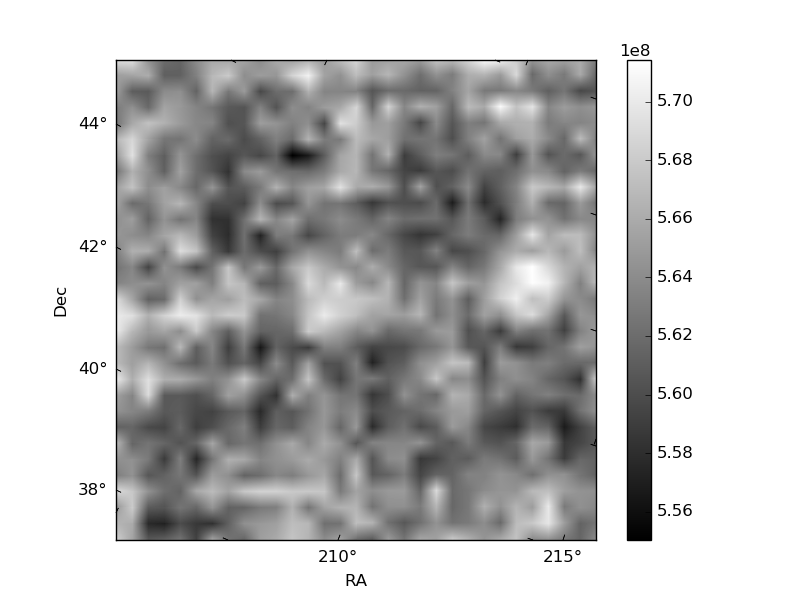
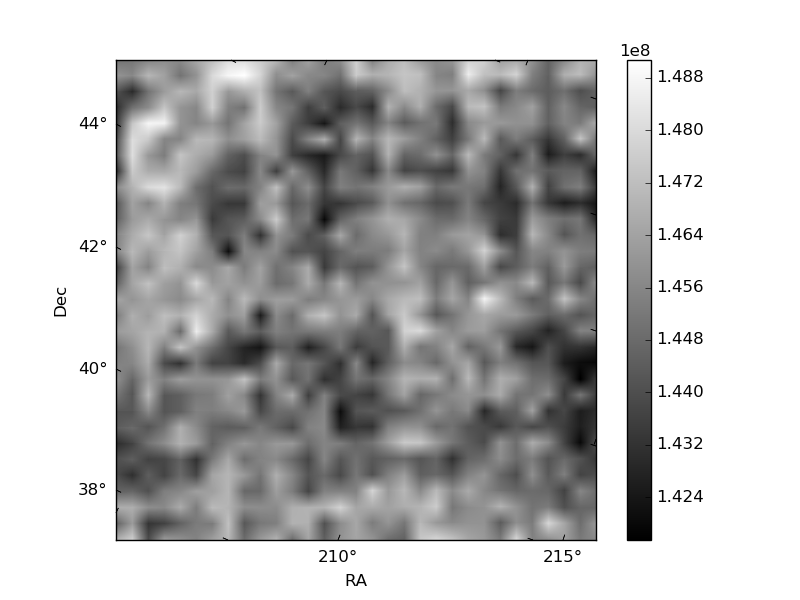
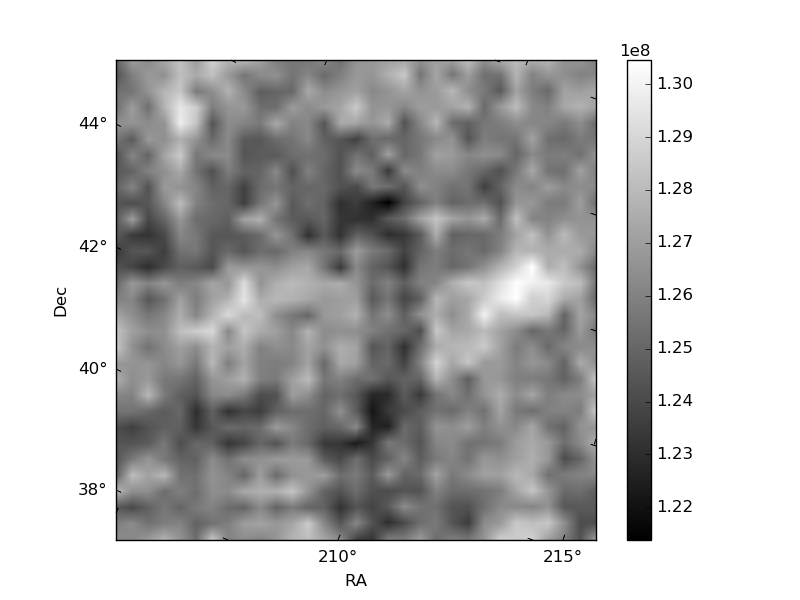
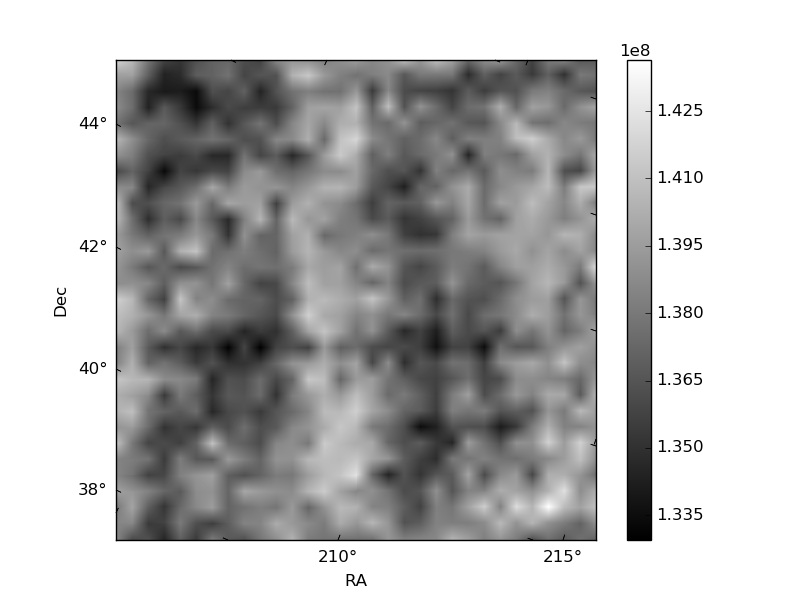
Histogram calculated using DETX and DETY for each event in the final _common_clean file
| Quadrant A | 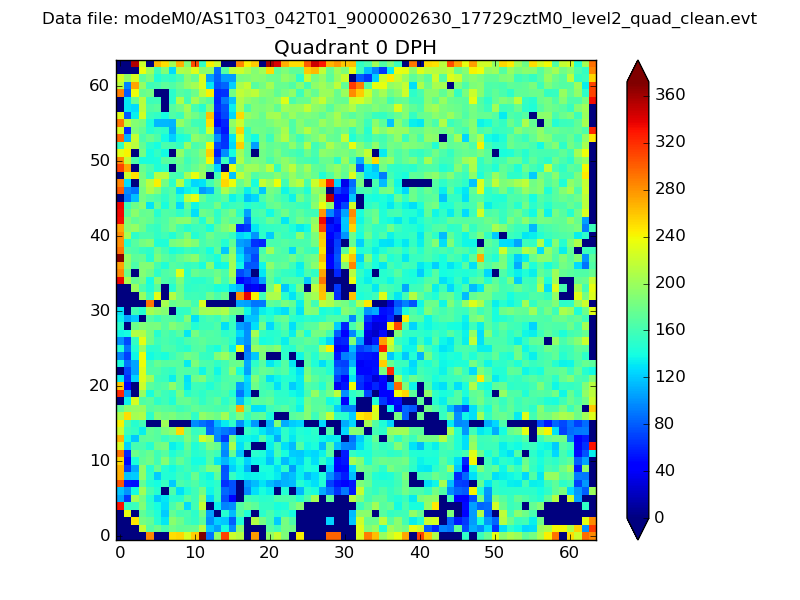 |
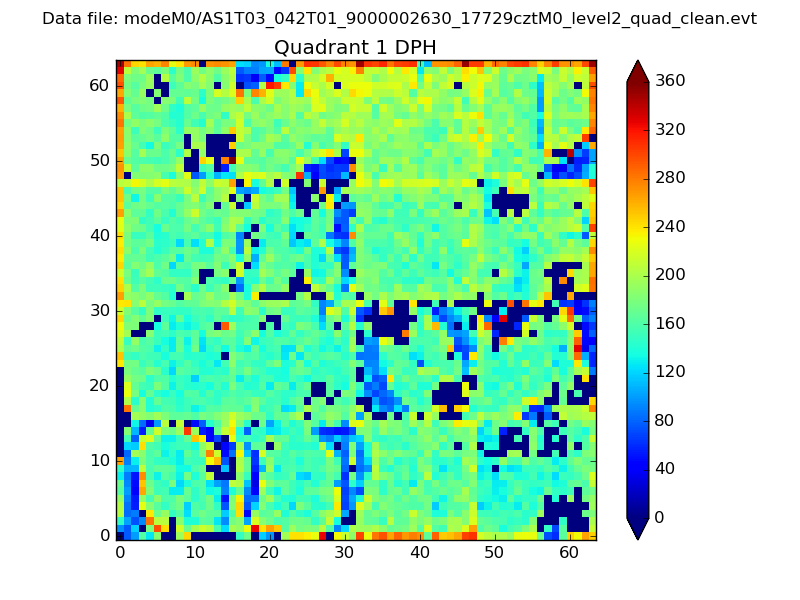 |
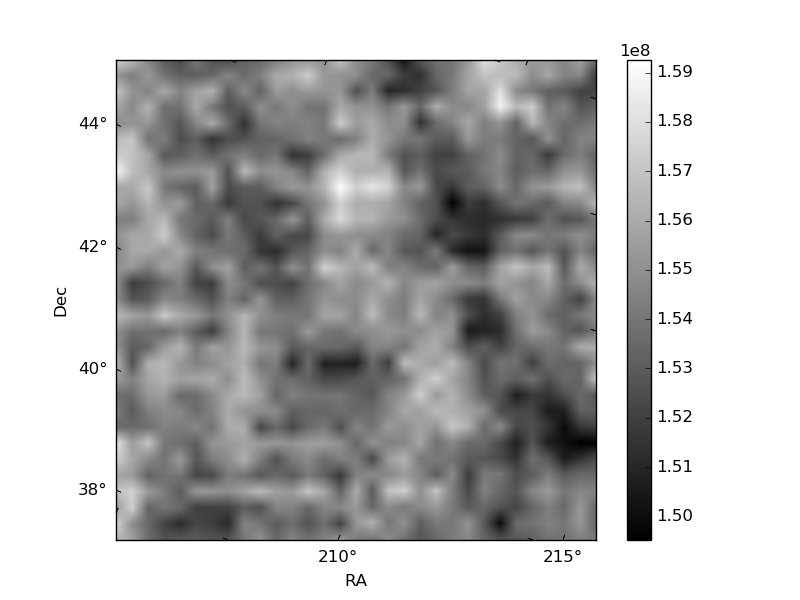
Quadrant B |
|---|---|---|---|
| Quadrant D | 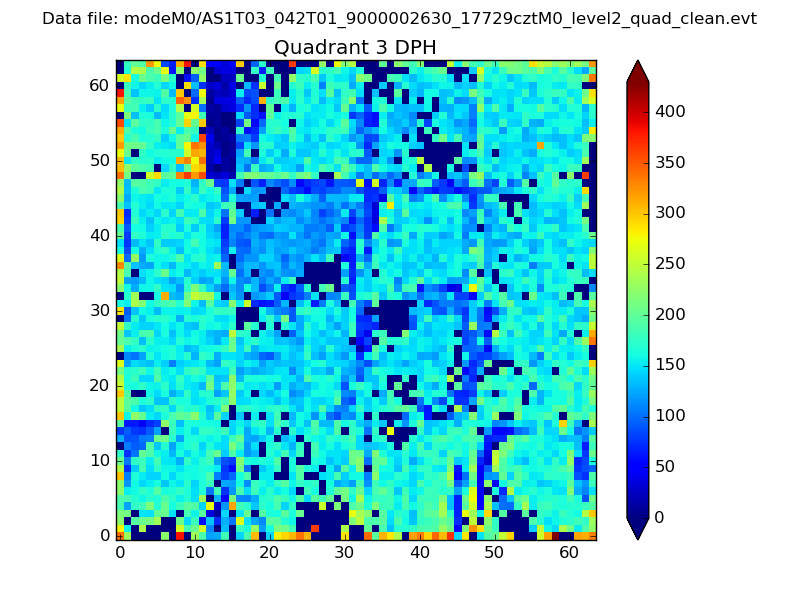 |
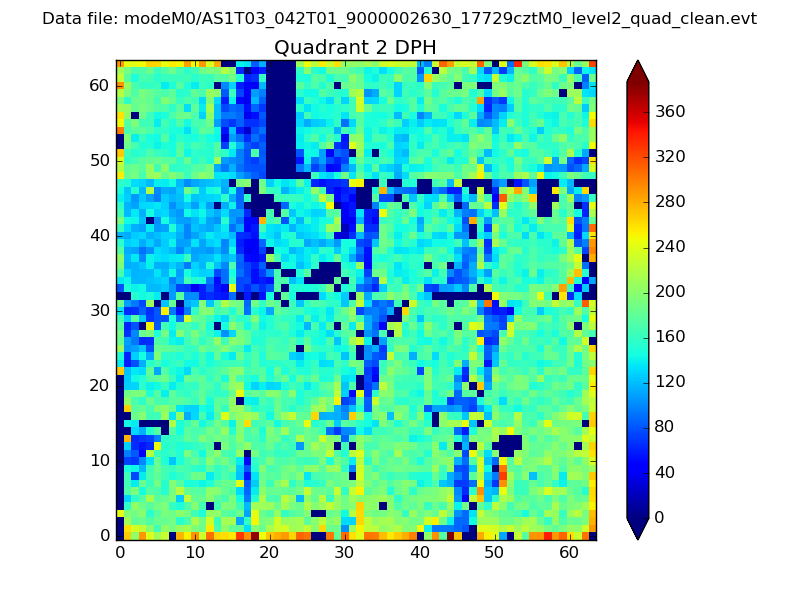 |
Quadrant C |
| Plot type | Count rate plots | Images |
|---|---|---|
| Comparison with Poisson distribution Blue bars denote a histogram of data divided into 1 sec bins. Red curve is a Poisson curve with rate = median count rate of data. |
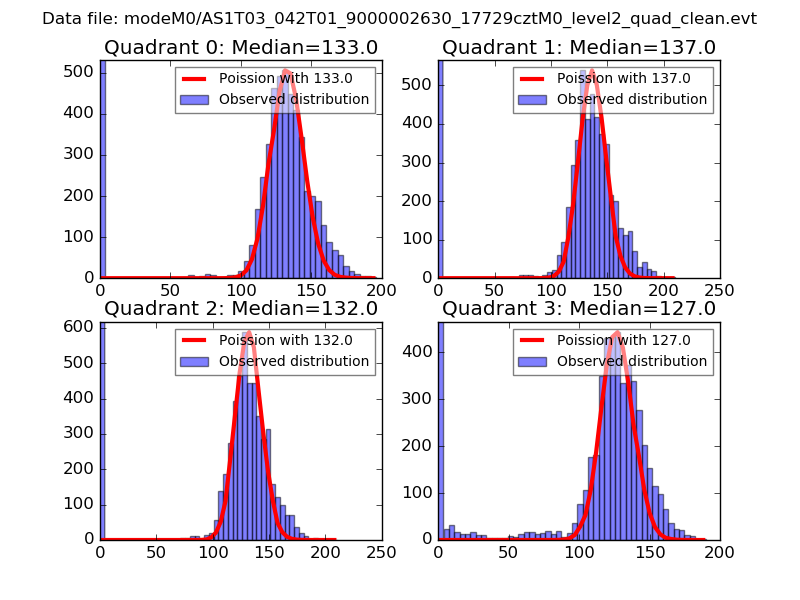 |
 |
| Quadrant-wise count rates Data is divided into 100 sec bins |
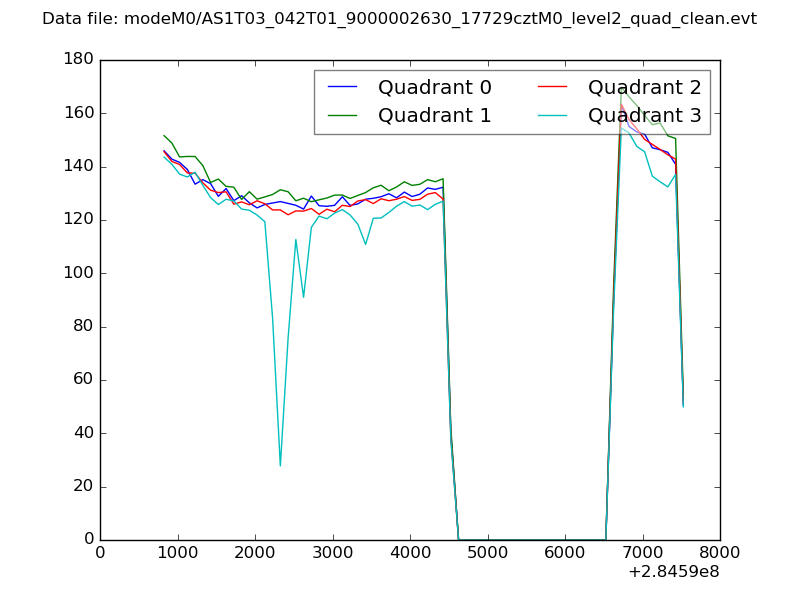 |
|
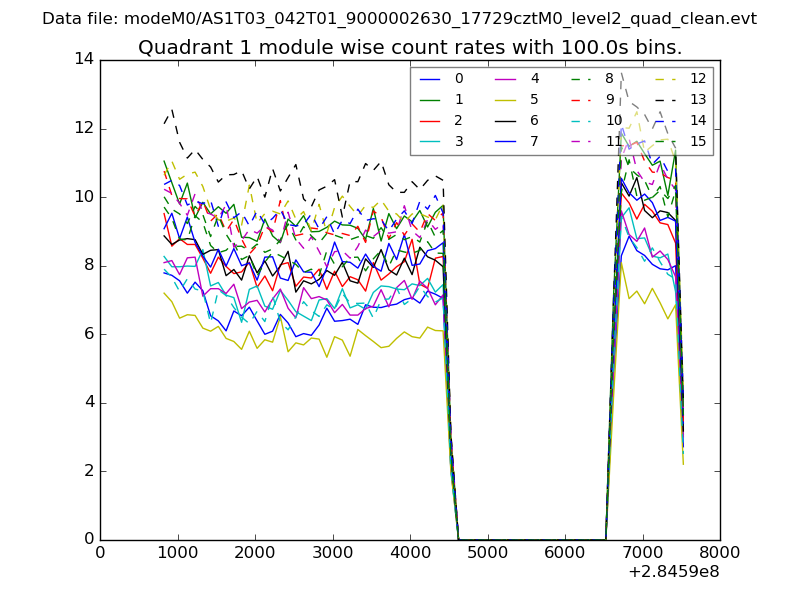
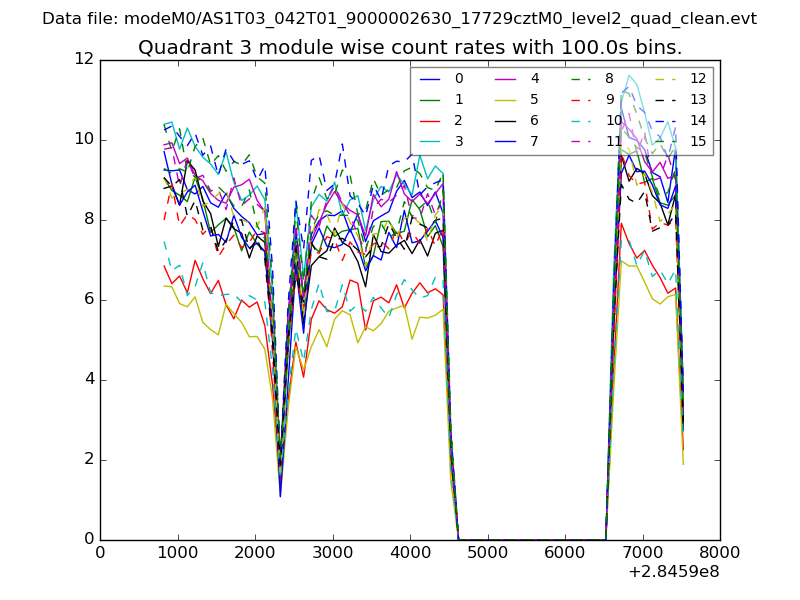
| Module-wise count rates for Quadrant A Data is divided into 100 sec bins |
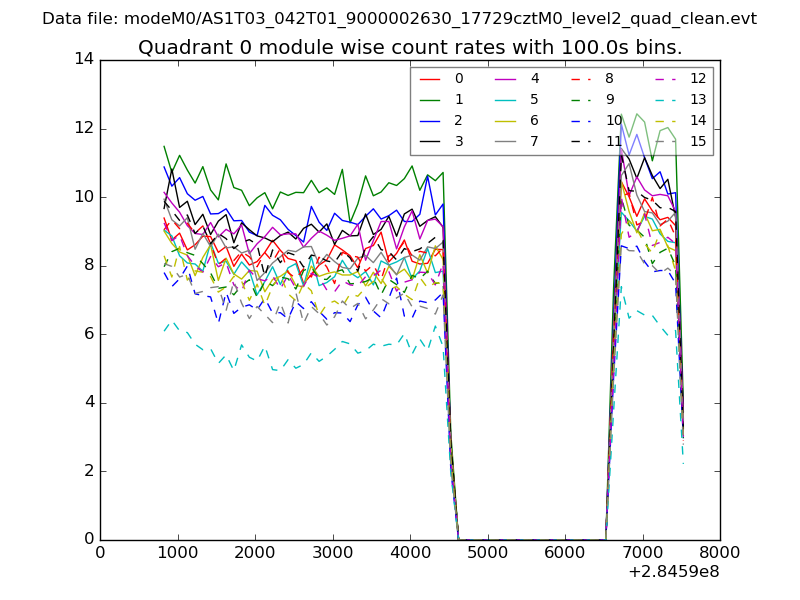 |
 |
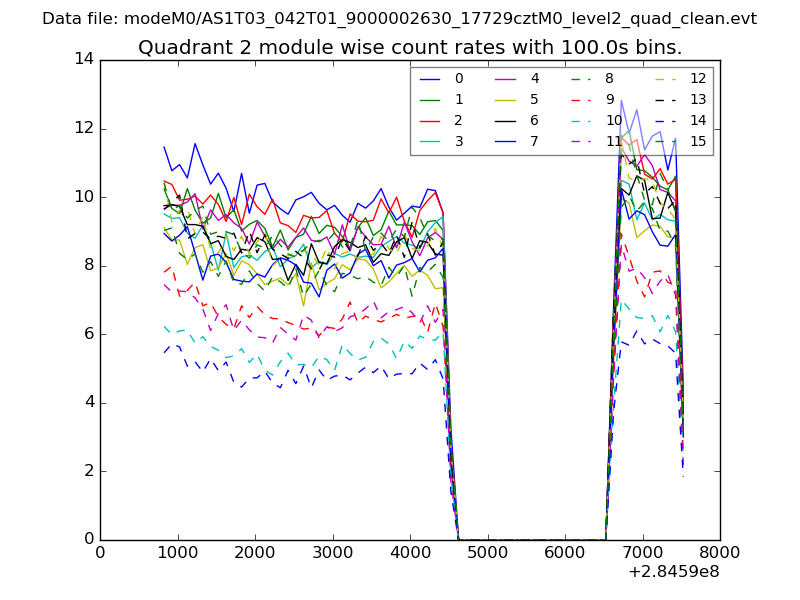
| Module-wise count rates for Quadrant B Data is divided into 100 sec bins |
 |
 |
| Module-wise count rates for Quadrant C Data is divided into 100 sec bins |
 |
 |
| Module-wise count rates for Quadrant D Data is divided into 100 sec bins |
 |
 |
| Parameter | Plot |
|---|---|
| CZT HV Monitor | 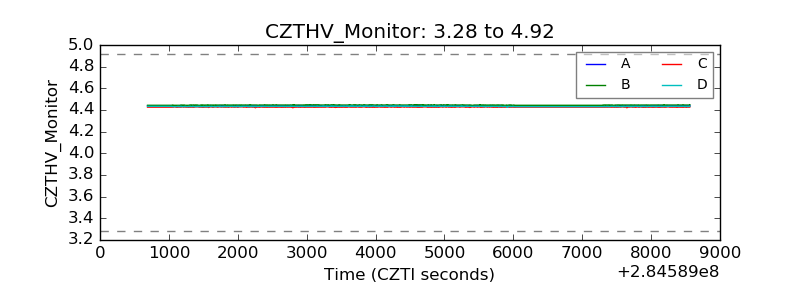 |
| D_VDD | 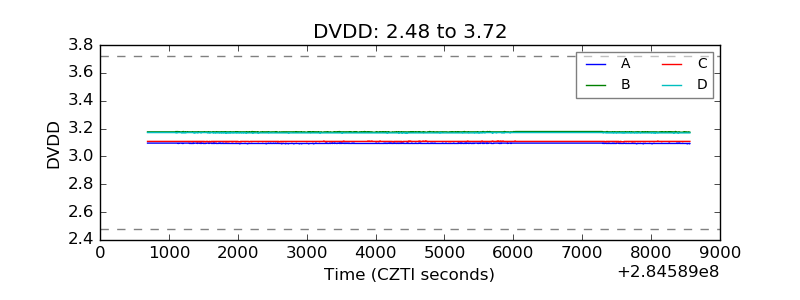 |
| Temperature 1 | 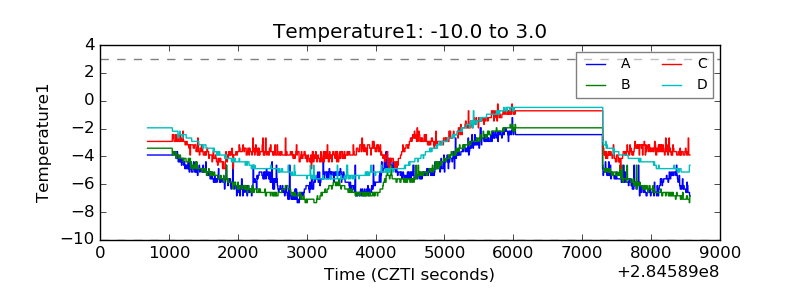 |
| Veto HV Monitor | 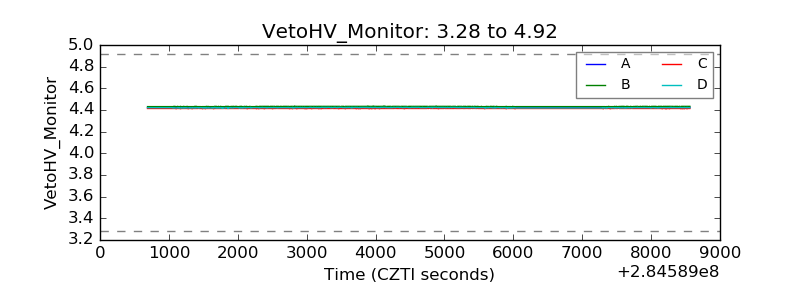 |
| Veto LLD | 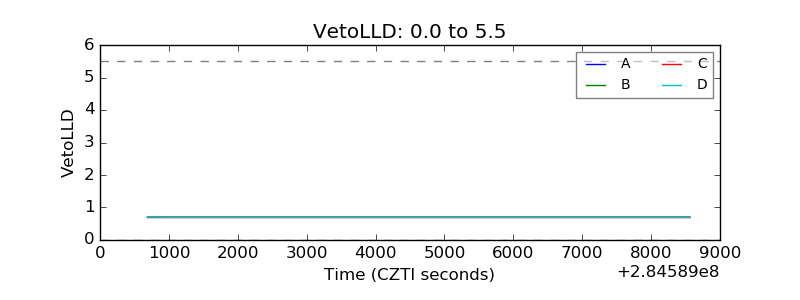 |
| Alpha Counter | 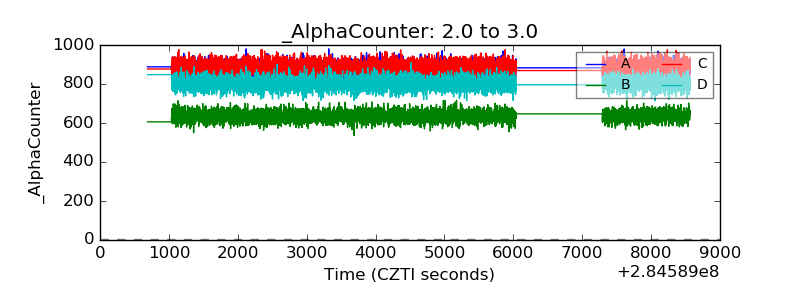 |
| _CPM_Rate | 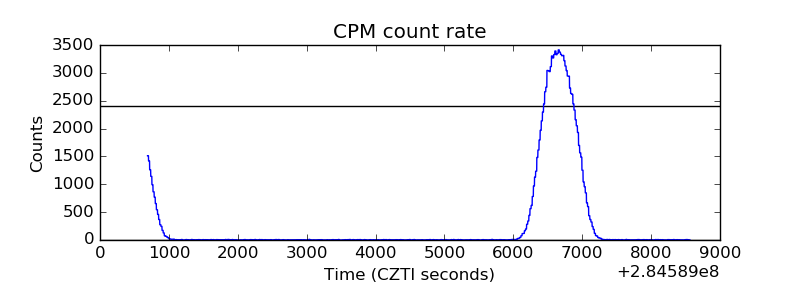 |
| CZT Counter | 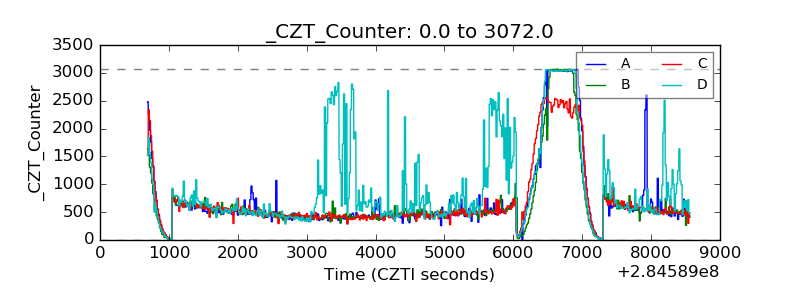 |
| +2.5 Volts monitor |  |
| +5 Volts monitor | 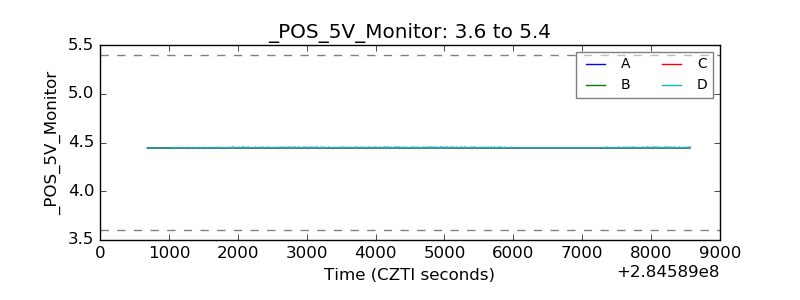 |
| _ROLL_ROT | 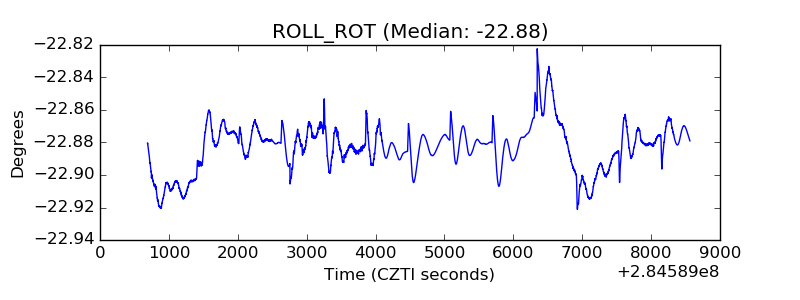 |
| _Roll_DEC | 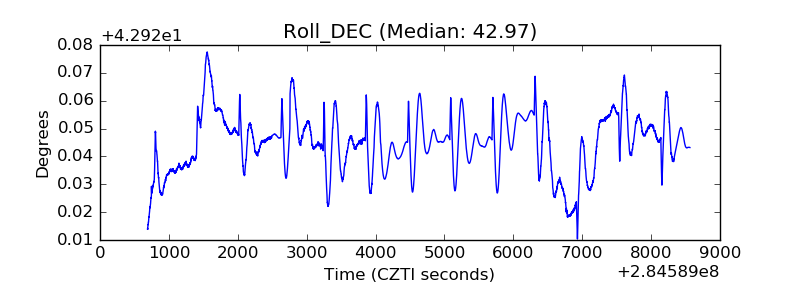 |
| _Roll_RA | 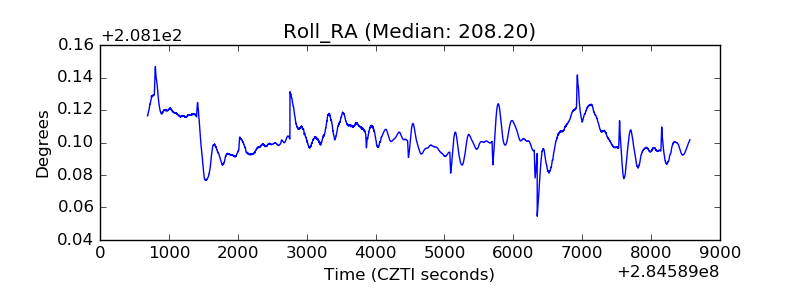 |
| Veto Counter |  |