| Param | Original file | Final file |
|---|---|---|
| Filename | modeM0/AS1T03_042T01_9000002630_17732cztM0_level2.evt | modeM0/AS1T03_042T01_9000002630_17732cztM0_level2_quad_clean.evt |
| Size (bytes) | 465,088,320 | 104,080,320 |
| Size | 443.5 MB | 99.3 MB |
| Events in quadrant A | 3,872,331 | 679,059 |
| Events in quadrant B | 3,192,179 | 705,802 |
| Events in quadrant C | 3,179,693 | 665,744 |
| Events in quadrant D | 3,394,008 | 643,009 |
| Mode M9 | |||
|---|---|---|---|
| Quadrant | BADHDUFLAG | Total packets | Discarded packets |
| A | 0 | 15 | 0 |
| B | 0 | 16 | 0 |
| C | 0 | 16 | 0 |
| D | 0 | 16 | 0 |
| Mode M0 | |||
|---|---|---|---|
| Quadrant | BADHDUFLAG | Total packets | Discarded packets |
| A | 0 | 15889 | 2 |
| B | 0 | 13686 | 2 |
| C | 0 | 13695 | 2 |
| D | 0 | 14857 | 2 |
| Mode SS | |||
|---|---|---|---|
| Quadrant | BADHDUFLAG | Total packets | Discarded packets |
| A | 0 | 134 | 0 |
| B | 0 | 134 | 0 |
| C | 0 | 134 | 0 |
| D | 0 | 134 | 0 |
| Quadrant | Total seconds | Saturated seconds | Saturation percentage |
|---|---|---|---|
| A | 6574 | 407 | 6.191056% |
| B | 6574 | 50 | 0.760572% |
| C | 6574 | 65 | 0.988744% |
| D | 6574 | 75 | 1.140858% |
Noise dominated data is calculated using 1-second bins in cleaned event files. If a bin has >2000 counts, and if more than 50% of those come from <1% of pixels, then it is considered to be noise-dominated and hence unusable.
| Quadrant | # 1 sec bins | Bins with >0 counts | Bins with >2000 counts | High rate bins dominated by noise | Noise dominated (total time) | Noise dominated (detector-on time) | Marked lightcurve |
|---|---|---|---|---|---|---|---|
| A | 7884 | 6575 | 250 | 250 | 3.17% | 3.80% | 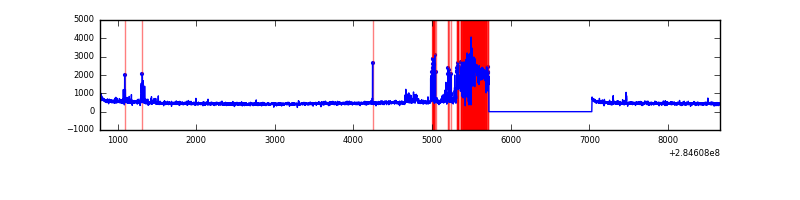 |
| B | 7884 | 6575 | 1 | 1 | 0.01% | 0.02% | 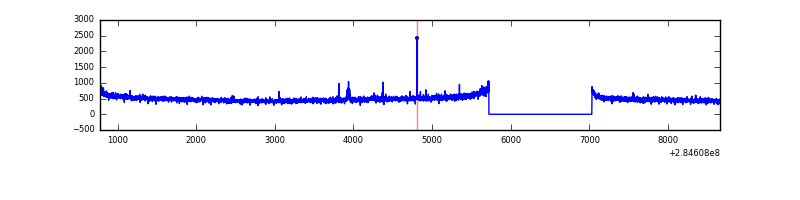 |
| C | 7884 | 6575 | 0 | 0 | 0.00% | 0.00% | 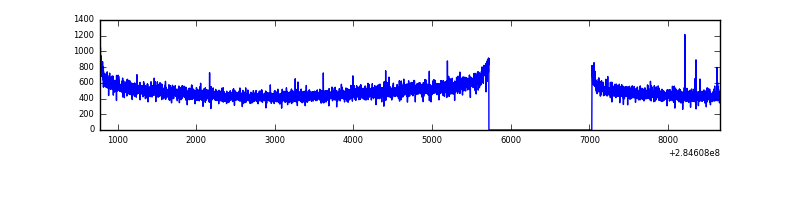 |
| D | 7884 | 6575 | 51 | 51 | 0.65% | 0.78% | 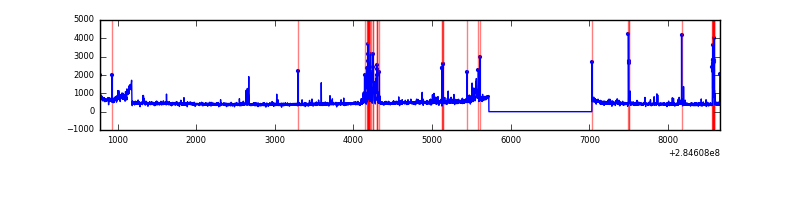 |
Top three noisy pixels from each quadrant. If the there are fewer than three noisy pixels in the level2.evt file, extra rows are filled as -1
| Pixel properties | Quadrant properties | ||||||
|---|---|---|---|---|---|---|---|
| Quadrant | DetID | PixID | Counts | Sigma | Mean | Median | Sigma |
| A | 15 | 174 | 880309 | 5670.64 | 773 | 758 | 155.1 |
| A | 15 | 31 | 16760 | 103.17 | 773 | 758 | 155.1 |
| A | 0 | 226 | 6666 | 38.09 | 773 | 758 | 155.1 |
| B | 0 | 219 | 20883 | 132.67 | 811 | 793 | 151.4 |
| B | 12 | 111 | 18150 | 114.62 | 811 | 793 | 151.4 |
| B | 11 | 111 | 15566 | 97.56 | 811 | 793 | 151.4 |
| C | 14 | 238 | 122738 | 681.62 | 773 | 778 | 178.9 |
| C | 3 | 233 | 24194 | 130.87 | 773 | 778 | 178.9 |
| C | 5 | 218 | 14075 | 74.32 | 773 | 778 | 178.9 |
| D | 7 | 238 | 205480 | 1007.83 | 763 | 748 | 203.1 |
| D | 12 | 227 | 157665 | 772.45 | 763 | 748 | 203.1 |
| D | 13 | 232 | 54633 | 265.26 | 763 | 748 | 203.1 |
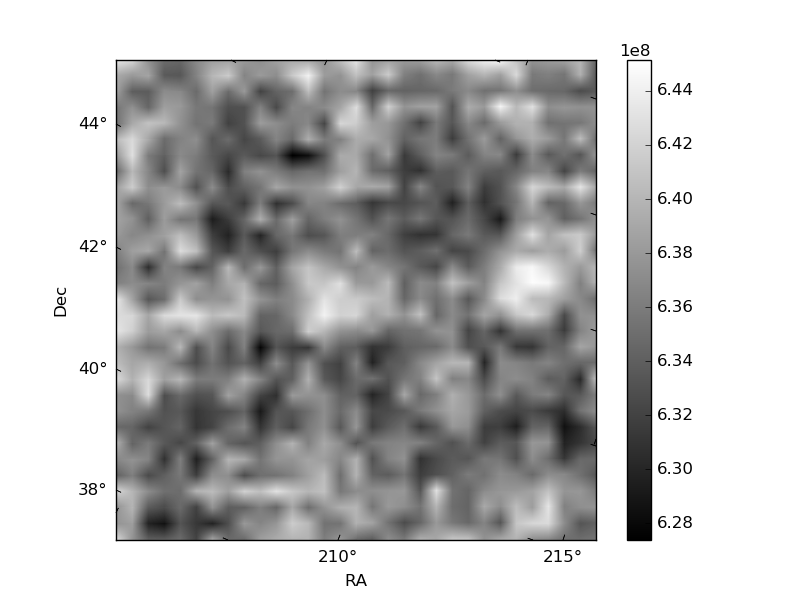
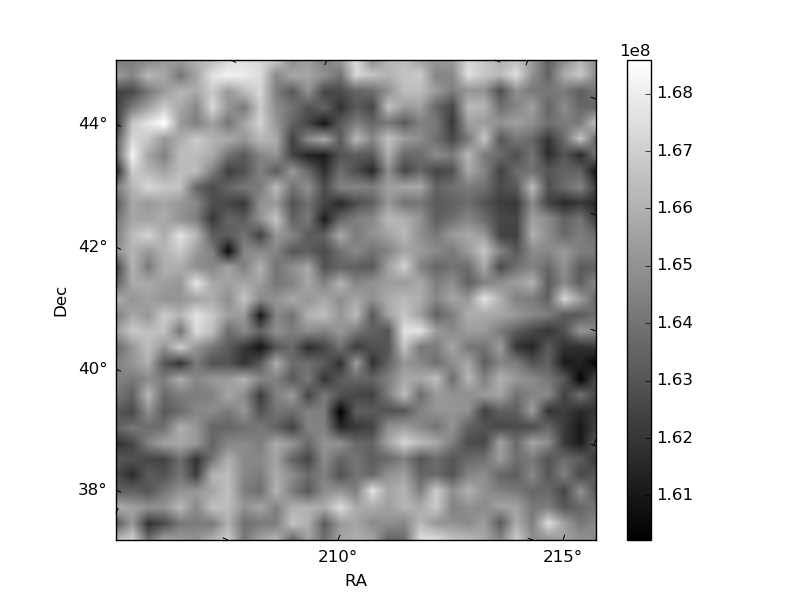
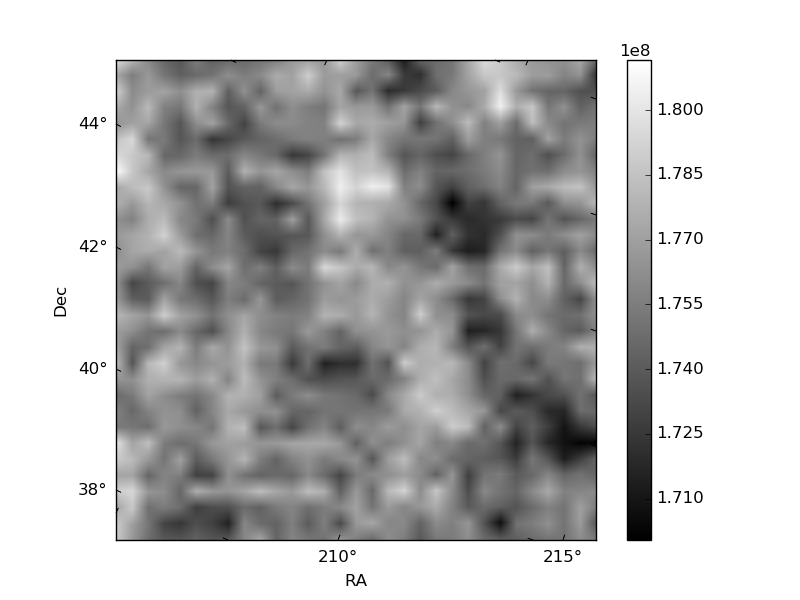
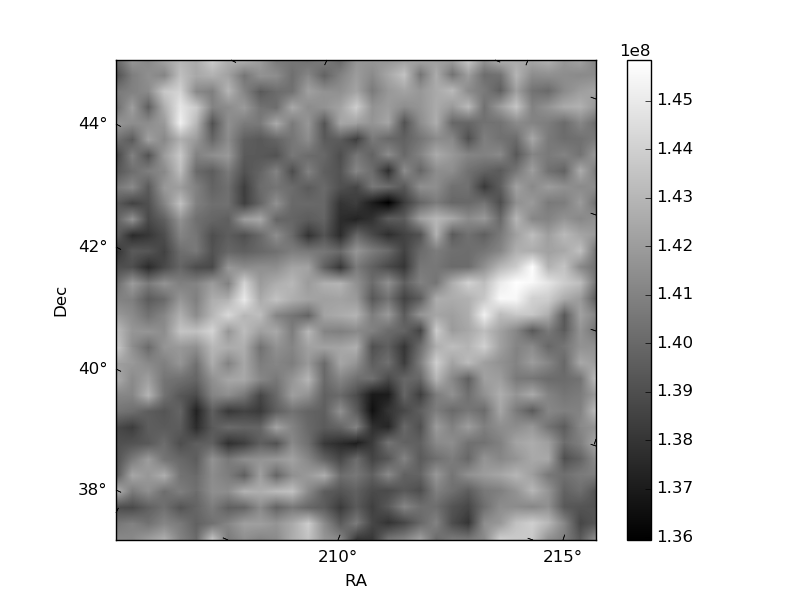
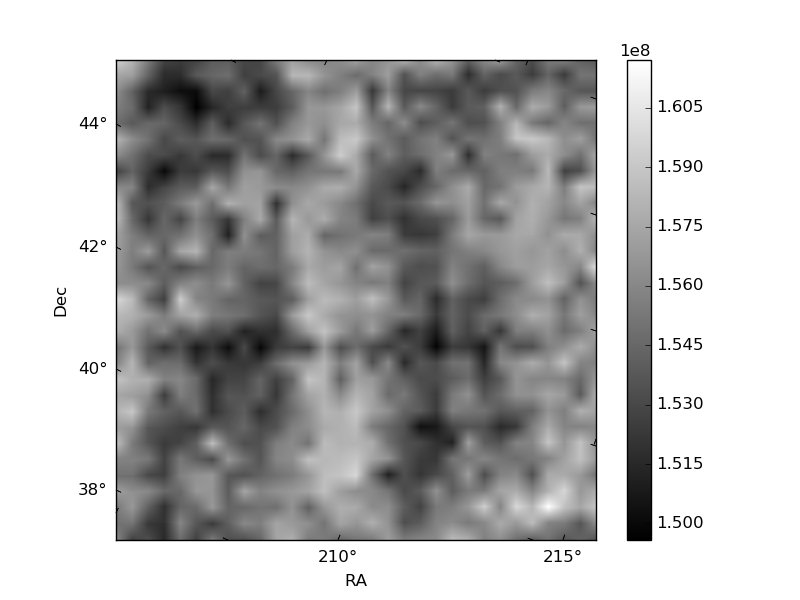
Histogram calculated using DETX and DETY for each event in the final _common_clean file
| Quadrant A | 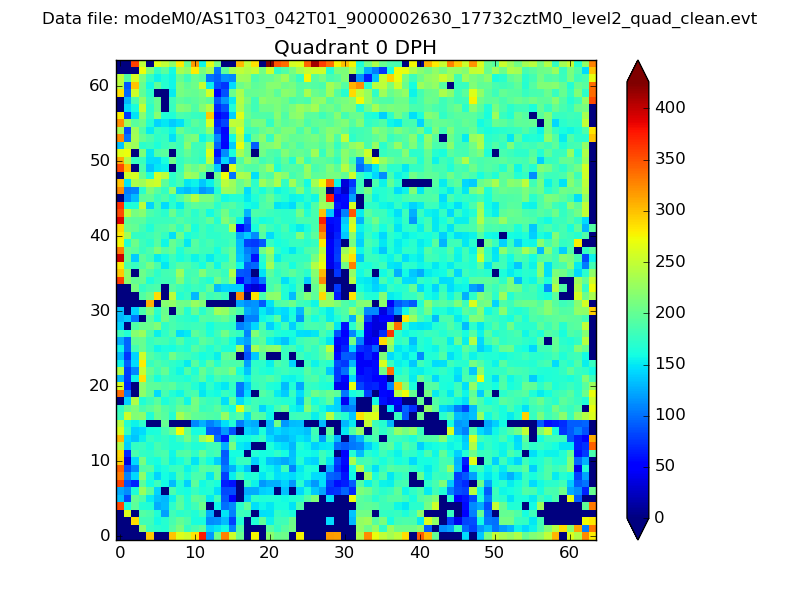 |
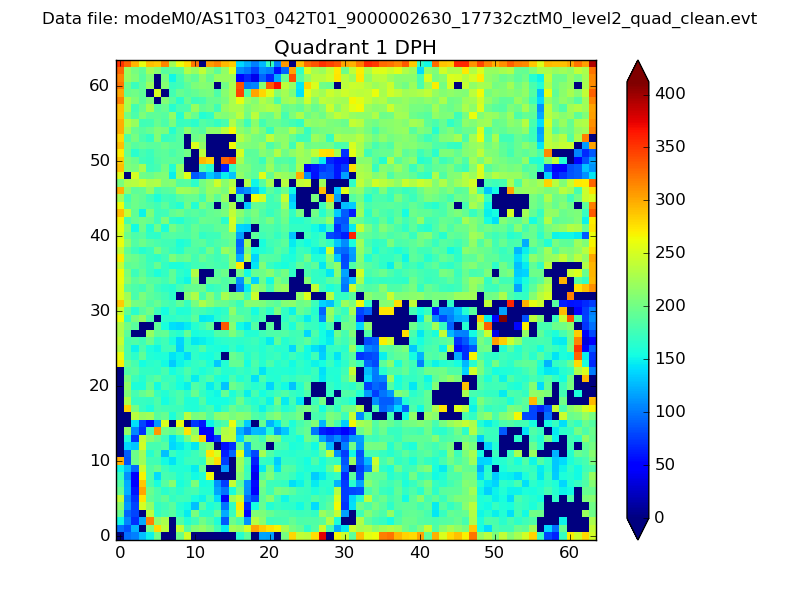 |
Quadrant B |
|---|---|---|---|
| Quadrant D | 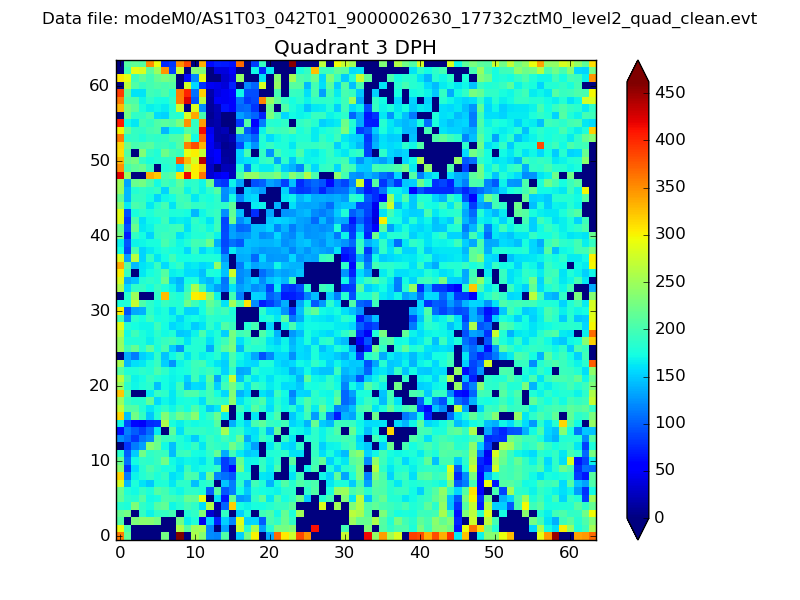 |
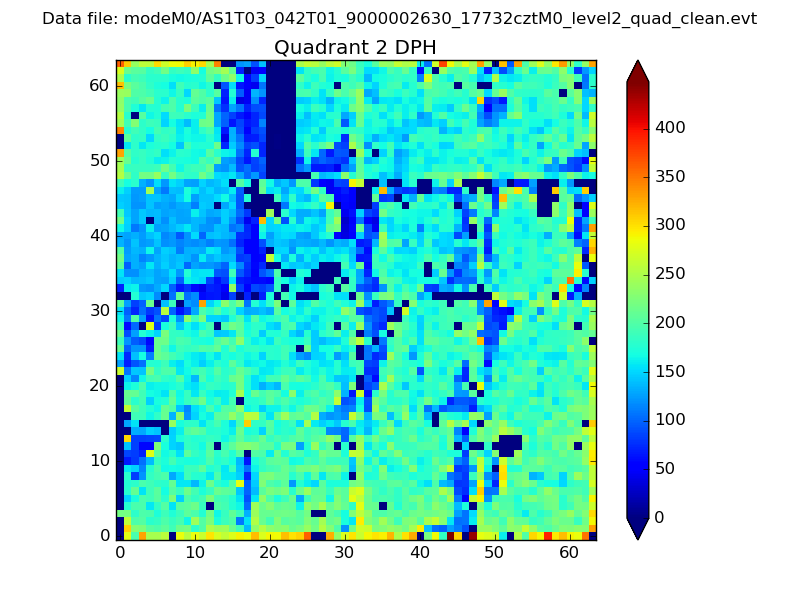 |
Quadrant C |
| Plot type | Count rate plots | Images |
|---|---|---|
| Comparison with Poisson distribution Blue bars denote a histogram of data divided into 1 sec bins. Red curve is a Poisson curve with rate = median count rate of data. |
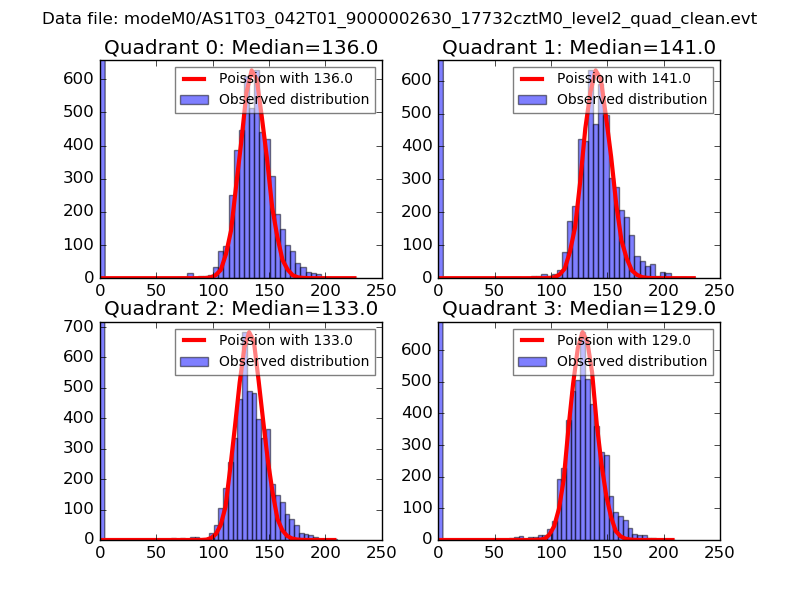 |
 |
| Quadrant-wise count rates Data is divided into 100 sec bins |
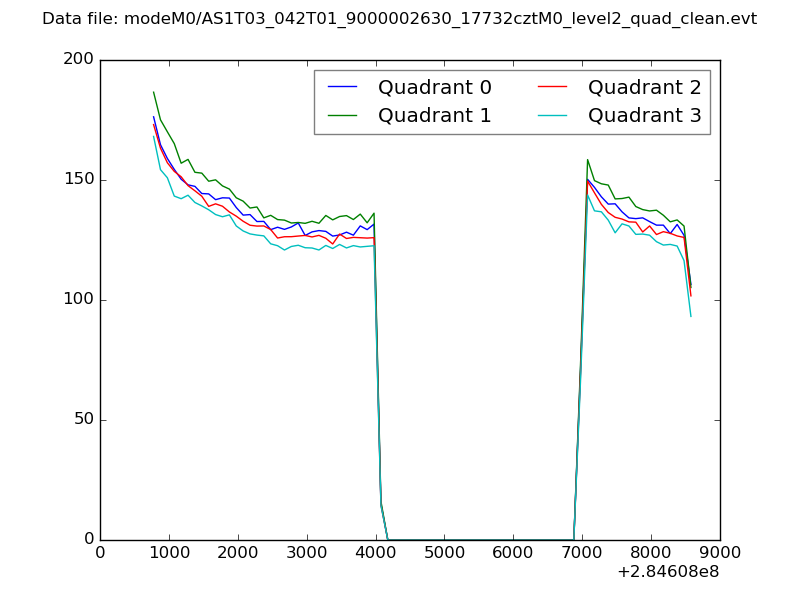 |
|
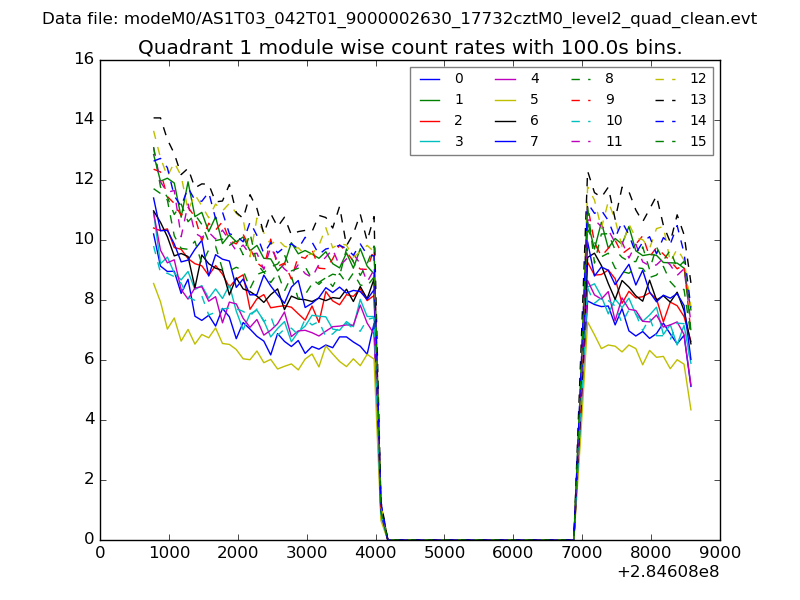
| Module-wise count rates for Quadrant A Data is divided into 100 sec bins |
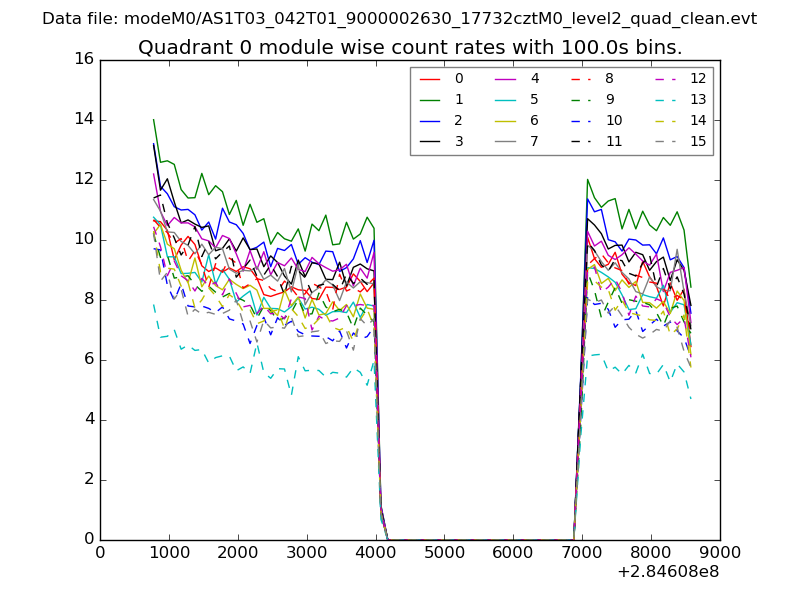 |
 |
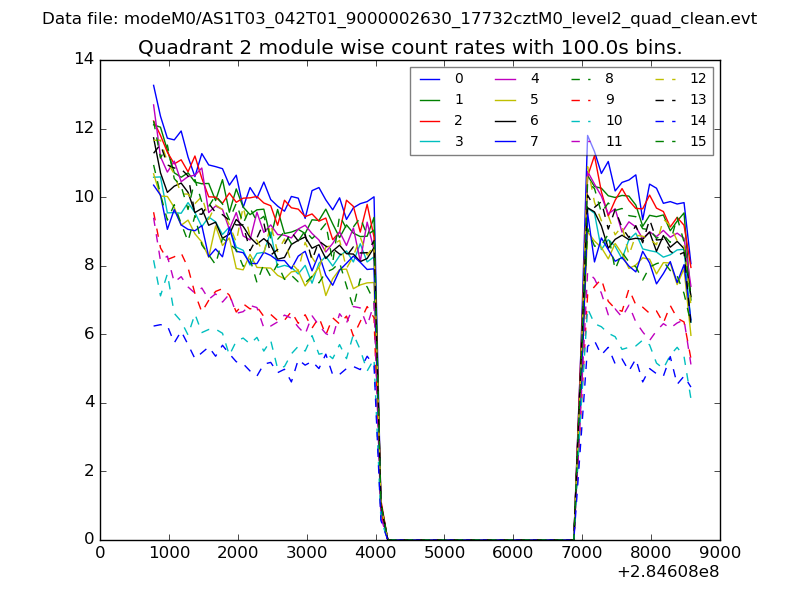
| Module-wise count rates for Quadrant B Data is divided into 100 sec bins |
 |
 |
| Module-wise count rates for Quadrant C Data is divided into 100 sec bins |
 |
 |
| Module-wise count rates for Quadrant D Data is divided into 100 sec bins |
 |
 |
| Parameter | Plot |
|---|---|
| CZT HV Monitor |  |
| D_VDD | 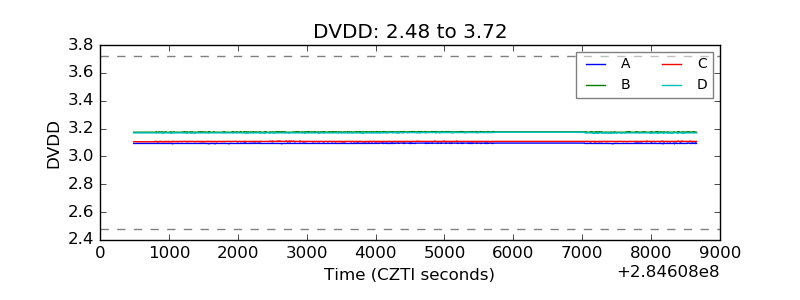 |
| Temperature 1 | 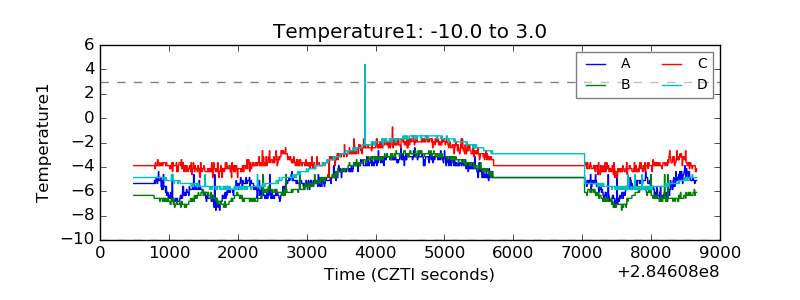 |
| Veto HV Monitor | 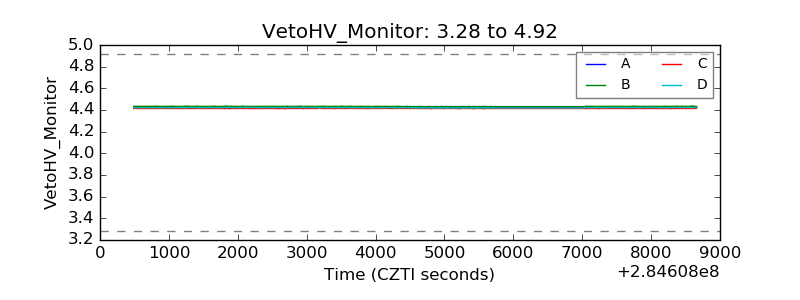 |
| Veto LLD | 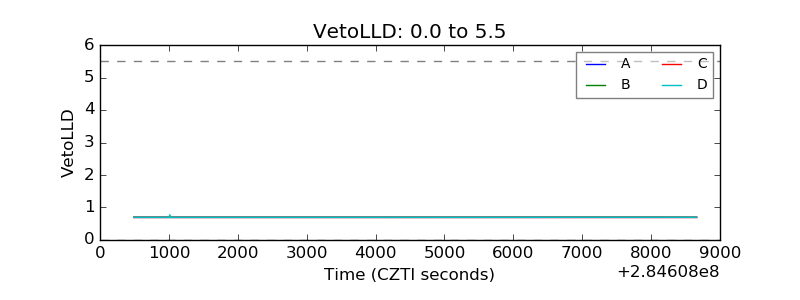 |
| Alpha Counter | 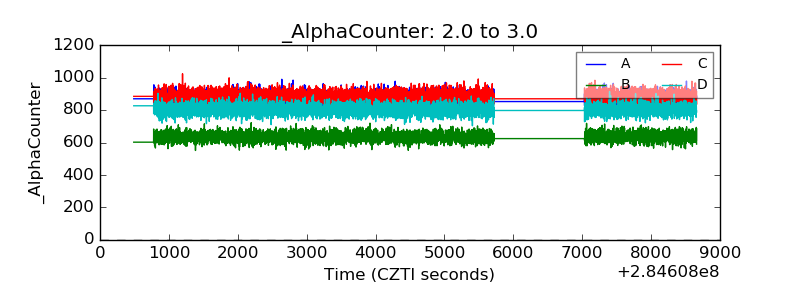 |
| _CPM_Rate | 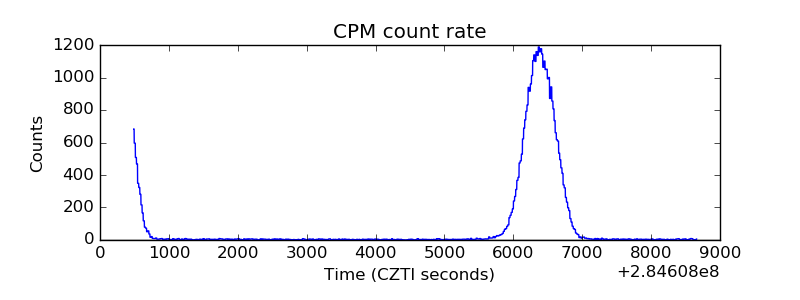 |
| CZT Counter | 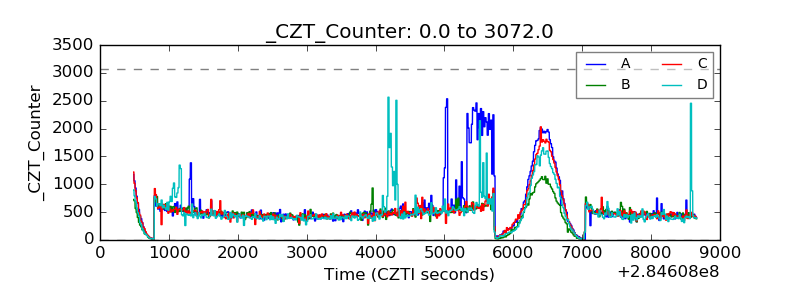 |
| +2.5 Volts monitor |  |
| +5 Volts monitor |  |
| _ROLL_ROT | 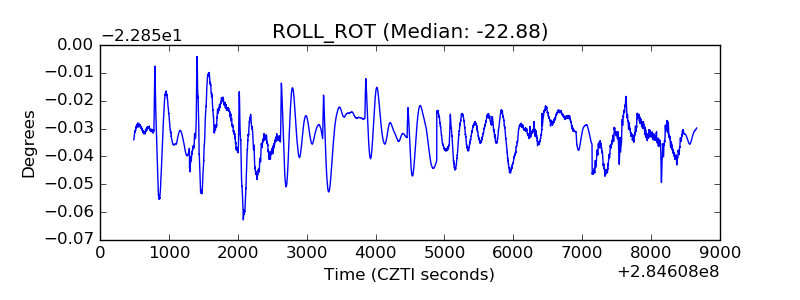 |
| _Roll_DEC | 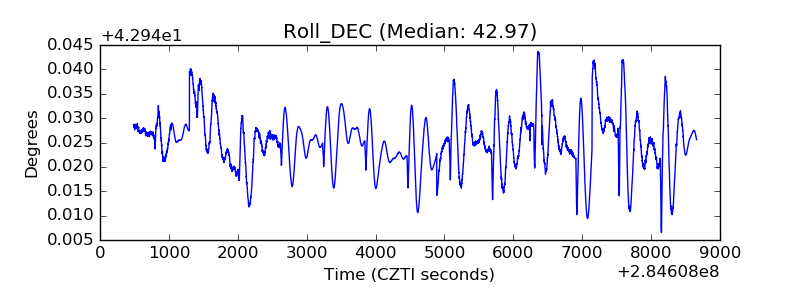 |
| _Roll_RA | 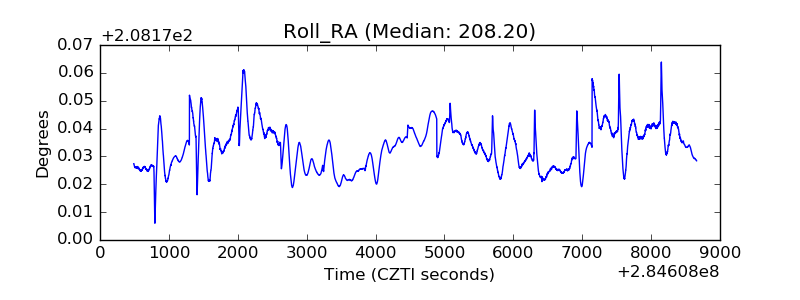 |
| Veto Counter | 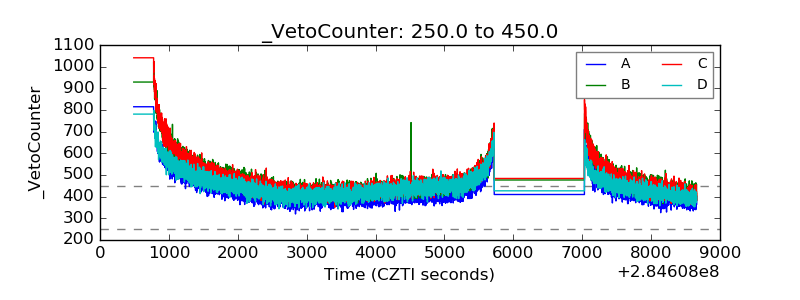 |