| Param | Original file | Final file |
|---|---|---|
| Filename | modeM0/AS1T03_042T01_9000002630_17734cztM0_level2.evt | modeM0/AS1T03_042T01_9000002630_17734cztM0_level2_quad_clean.evt |
| Size (bytes) | 452,756,160 | 97,413,120 |
| Size | 431.8 MB | 92.9 MB |
| Events in quadrant A | 3,308,871 | 618,559 |
| Events in quadrant B | 3,310,660 | 635,474 |
| Events in quadrant C | 3,316,215 | 606,775 |
| Events in quadrant D | 3,296,226 | 597,957 |
| Mode M9 | |||
|---|---|---|---|
| Quadrant | BADHDUFLAG | Total packets | Discarded packets |
| A | 0 | 6 | 0 |
| B | 0 | 6 | 0 |
| C | 0 | 6 | 0 |
| D | 0 | 6 | 0 |
| Mode M0 | |||
|---|---|---|---|
| Quadrant | BADHDUFLAG | Total packets | Discarded packets |
| A | 0 | 14683 | 1 |
| B | 0 | 14542 | 1 |
| C | 0 | 14535 | 1 |
| D | 0 | 14839 | 1 |
| Mode SS | |||
|---|---|---|---|
| Quadrant | BADHDUFLAG | Total packets | Discarded packets |
| A | 0 | 142 | 0 |
| B | 0 | 142 | 0 |
| C | 0 | 142 | 0 |
| D | 0 | 142 | 0 |
| Quadrant | Total seconds | Saturated seconds | Saturation percentage |
|---|---|---|---|
| A | 7059 | 93 | 1.317467% |
| B | 7060 | 99 | 1.402266% |
| C | 7060 | 92 | 1.303116% |
| D | 7060 | 51 | 0.722380% |
Noise dominated data is calculated using 1-second bins in cleaned event files. If a bin has >2000 counts, and if more than 50% of those come from <1% of pixels, then it is considered to be noise-dominated and hence unusable.
| Quadrant | # 1 sec bins | Bins with >0 counts | Bins with >2000 counts | High rate bins dominated by noise | Noise dominated (total time) | Noise dominated (detector-on time) | Marked lightcurve |
|---|---|---|---|---|---|---|---|
| A | 7664 | 7060 | 7 | 7 | 0.09% | 0.10% | 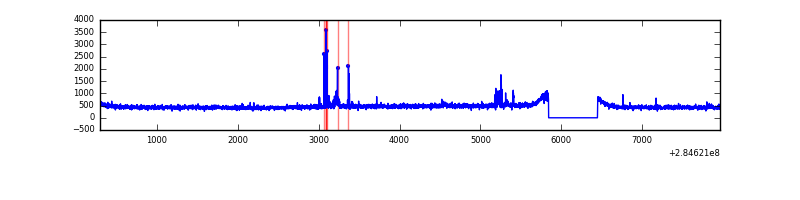 |
| B | 7665 | 7060 | 1 | 1 | 0.01% | 0.01% | 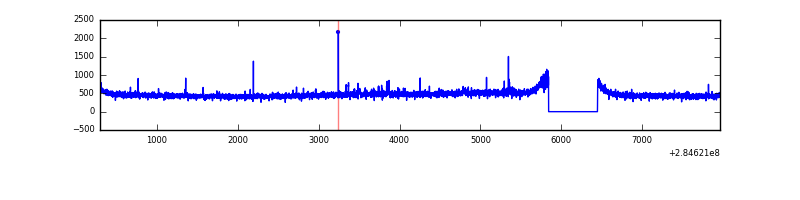 |
| C | 7665 | 7060 | 1 | 1 | 0.01% | 0.01% | 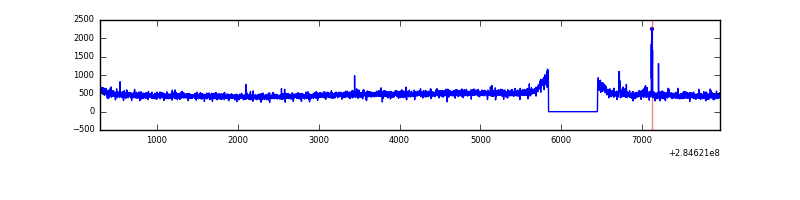 |
| D | 7665 | 7061 | 9 | 9 | 0.12% | 0.13% | 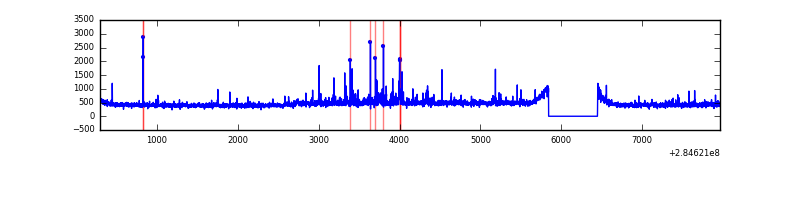 |
Top three noisy pixels from each quadrant. If the there are fewer than three noisy pixels in the level2.evt file, extra rows are filled as -1
| Pixel properties | Quadrant properties | ||||||
|---|---|---|---|---|---|---|---|
| Quadrant | DetID | PixID | Counts | Sigma | Mean | Median | Sigma |
| A | 15 | 174 | 80266 | 465.59 | 836 | 817 | 170.6 |
| A | 4 | 2 | 14839 | 82.17 | 836 | 817 | 170.6 |
| A | 0 | 226 | 7199 | 37.4 | 836 | 817 | 170.6 |
| B | 10 | 245 | 25370 | 150.9 | 837 | 817 | 162.7 |
| B | 12 | 111 | 19343 | 113.86 | 837 | 817 | 162.7 |
| B | 11 | 111 | 17091 | 100.02 | 837 | 817 | 162.7 |
| C | 14 | 238 | 124025 | 658.8 | 797 | 804 | 187.0 |
| C | 0 | 207 | 33677 | 175.75 | 797 | 804 | 187.0 |
| C | 1 | 16 | 19856 | 101.86 | 797 | 804 | 187.0 |
| D | 1 | 52 | 146805 | 700.72 | 805 | 782 | 208.4 |
| D | 7 | 238 | 34987 | 164.14 | 805 | 782 | 208.4 |
| D | 2 | 234 | 26027 | 121.14 | 805 | 782 | 208.4 |
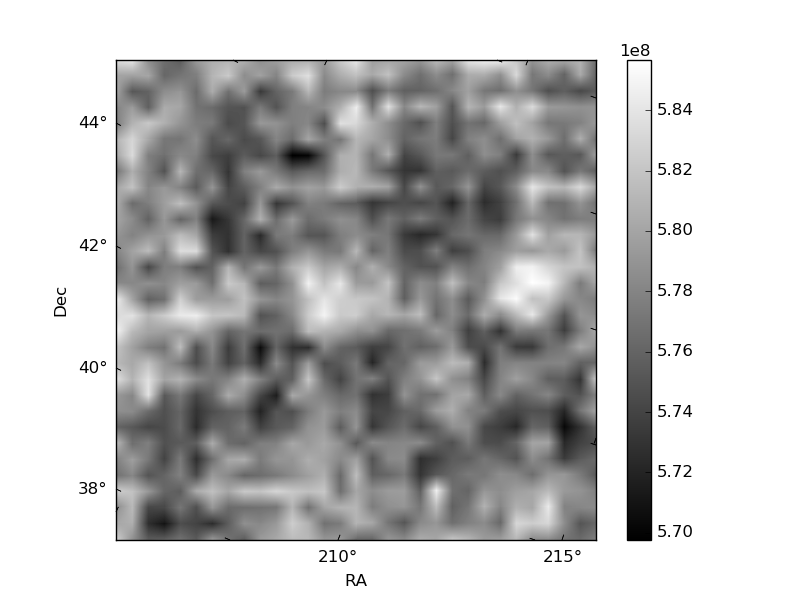
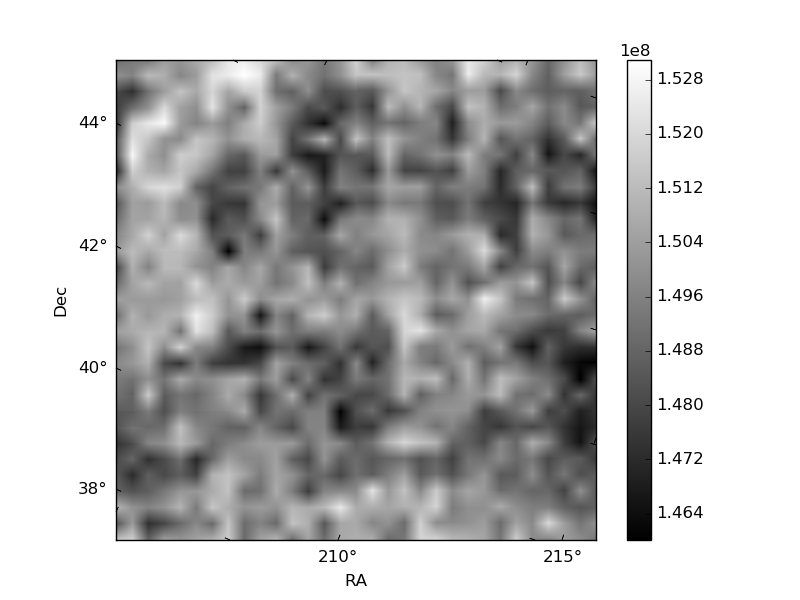
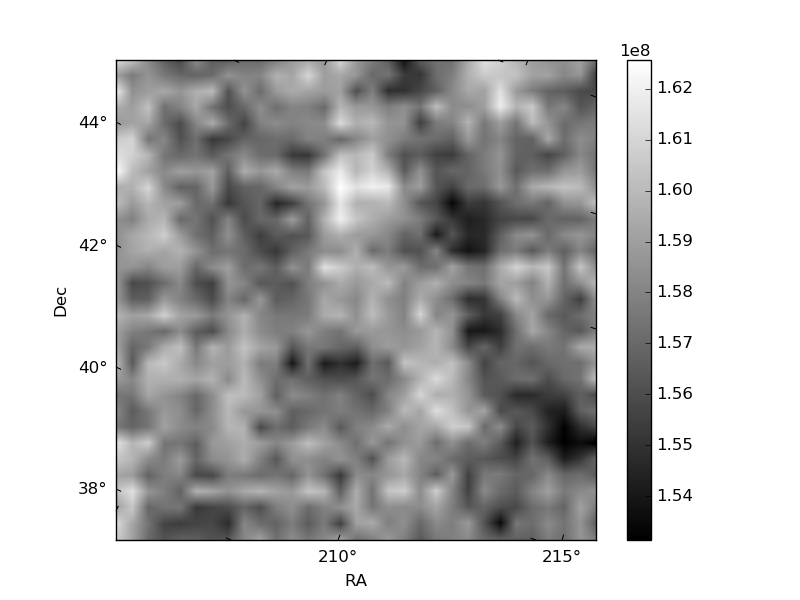
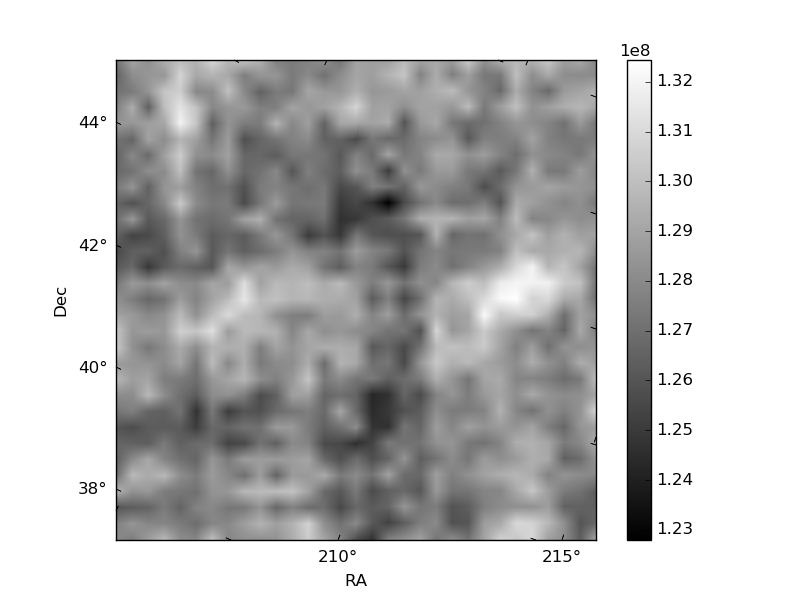
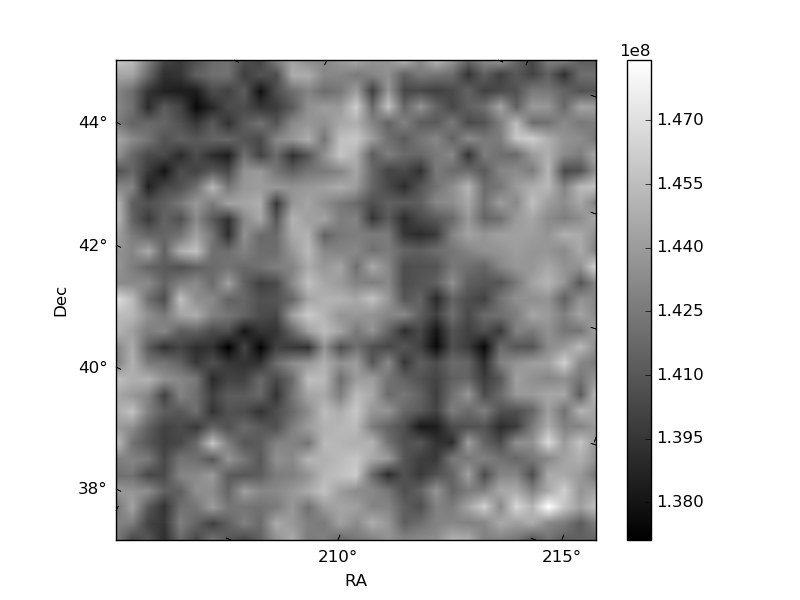
Histogram calculated using DETX and DETY for each event in the final _common_clean file
| Quadrant A | 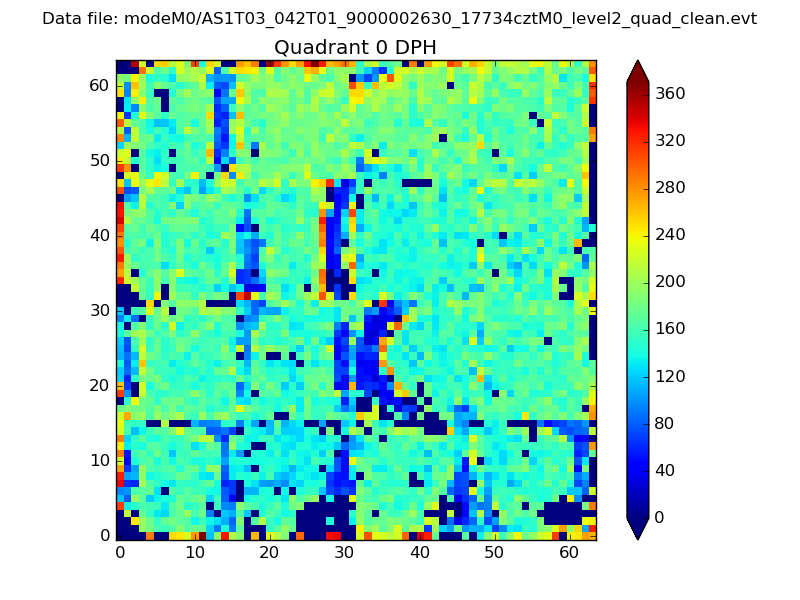 |
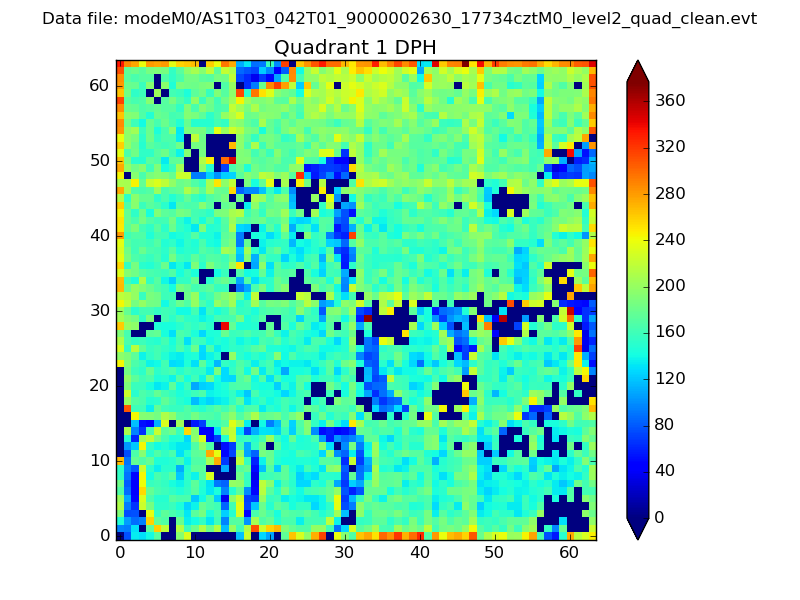 |
Quadrant B |
|---|---|---|---|
| Quadrant D |  |
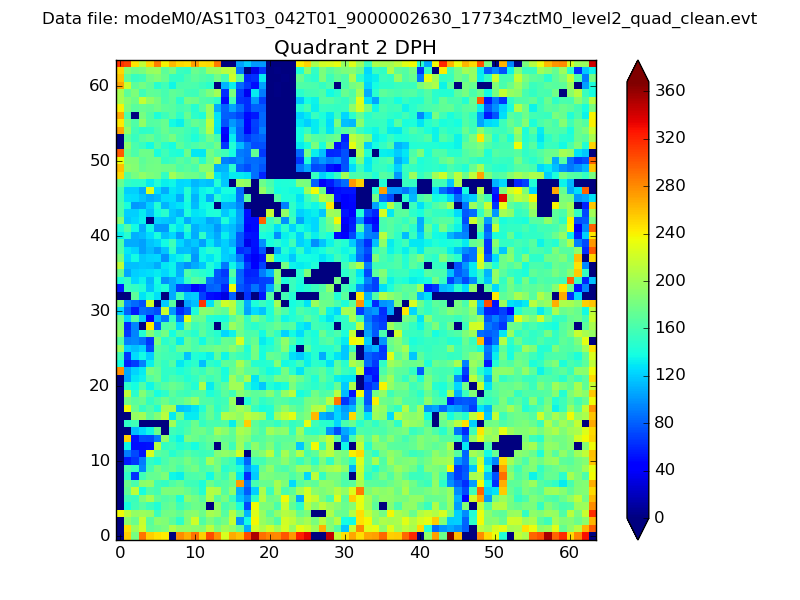 |
Quadrant C |
| Plot type | Count rate plots | Images |
|---|---|---|
| Comparison with Poisson distribution Blue bars denote a histogram of data divided into 1 sec bins. Red curve is a Poisson curve with rate = median count rate of data. |
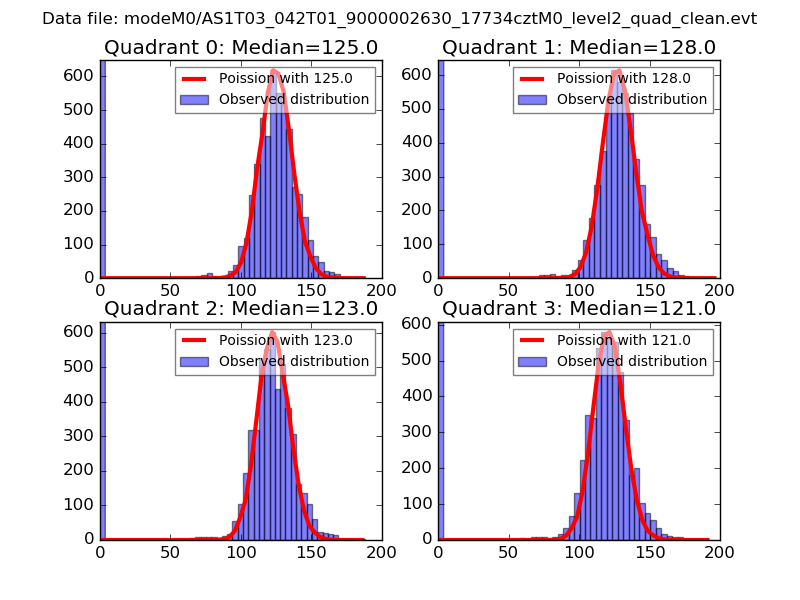 |
 |
| Quadrant-wise count rates Data is divided into 100 sec bins |
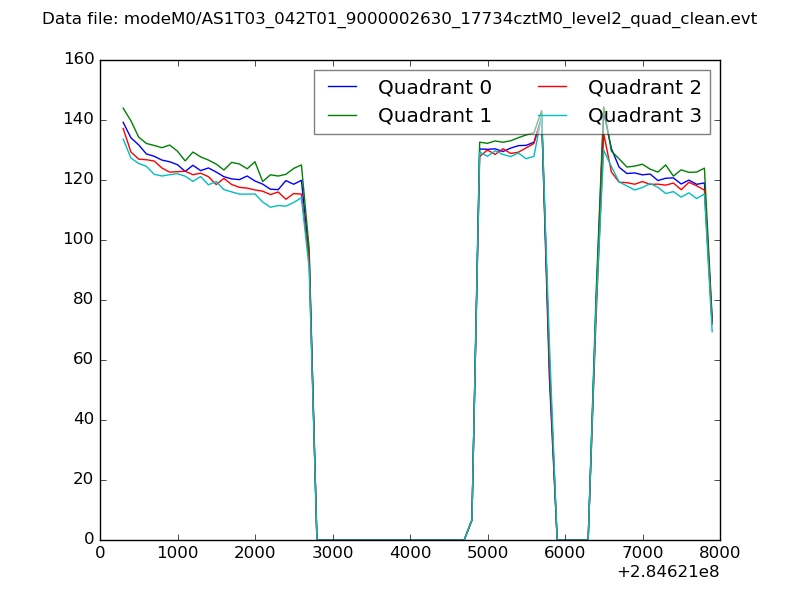 |
|
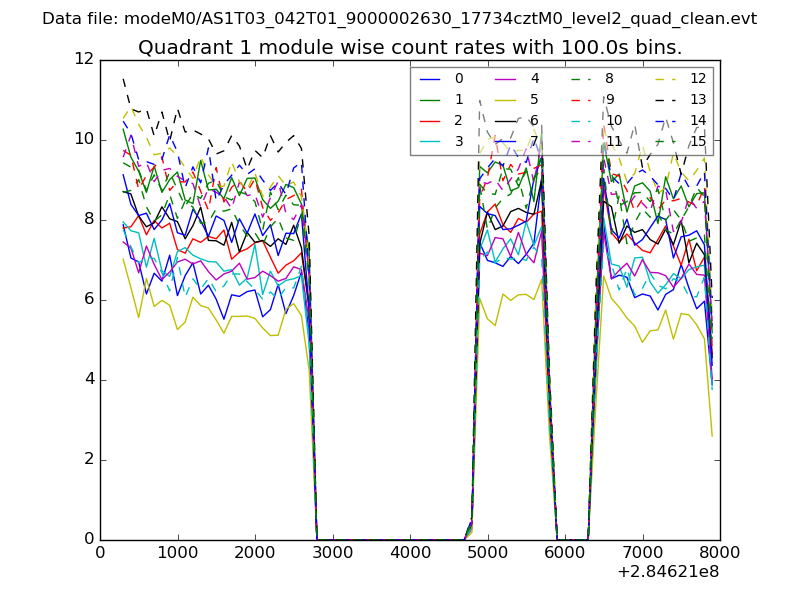
| Module-wise count rates for Quadrant A Data is divided into 100 sec bins |
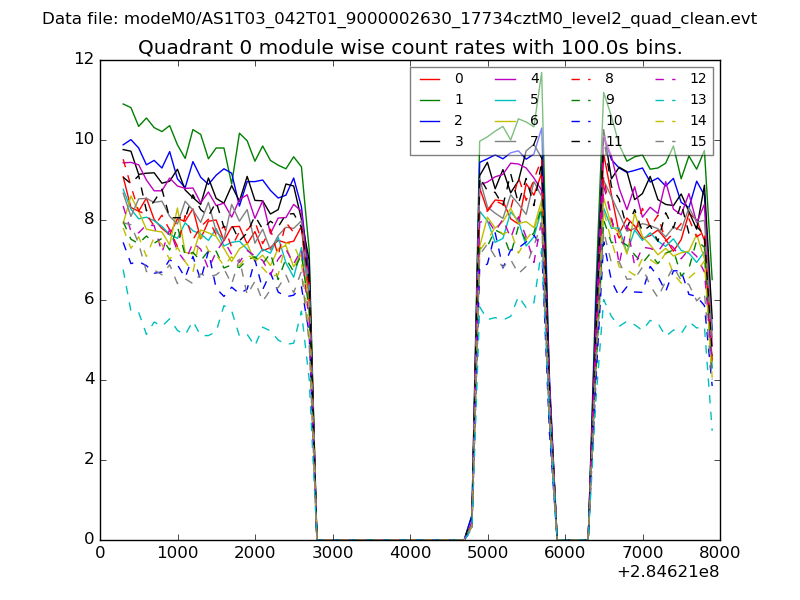 |
 |
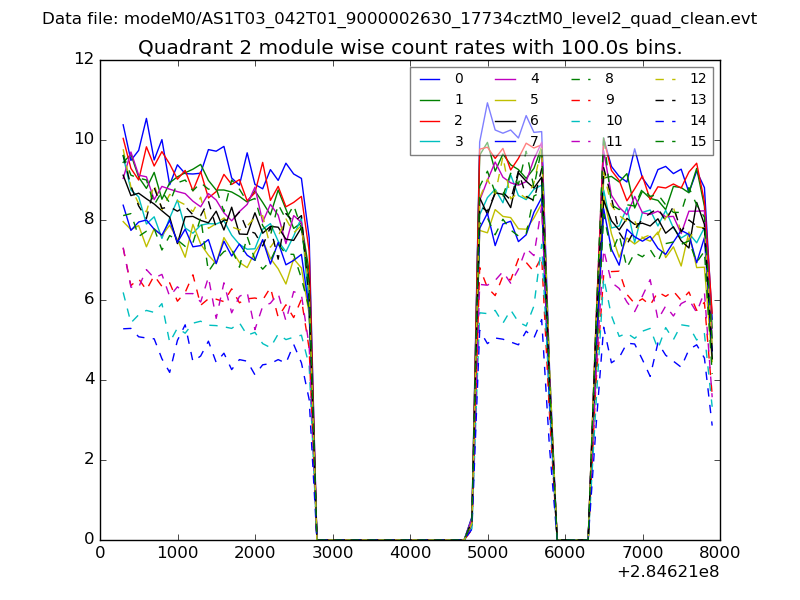
| Module-wise count rates for Quadrant B Data is divided into 100 sec bins |
 |
 |
| Module-wise count rates for Quadrant C Data is divided into 100 sec bins |
 |
 |
| Module-wise count rates for Quadrant D Data is divided into 100 sec bins |
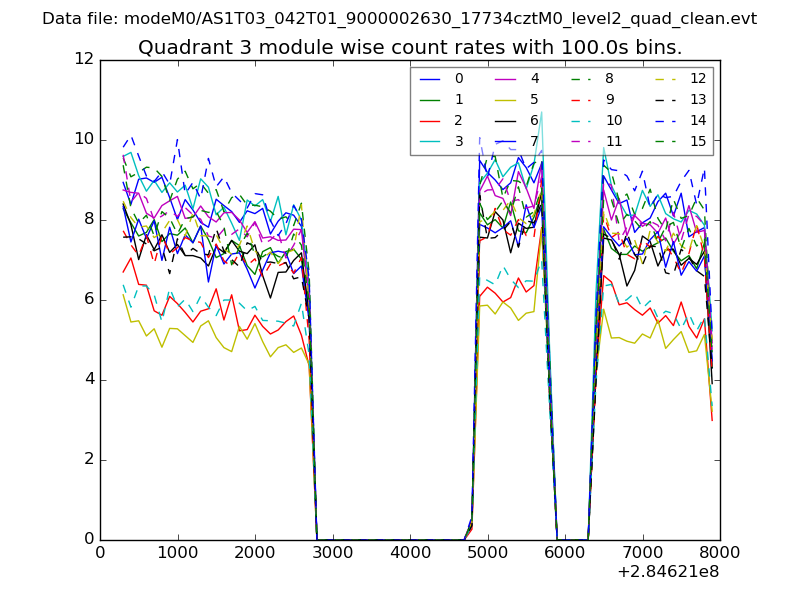 |
 |
| Parameter | Plot |
|---|---|
| CZT HV Monitor | 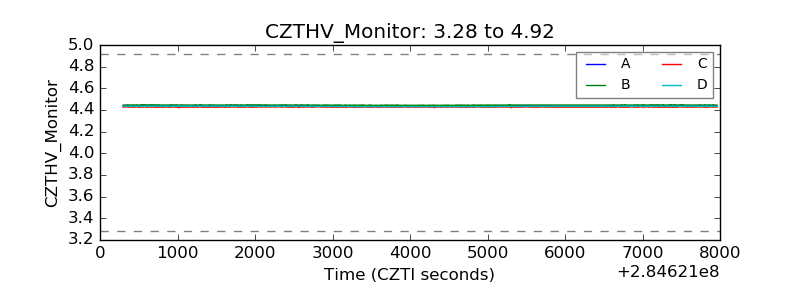 |
| D_VDD | 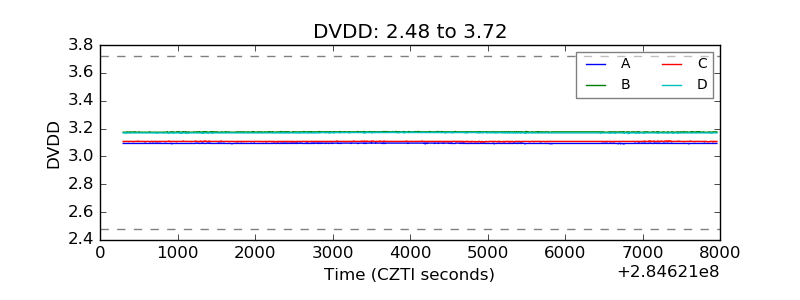 |
| Temperature 1 | 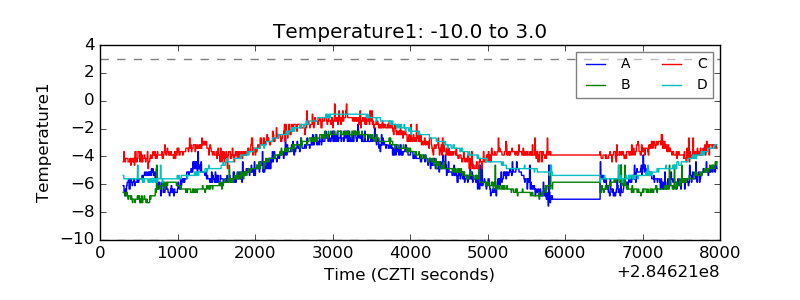 |
| Veto HV Monitor | 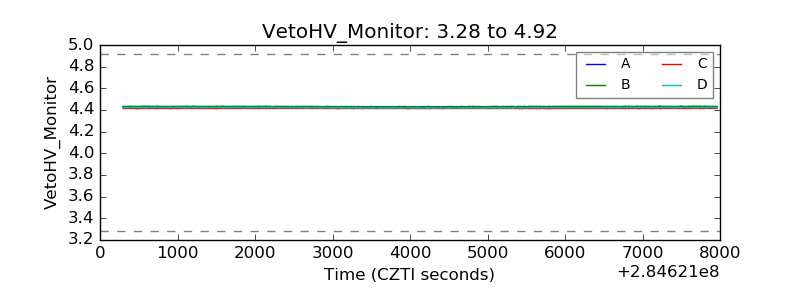 |
| Veto LLD |  |
| Alpha Counter | 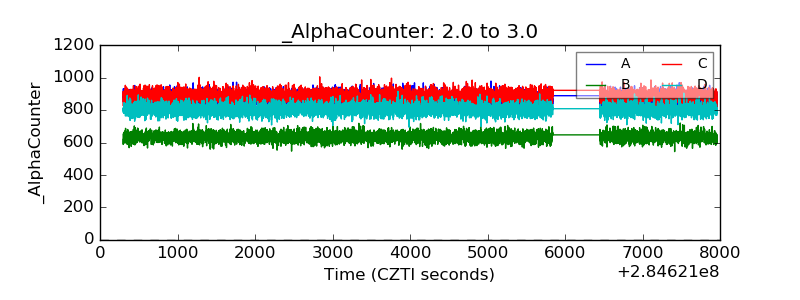 |
| _CPM_Rate | 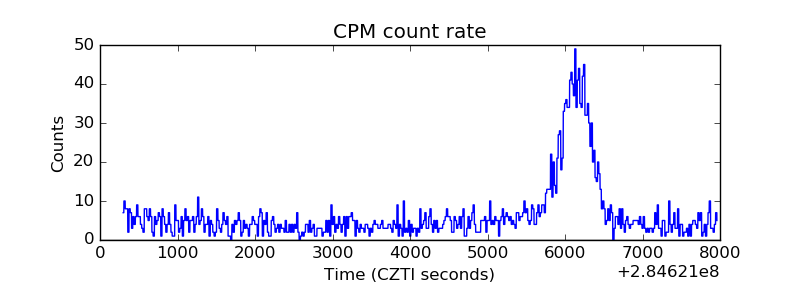 |
| CZT Counter | 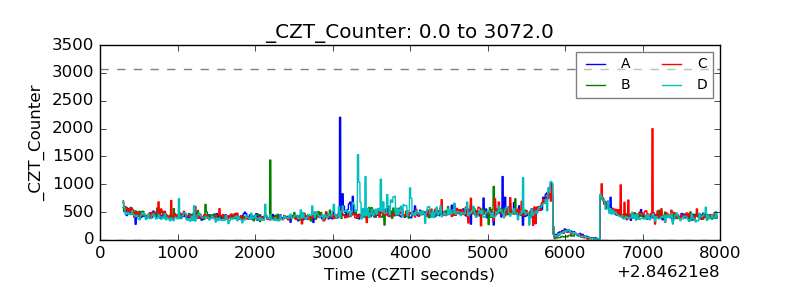 |
| +2.5 Volts monitor |  |
| +5 Volts monitor | 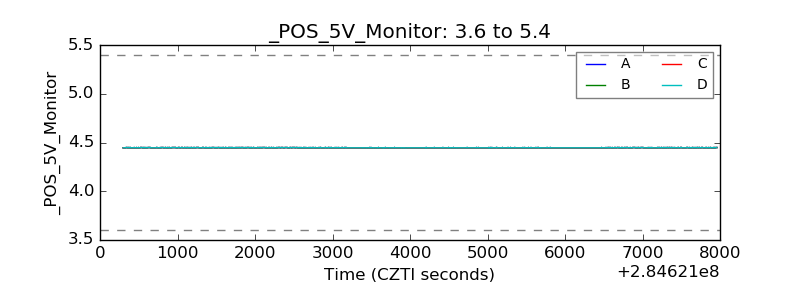 |
| _ROLL_ROT |  |
| _Roll_DEC | 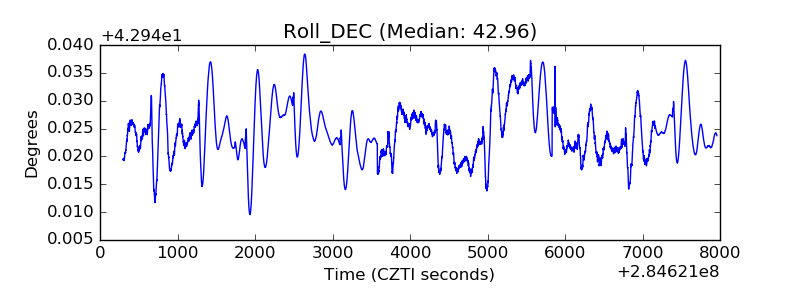 |
| _Roll_RA | 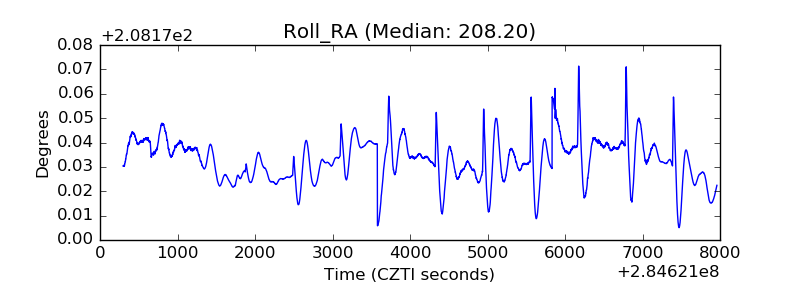 |
| Veto Counter | 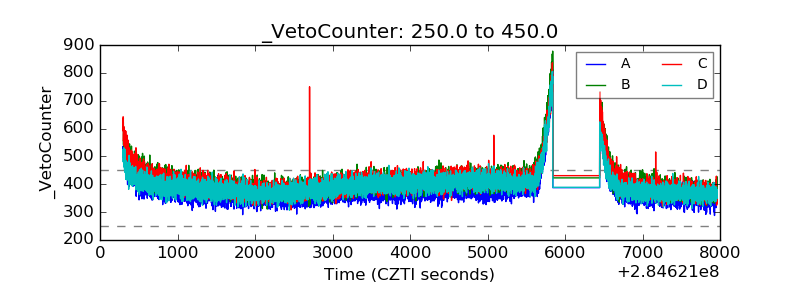 |