| Param | Original file | Final file |
|---|---|---|
| Filename | modeM0/AS1T03_070T01_9000002632_17736cztM0_level2.evt | modeM0/AS1T03_070T01_9000002632_17736cztM0_level2_quad_clean.evt |
| Size (bytes) | 159,670,080 | 16,001,280 |
| Size | 152.3 MB | 15.3 MB |
| Events in quadrant A | 1,142,309 | 80,235 |
| Events in quadrant B | 1,162,044 | 83,400 |
| Events in quadrant C | 1,168,320 | 80,386 |
| Events in quadrant D | 1,208,797 | 78,782 |
| Mode M0 | |||
|---|---|---|---|
| Quadrant | BADHDUFLAG | Total packets | Discarded packets |
| A | 0 | 4868 | 1 |
| B | 0 | 4907 | 1 |
| C | 0 | 4890 | 1 |
| D | 0 | 5083 | 1 |
| Mode M9 | |||
|---|---|---|---|
| Quadrant | BADHDUFLAG | Total packets | Discarded packets |
| A | 0 | 1 | 0 |
| B | 0 | 1 | 0 |
| C | 0 | 1 | 0 |
| D | 0 | 1 | 0 |
| Mode SS | |||
|---|---|---|---|
| Quadrant | BADHDUFLAG | Total packets | Discarded packets |
| A | 0 | 46 | 0 |
| B | 0 | 46 | 0 |
| C | 0 | 46 | 0 |
| D | 0 | 46 | 0 |
| Quadrant | Total seconds | Saturated seconds | Saturation percentage |
|---|---|---|---|
| A | 2229 | 239 | 10.722297% |
| B | 2229 | 246 | 11.036339% |
| C | 2229 | 232 | 10.408255% |
| D | 2229 | 202 | 9.062360% |
Noise dominated data is calculated using 1-second bins in cleaned event files. If a bin has >2000 counts, and if more than 50% of those come from <1% of pixels, then it is considered to be noise-dominated and hence unusable.
| Quadrant | # 1 sec bins | Bins with >0 counts | Bins with >2000 counts | High rate bins dominated by noise | Noise dominated (total time) | Noise dominated (detector-on time) | Marked lightcurve |
|---|---|---|---|---|---|---|---|
| A | 2294 | 2231 | 0 | 0 | 0.00% | 0.00% |  |
| B | 2294 | 2231 | 2 | 2 | 0.09% | 0.09% | 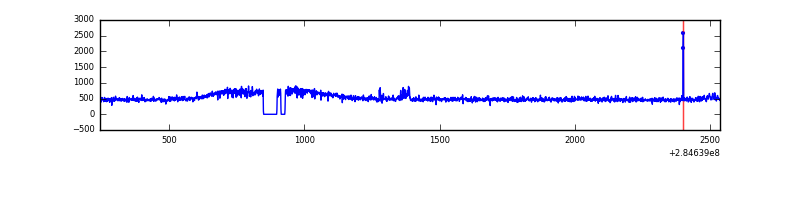 |
| C | 2294 | 2231 | 0 | 0 | 0.00% | 0.00% | 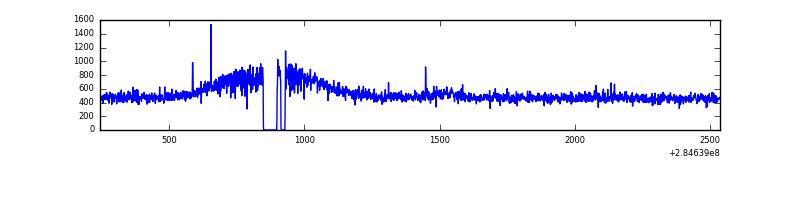 |
| D | 2294 | 2231 | 10 | 10 | 0.44% | 0.45% |  |
Top three noisy pixels from each quadrant. If the there are fewer than three noisy pixels in the level2.evt file, extra rows are filled as -1
| Pixel properties | Quadrant properties | ||||||
|---|---|---|---|---|---|---|---|
| Quadrant | DetID | PixID | Counts | Sigma | Mean | Median | Sigma |
| A | 15 | 174 | 14799 | 230.94 | 292 | 284 | 62.9 |
| A | 14 | 237 | 3219 | 46.7 | 292 | 284 | 62.9 |
| A | 0 | 226 | 2499 | 35.24 | 292 | 284 | 62.9 |
| B | 10 | 245 | 11415 | 188.77 | 291 | 282 | 59.0 |
| B | 0 | 219 | 7409 | 120.84 | 291 | 282 | 59.0 |
| B | 12 | 111 | 7318 | 119.3 | 291 | 282 | 59.0 |
| C | 14 | 238 | 42152 | 616.81 | 280 | 280 | 67.9 |
| C | 3 | 233 | 16906 | 244.91 | 280 | 280 | 67.9 |
| C | 0 | 207 | 6006 | 84.35 | 280 | 280 | 67.9 |
| D | 1 | 52 | 101114 | 1432.34 | 286 | 278 | 70.4 |
| D | 2 | 165 | 18972 | 265.54 | 286 | 278 | 70.4 |
| D | 2 | 234 | 8353 | 114.7 | 286 | 278 | 70.4 |
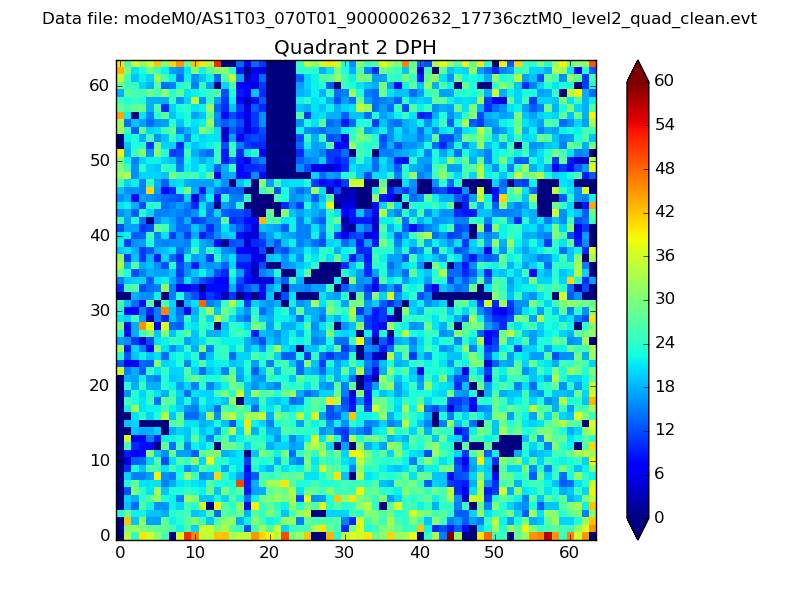
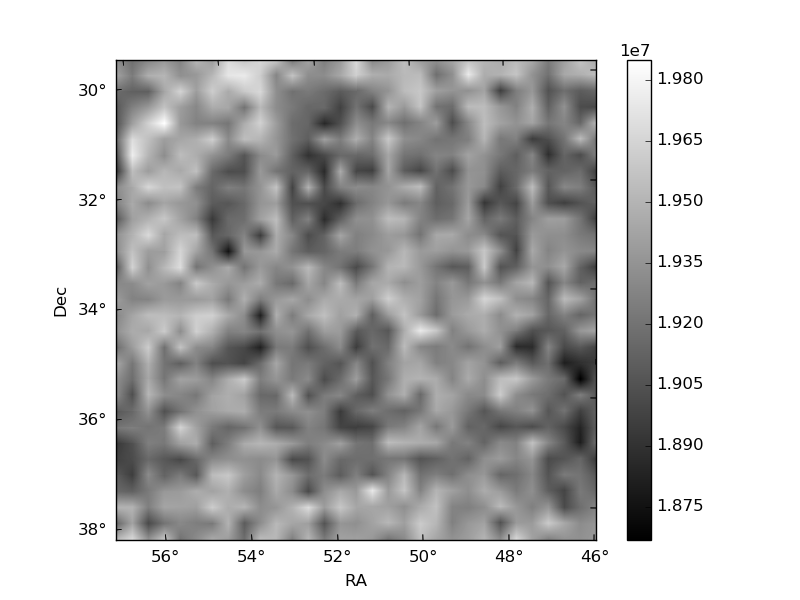
Histogram calculated using DETX and DETY for each event in the final _common_clean file
| Quadrant A | 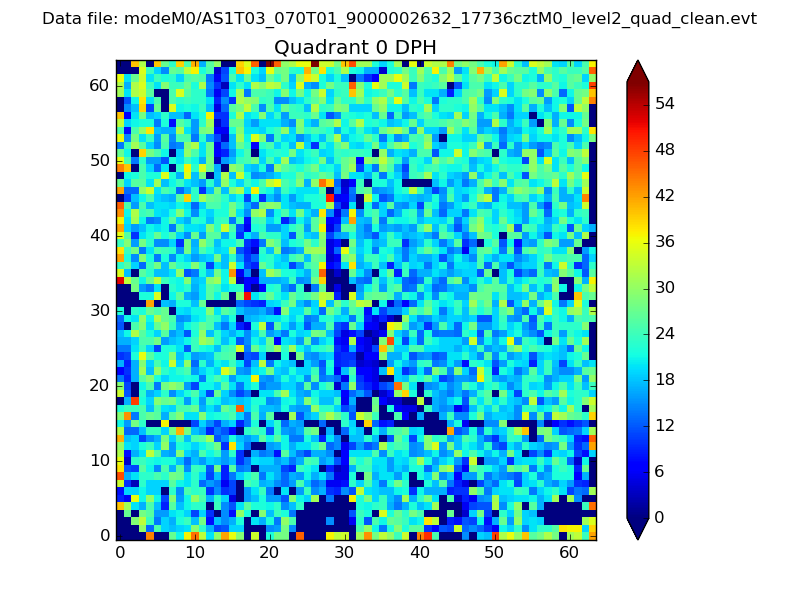 |
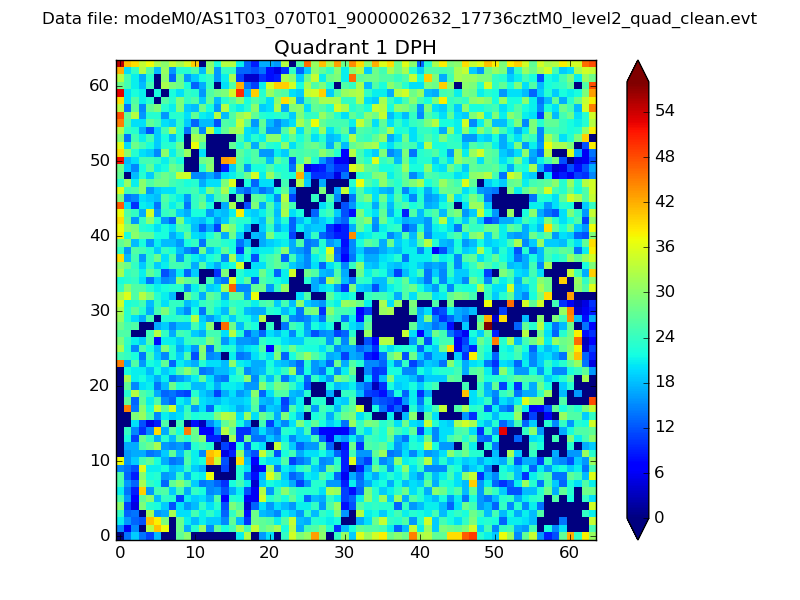 |
Quadrant B |
|---|---|---|---|
| Quadrant D | 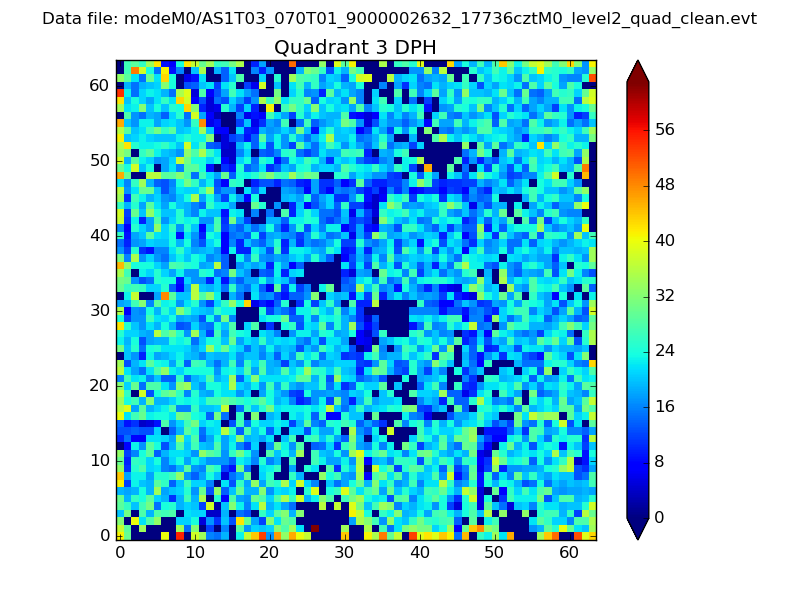 |
 |
Quadrant C |
| Plot type | Count rate plots | Images |
|---|---|---|
| Comparison with Poisson distribution Blue bars denote a histogram of data divided into 1 sec bins. Red curve is a Poisson curve with rate = median count rate of data. |
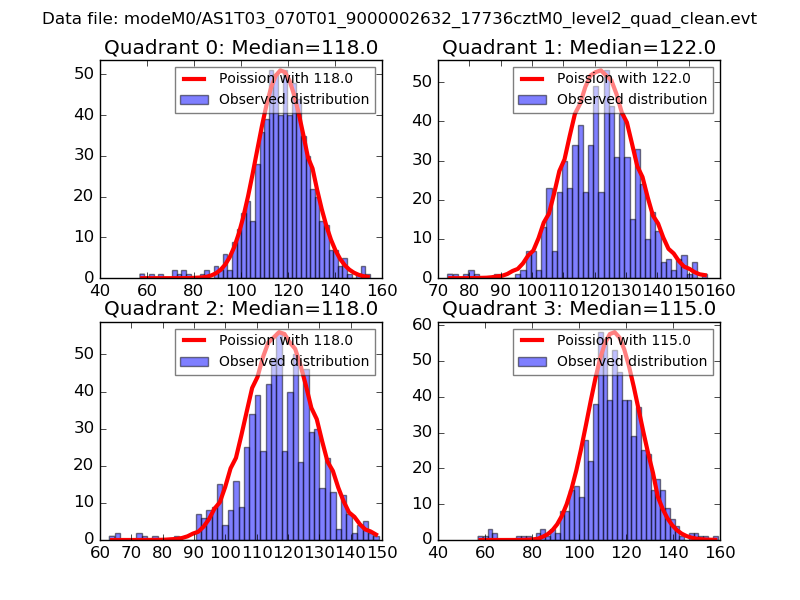 |
 |
| Quadrant-wise count rates Data is divided into 100 sec bins |
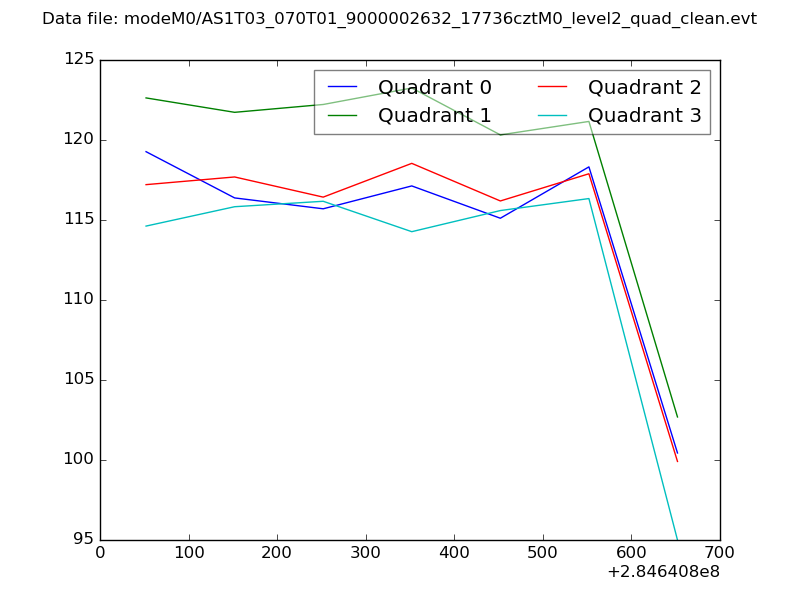 |
|
| Module-wise count rates for Quadrant A Data is divided into 100 sec bins |
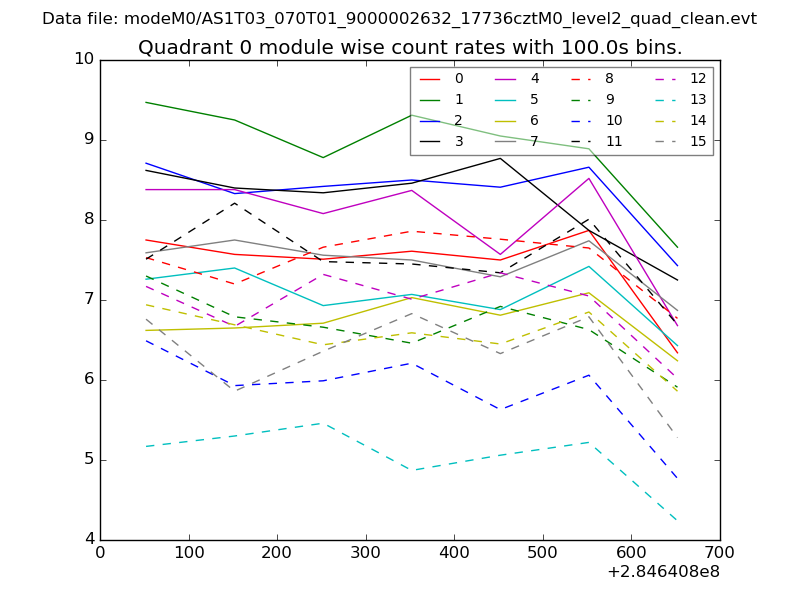 |
 |
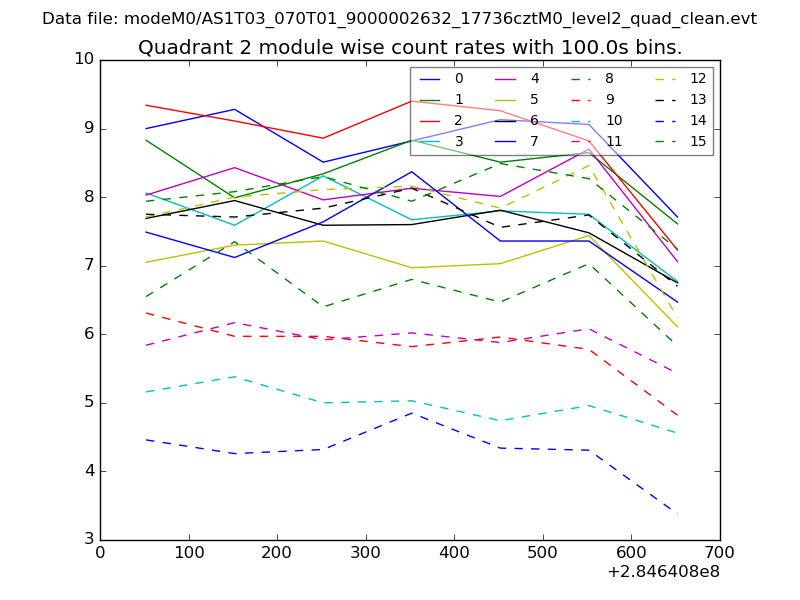
| Module-wise count rates for Quadrant B Data is divided into 100 sec bins |
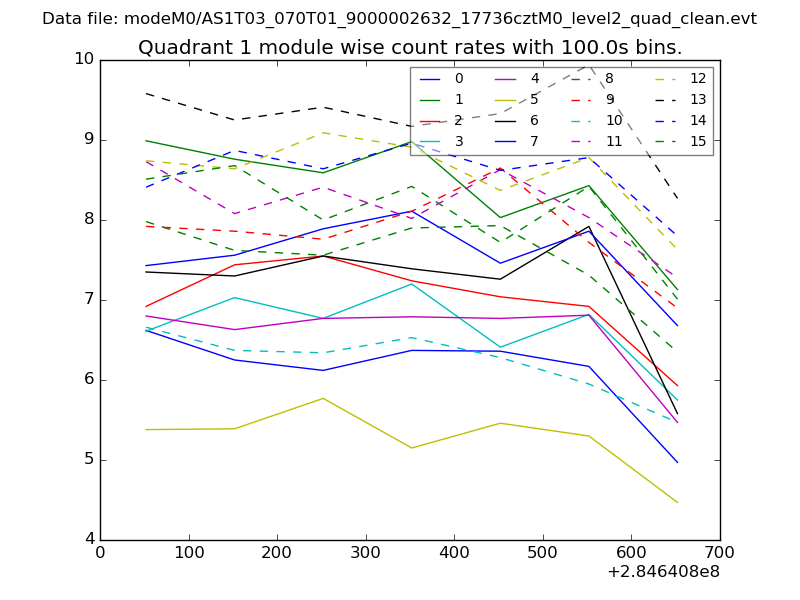 |
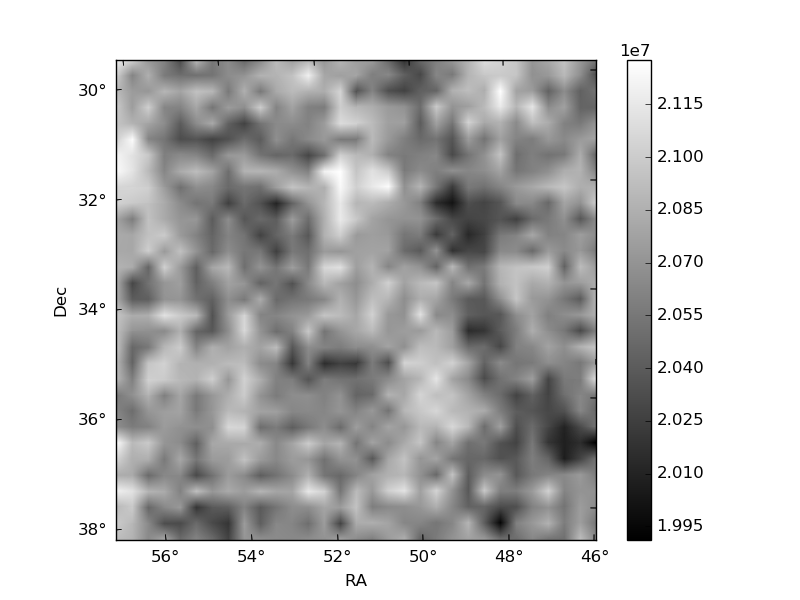 |
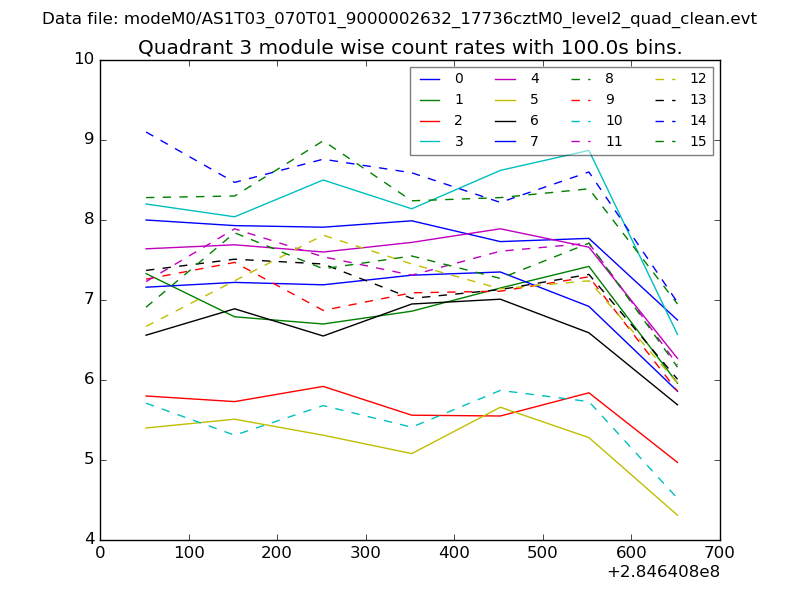
| Module-wise count rates for Quadrant C Data is divided into 100 sec bins |
 |
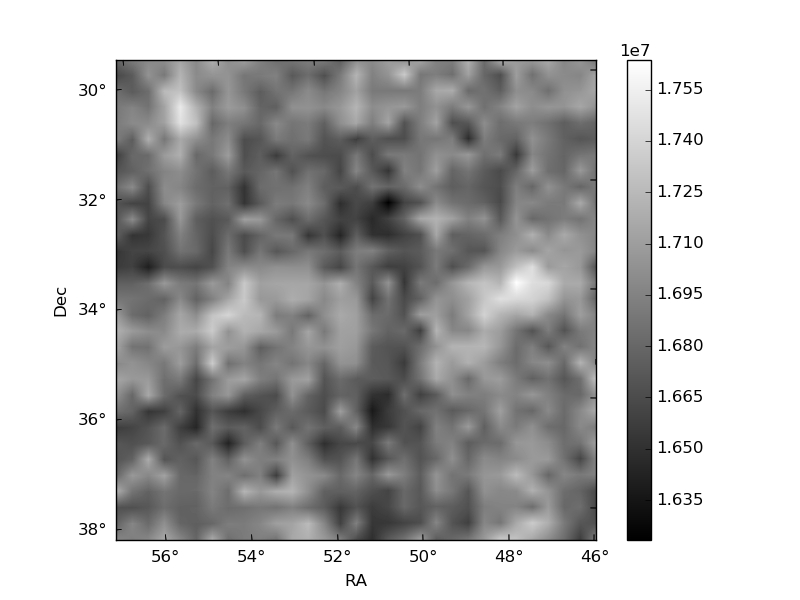 |
| Module-wise count rates for Quadrant D Data is divided into 100 sec bins |
 |
 |
| Parameter | Plot |
|---|---|
| CZT HV Monitor | 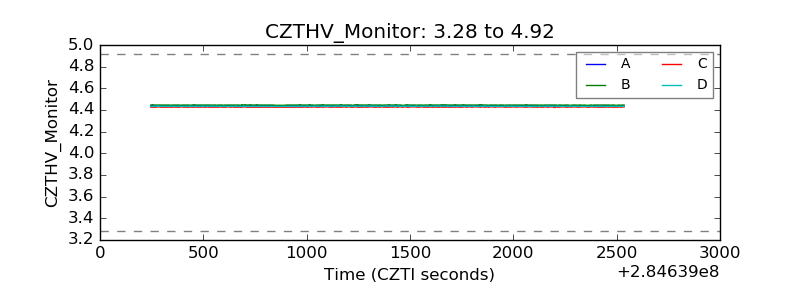 |
| D_VDD | 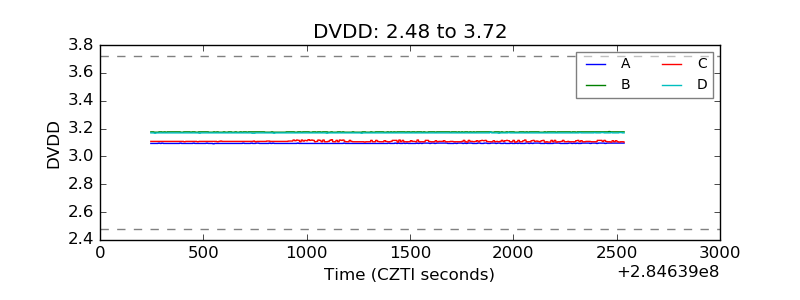 |
| Temperature 1 | 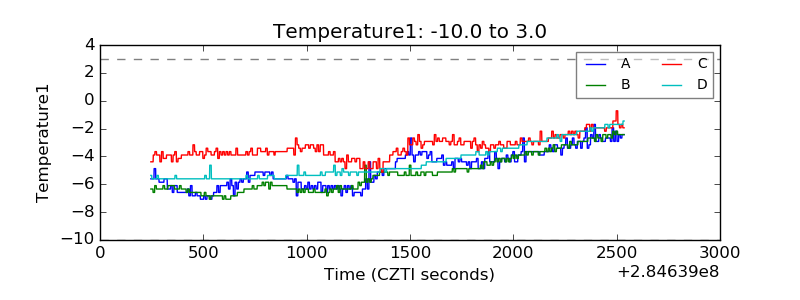 |
| Veto HV Monitor | 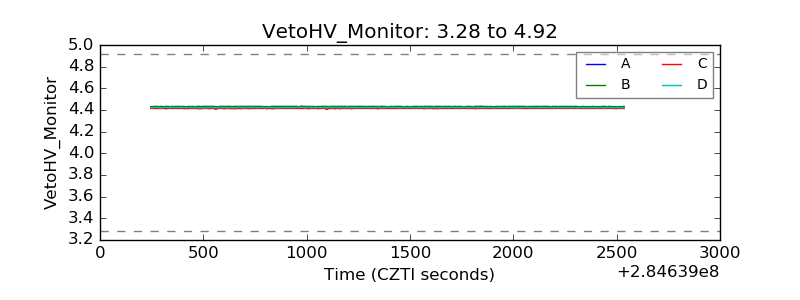 |
| Veto LLD | 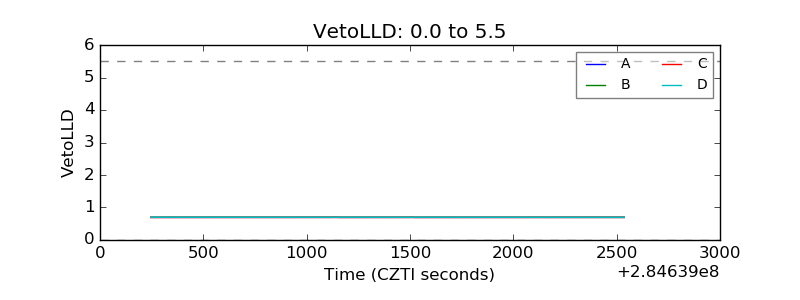 |
| Alpha Counter | 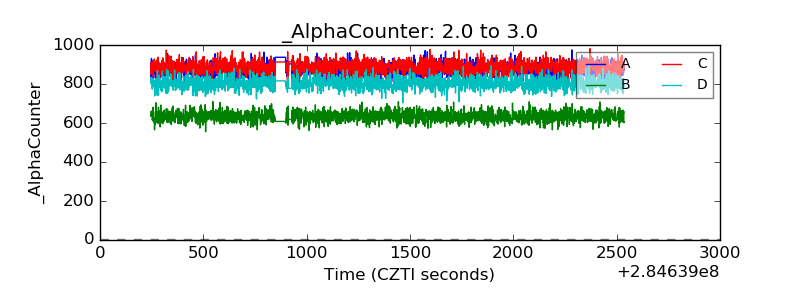 |
| _CPM_Rate | 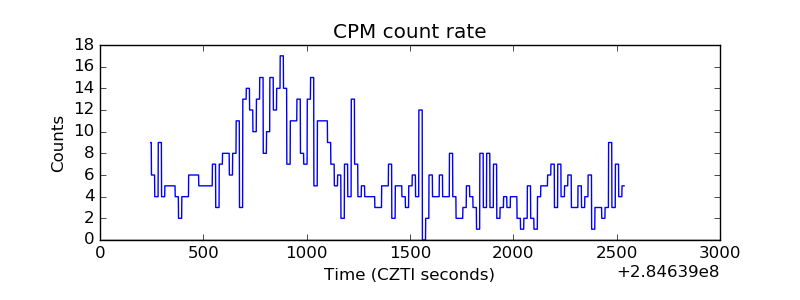 |
| CZT Counter | 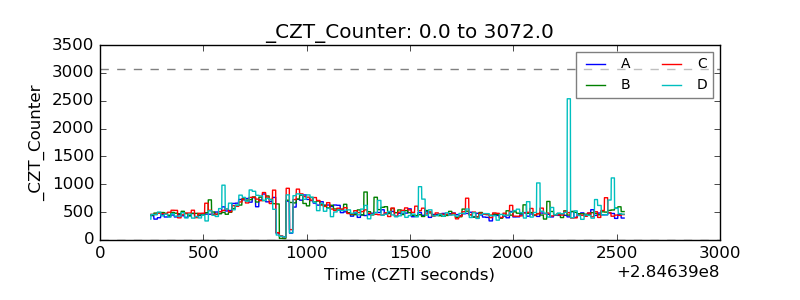 |
| +2.5 Volts monitor |  |
| +5 Volts monitor |  |
| _ROLL_ROT | 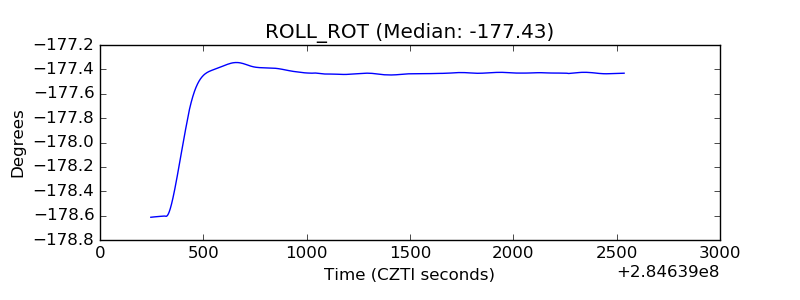 |
| _Roll_DEC | 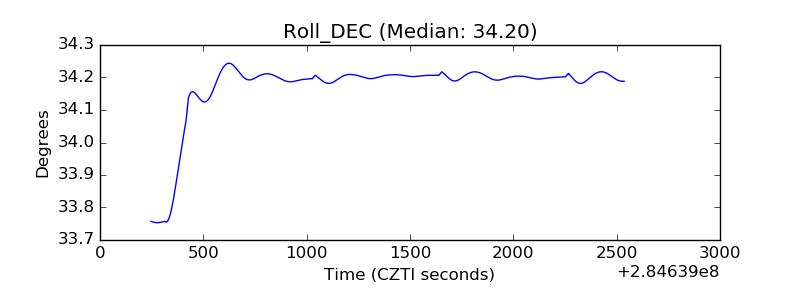 |
| _Roll_RA | 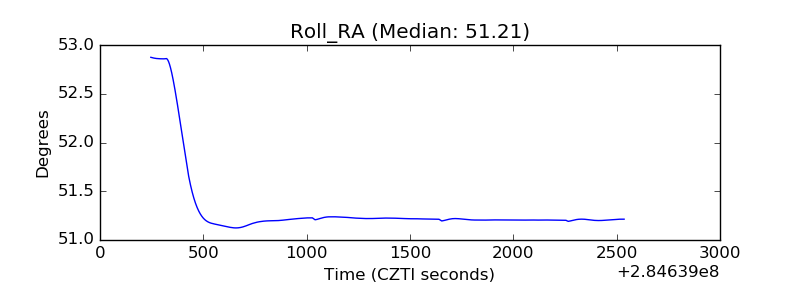 |
| Veto Counter | 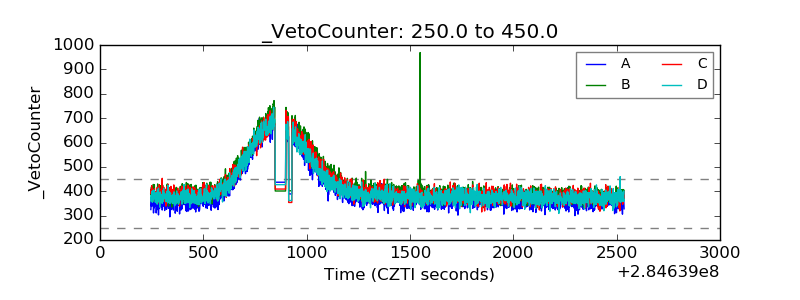 |