| Param | Original file | Final file |
|---|---|---|
| Filename | modeM0/AS1T03_070T01_9000002632_17739cztM0_level2.evt | modeM0/AS1T03_070T01_9000002632_17739cztM0_level2_quad_clean.evt |
| Size (bytes) | 207,302,400 | 51,494,400 |
| Size | 197.7 MB | 49.1 MB |
| Events in quadrant A | 1,328,703 | 342,960 |
| Events in quadrant B | 1,467,544 | 343,977 |
| Events in quadrant C | 1,299,910 | 334,984 |
| Events in quadrant D | 1,978,969 | 326,280 |
| Mode M0 | |||
|---|---|---|---|
| Quadrant | BADHDUFLAG | Total packets | Discarded packets |
| A | 0 | 5981 | 0 |
| B | 0 | 6318 | 0 |
| C | 0 | 5923 | 0 |
| D | 0 | 7865 | 0 |
| Mode SS | |||
|---|---|---|---|
| Quadrant | BADHDUFLAG | Total packets | Discarded packets |
| A | 0 | 60 | 0 |
| B | 0 | 60 | 0 |
| C | 0 | 60 | 0 |
| D | 0 | 60 | 0 |
| Quadrant | Total seconds | Saturated seconds | Saturation percentage |
|---|---|---|---|
| A | 2956 | 0 | 0.000000% |
| B | 2956 | 18 | 0.608931% |
| C | 2956 | 7 | 0.236806% |
| D | 2956 | 113 | 3.822733% |
Noise dominated data is calculated using 1-second bins in cleaned event files. If a bin has >2000 counts, and if more than 50% of those come from <1% of pixels, then it is considered to be noise-dominated and hence unusable.
| Quadrant | # 1 sec bins | Bins with >0 counts | Bins with >2000 counts | High rate bins dominated by noise | Noise dominated (total time) | Noise dominated (detector-on time) | Marked lightcurve |
|---|---|---|---|---|---|---|---|
| A | 2956 | 2956 | 0 | 0 | 0.00% | 0.00% | 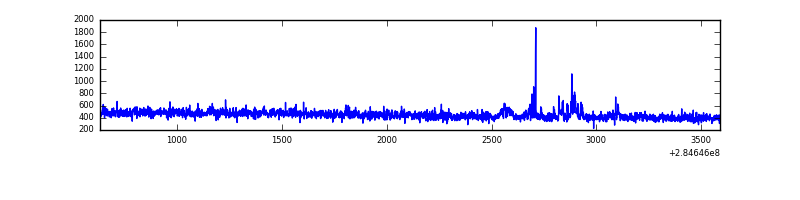 |
| B | 2956 | 2956 | 14 | 14 | 0.47% | 0.47% | 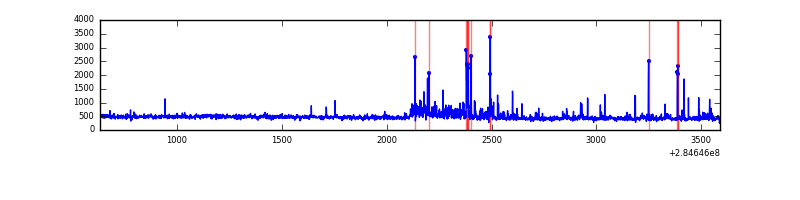 |
| C | 2956 | 2956 | 0 | 0 | 0.00% | 0.00% | 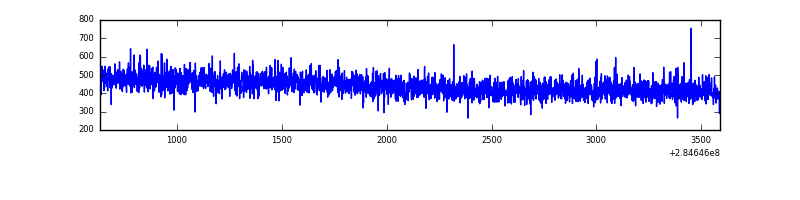 |
| D | 2956 | 2956 | 89 | 89 | 3.01% | 3.01% |  |
Top three noisy pixels from each quadrant. If the there are fewer than three noisy pixels in the level2.evt file, extra rows are filled as -1
| Pixel properties | Quadrant properties | ||||||
|---|---|---|---|---|---|---|---|
| Quadrant | DetID | PixID | Counts | Sigma | Mean | Median | Sigma |
| A | 15 | 174 | 34413 | 494.97 | 333 | 326 | 68.9 |
| A | 14 | 237 | 9342 | 130.92 | 333 | 326 | 68.9 |
| A | 0 | 226 | 2909 | 37.51 | 333 | 326 | 68.9 |
| B | 7 | 220 | 112025 | 1739.52 | 327 | 318 | 64.2 |
| B | 0 | 219 | 19928 | 305.37 | 327 | 318 | 64.2 |
| B | 10 | 245 | 19533 | 299.22 | 327 | 318 | 64.2 |
| C | 14 | 238 | 48937 | 646.16 | 315 | 316 | 75.2 |
| C | 5 | 218 | 17494 | 228.29 | 315 | 316 | 75.2 |
| C | 3 | 233 | 5414 | 67.75 | 315 | 316 | 75.2 |
| D | 7 | 223 | 376583 | 4376.17 | 317 | 310 | 86.0 |
| D | 10 | 70 | 188043 | 2183.39 | 317 | 310 | 86.0 |
| D | 1 | 52 | 122457 | 1420.61 | 317 | 310 | 86.0 |
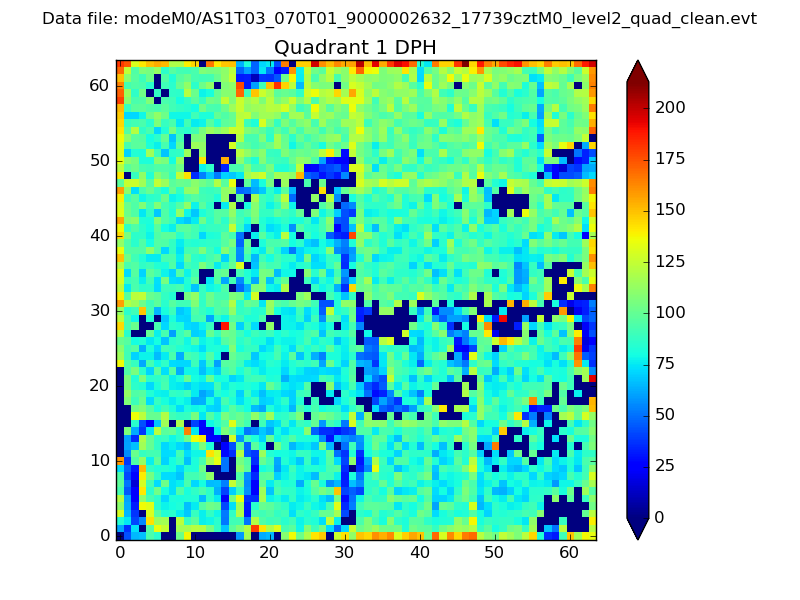
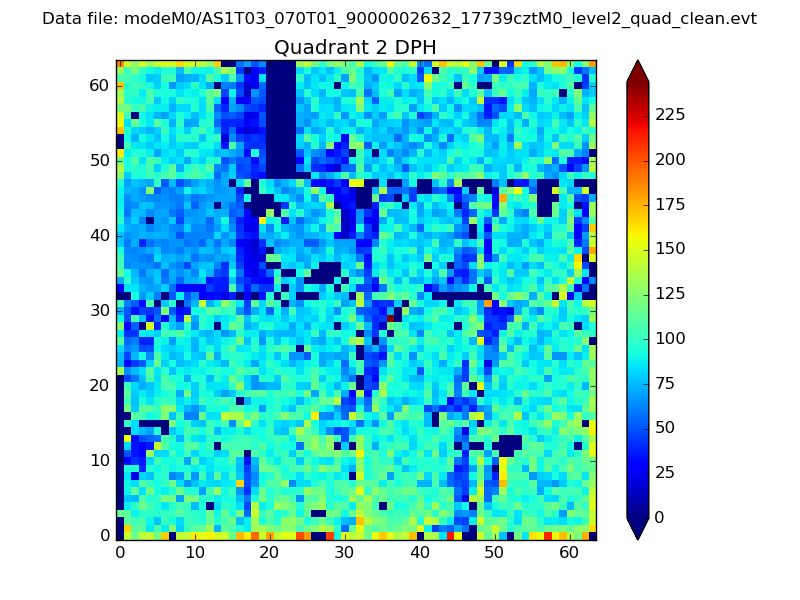
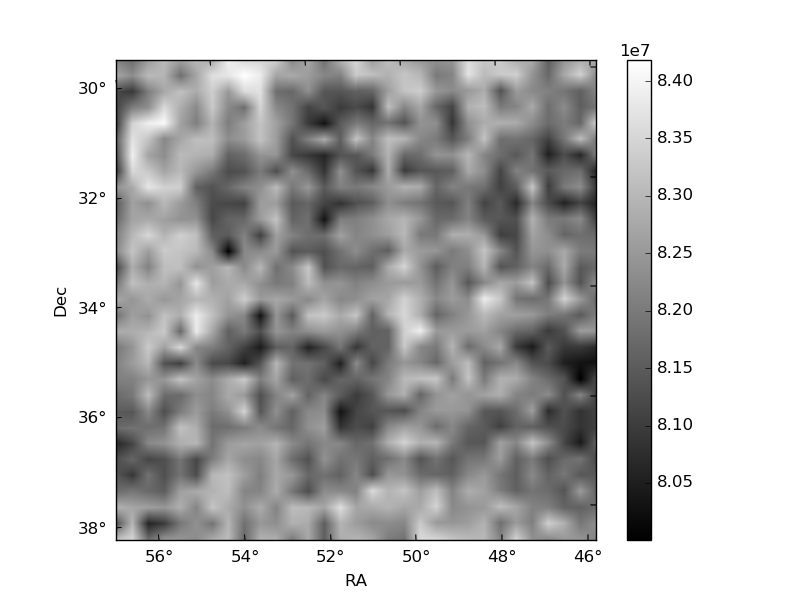
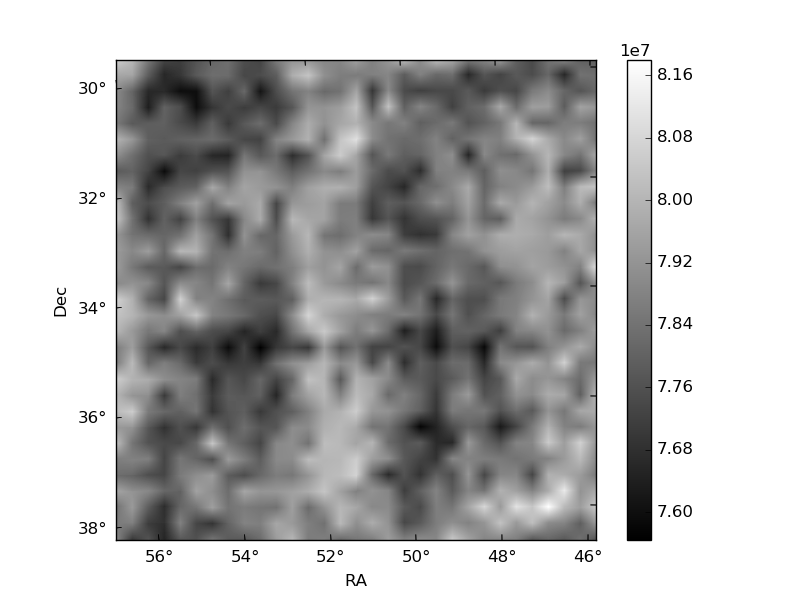
Histogram calculated using DETX and DETY for each event in the final _common_clean file
| Quadrant A |  |
 |
Quadrant B |
|---|---|---|---|
| Quadrant D | 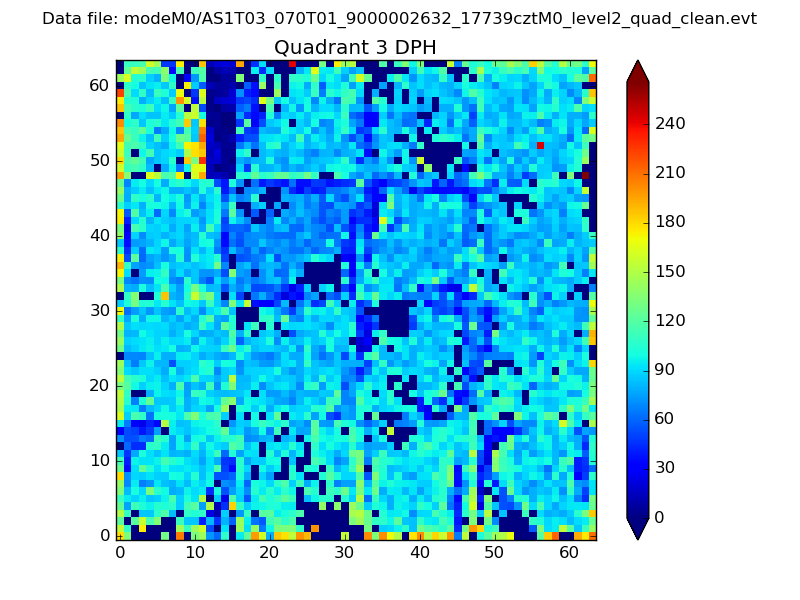 |
 |
Quadrant C |
| Plot type | Count rate plots | Images |
|---|---|---|
| Comparison with Poisson distribution Blue bars denote a histogram of data divided into 1 sec bins. Red curve is a Poisson curve with rate = median count rate of data. |
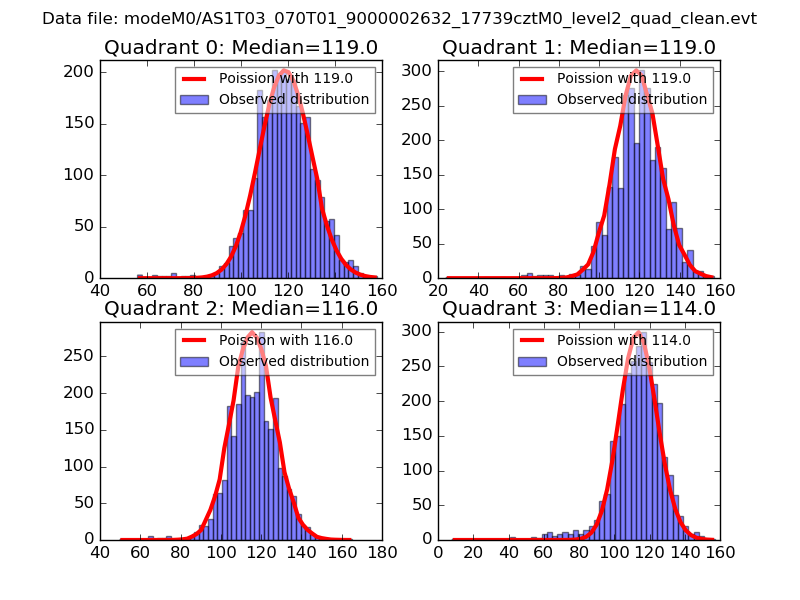 |
 |
| Quadrant-wise count rates Data is divided into 100 sec bins |
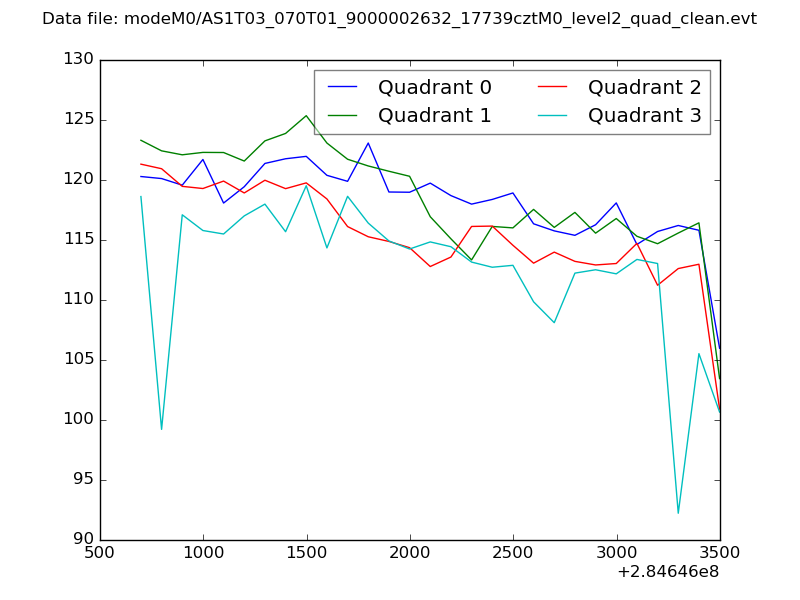 |
|
| Module-wise count rates for Quadrant A Data is divided into 100 sec bins |
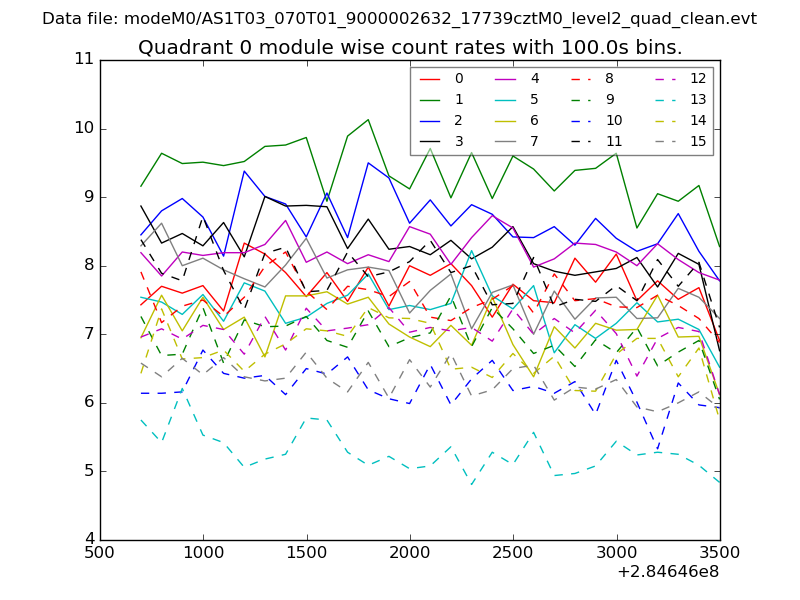 |
 |
| Module-wise count rates for Quadrant B Data is divided into 100 sec bins |
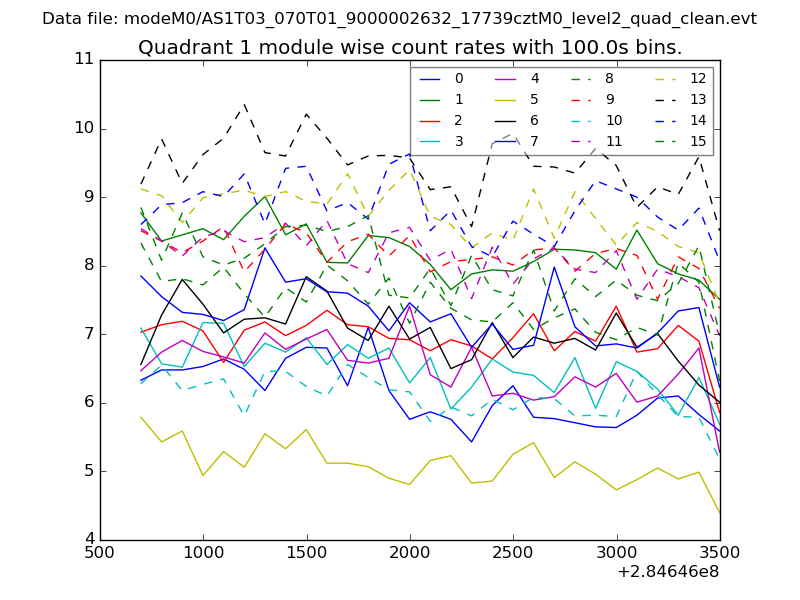 |
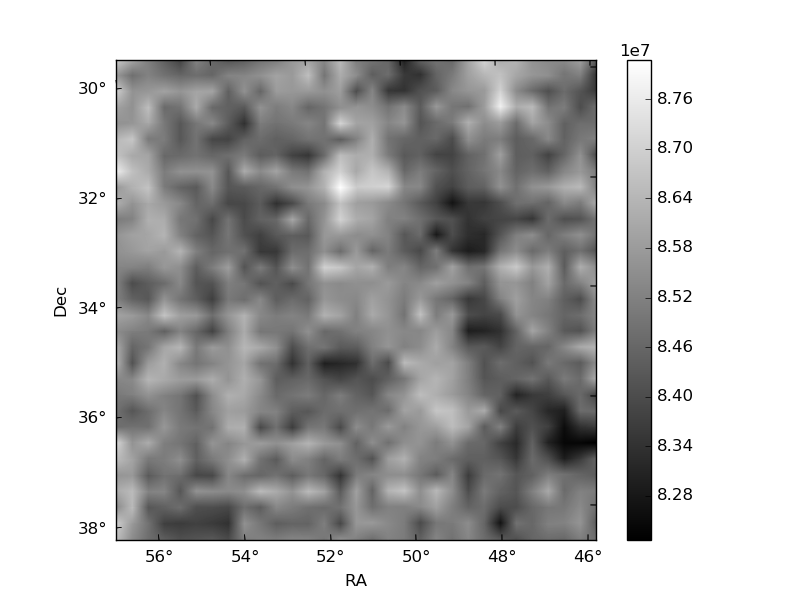 |
| Module-wise count rates for Quadrant C Data is divided into 100 sec bins |
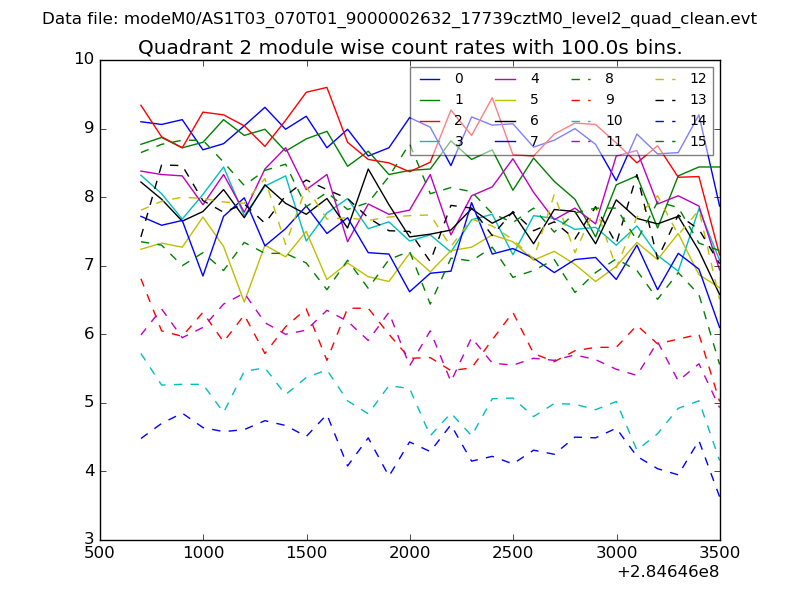 |
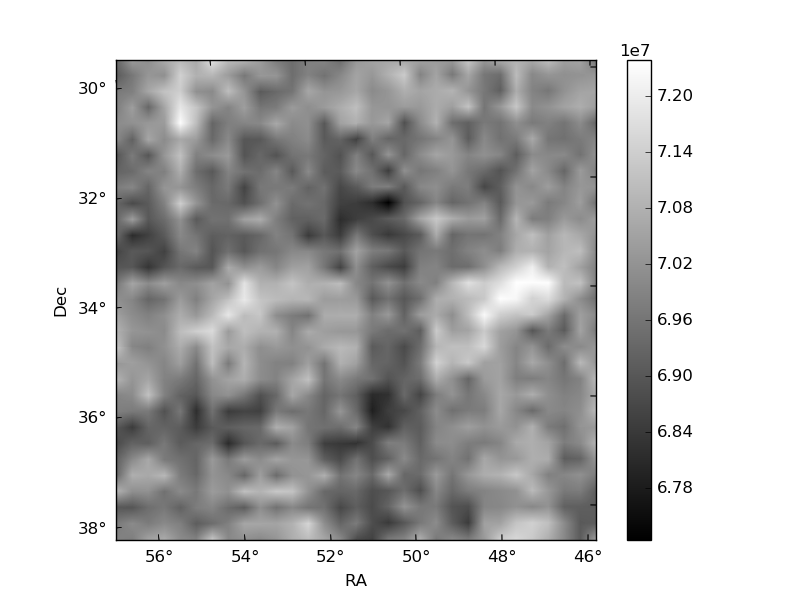 |
| Module-wise count rates for Quadrant D Data is divided into 100 sec bins |
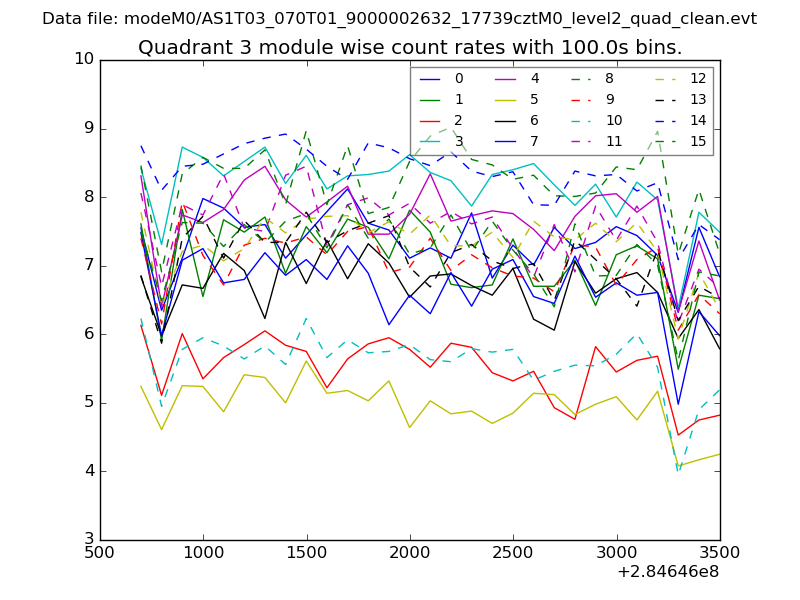 |
 |
| Parameter | Plot |
|---|---|
| CZT HV Monitor | 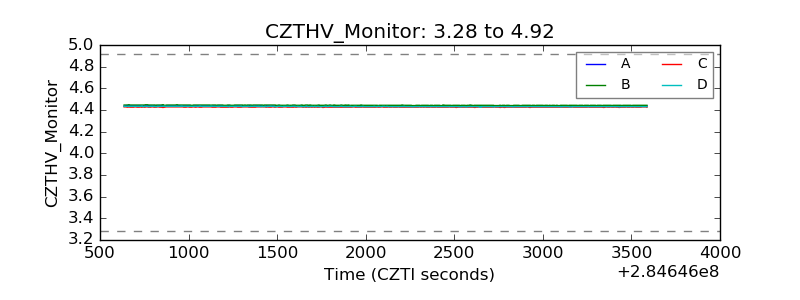 |
| D_VDD | 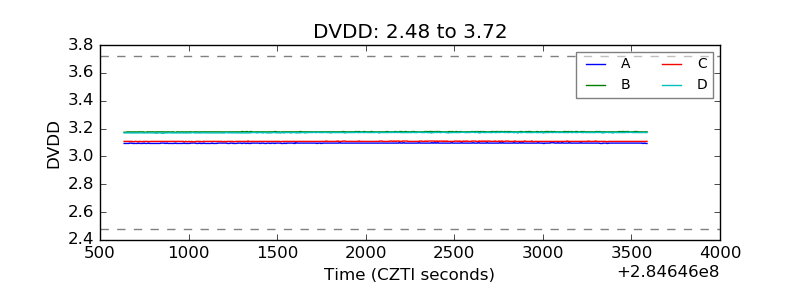 |
| Temperature 1 | 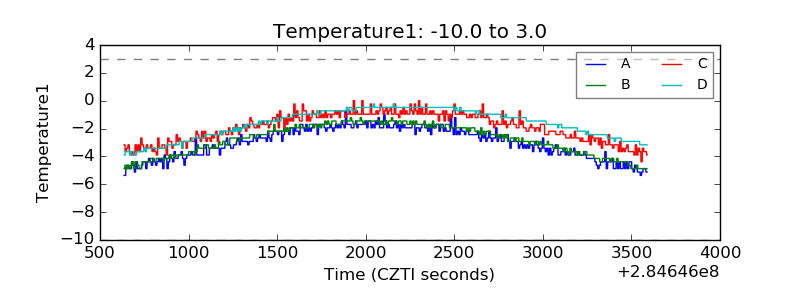 |
| Veto HV Monitor | 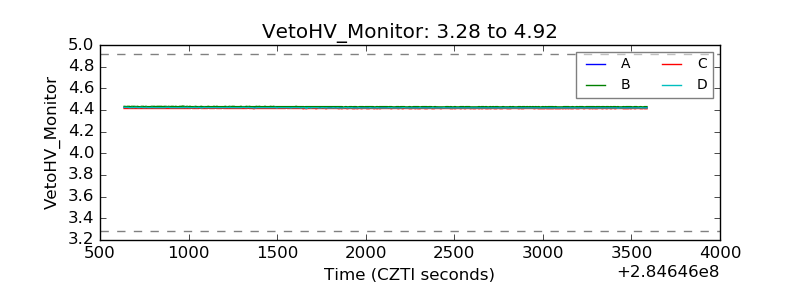 |
| Veto LLD |  |
| Alpha Counter | 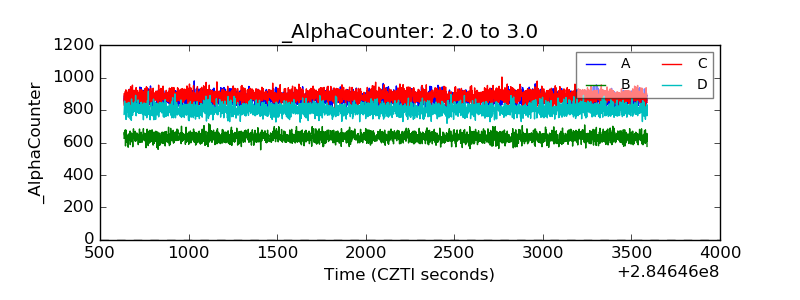 |
| _CPM_Rate | 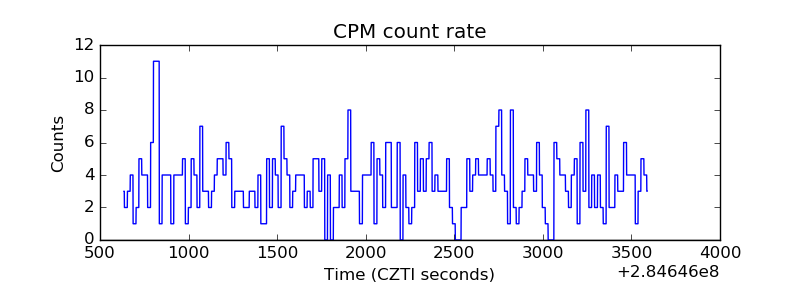 |
| CZT Counter | 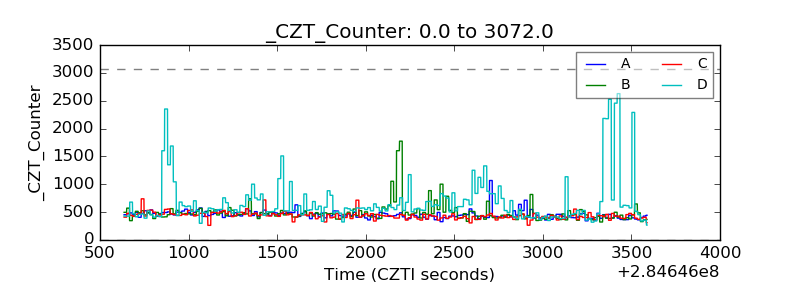 |
| +2.5 Volts monitor |  |
| +5 Volts monitor |  |
| _ROLL_ROT | 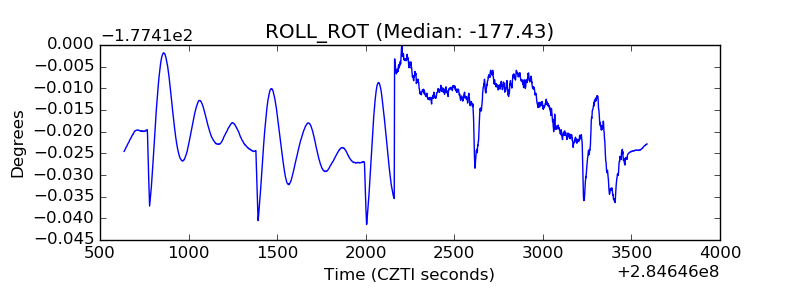 |
| _Roll_DEC | 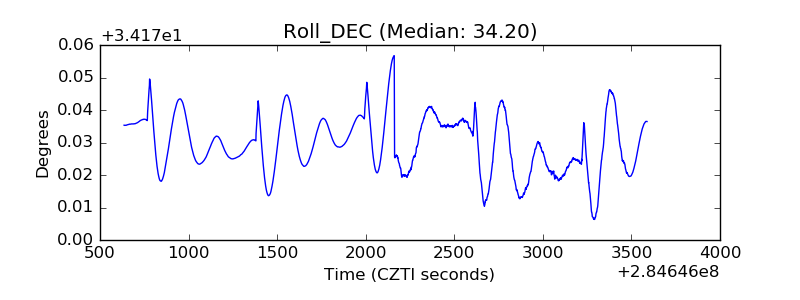 |
| _Roll_RA | 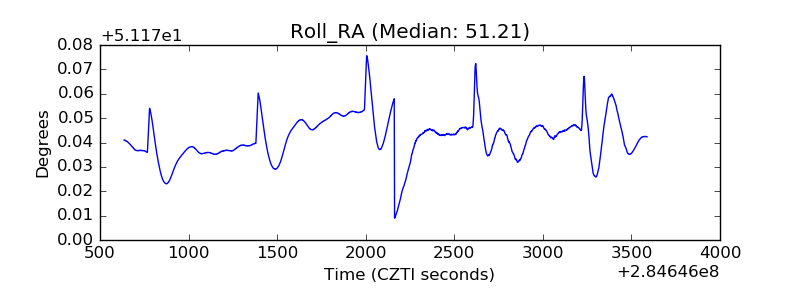 |
| Veto Counter | 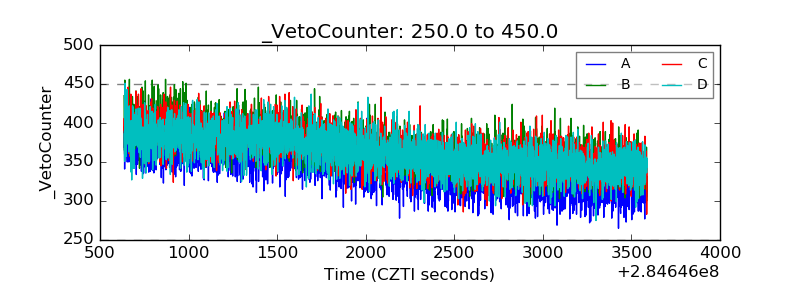 |