| Param | Original file | Final file |
|---|---|---|
| Filename | modeM0/AS1T03_070T02_9000002634cztM0_level2.fits | modeM0/AS1T03_070T02_9000002634cztM0_level2_quad_clean.evt |
| Size (bytes) | 92,399,040 | 92,851,200 |
| Size | 88.1 MB | 88.5 MB |
| Events in quadrant A | 554,100 | 554,776 |
| Events in quadrant B | 532,426 | 547,145 |
| Events in quadrant C | 541,240 | 524,770 |
| Events in quadrant D | 474,512 | 488,639 |
| Mode M9 | |||
|---|---|---|---|
| Quadrant | BADHDUFLAG | Total packets | Discarded packets |
| A | 0 | 13 | 0 |
| B | 0 | 13 | 0 |
| C | 0 | 13 | 0 |
| D | 0 | 13 | 0 |
| Mode SS | |||
|---|---|---|---|
| Quadrant | BADHDUFLAG | Total packets | Discarded packets |
| A | 0 | 206 | 0 |
| B | 0 | 206 | 0 |
| C | 0 | 206 | 0 |
| D | 0 | 206 | 0 |
| Mode M0 | |||
|---|---|---|---|
| Quadrant | BADHDUFLAG | Total packets | Discarded packets |
| A | 0 | 20576 | 0 |
| B | 0 | 20913 | 0 |
| C | 0 | 20479 | 0 |
| D | 0 | 22338 | 0 |
| Quadrant | Total seconds | Saturated seconds | Saturation percentage |
|---|---|---|---|
| A | 10041 | 102 | 1.015835% |
| B | 10041 | 136 | 1.354447% |
| C | 10041 | 131 | 1.304651% |
| D | 10041 | 148 | 1.473957% |
Noise dominated data is calculated using 1-second bins in cleaned event files. If a bin has >2000 counts, and if more than 50% of those come from <1% of pixels, then it is considered to be noise-dominated and hence unusable.
| Quadrant | # 1 sec bins | Bins with >0 counts | Bins with >2000 counts | High rate bins dominated by noise | Noise dominated (total time) | Noise dominated (detector-on time) | Marked lightcurve |
|---|---|---|---|---|---|---|---|
| A | 11401 | 10039 | 0 | 0 | 0.00% | 0.00% |  |
| B | 11401 | 10039 | 0 | 0 | 0.00% | 0.00% |  |
| C | 11401 | 10039 | 0 | 0 | 0.00% | 0.00% |  |
| D | 11401 | 10038 | 0 | 0 | 0.00% | 0.00% |  |
Top three noisy pixels from each quadrant. If the there are fewer than three noisy pixels in the level2.evt file, extra rows are filled as -1
| Pixel properties | Quadrant properties | ||||||
|---|---|---|---|---|---|---|---|
| Quadrant | DetID | PixID | Counts | Sigma | Mean | Median | Sigma |
| A | 0 | 29 | 512 | 9.82 | 144 | 134 | 38.5 |
| A | 14 | 79 | 435 | 7.82 | 144 | 134 | 38.5 |
| A | 9 | 19 | 432 | 7.74 | 144 | 134 | 38.5 |
| B | 2 | 9 | 449 | 10.53 | 140 | 133 | 30.0 |
| B | 5 | 232 | 367 | 7.8 | 140 | 133 | 30.0 |
| B | 2 | 8 | 364 | 7.7 | 140 | 133 | 30.0 |
| C | 9 | 188 | 362 | 6.08 | 143 | 133 | 37.6 |
| C | 12 | 242 | 356 | 5.92 | 143 | 133 | 37.6 |
| C | 7 | 203 | 350 | 5.76 | 143 | 133 | 37.6 |
| D | 1 | 31 | 372 | 6.61 | 135 | 123 | 37.7 |
| D | 4 | 160 | 357 | 6.21 | 135 | 123 | 37.7 |
| D | 3 | 14 | 357 | 6.21 | 135 | 123 | 37.7 |
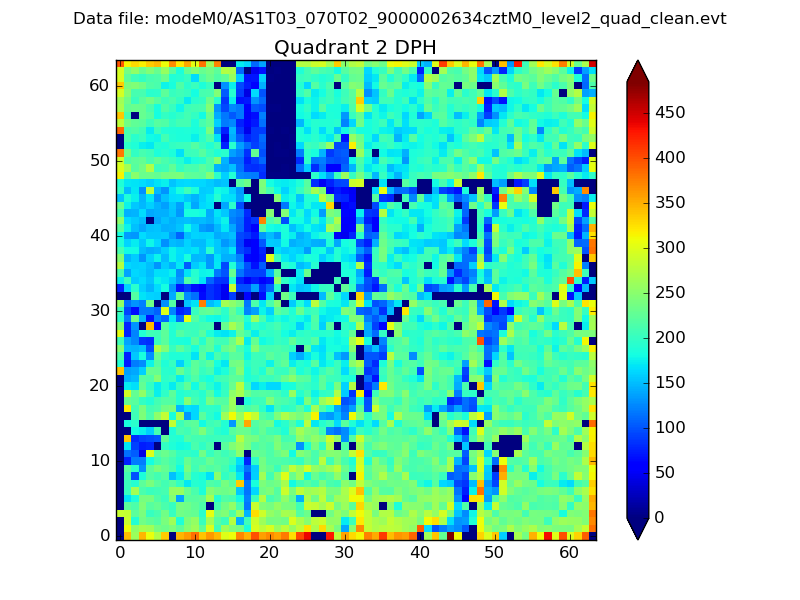
Histogram calculated using DETX and DETY for each event in the final _common_clean file
| Quadrant A |  |
 |
Quadrant B |
|---|---|---|---|
| Quadrant D |  |
 |
Quadrant C |
| Plot type | Count rate plots | Images |
|---|---|---|
| Comparison with Poisson distribution Blue bars denote a histogram of data divided into 1 sec bins. Red curve is a Poisson curve with rate = median count rate of data. |
 |
 |
| Quadrant-wise count rates Data is divided into 100 sec bins |
 |
|
| Module-wise count rates for Quadrant A Data is divided into 100 sec bins |
 |
 |
| Module-wise count rates for Quadrant B Data is divided into 100 sec bins |
 |
 |
| Module-wise count rates for Quadrant C Data is divided into 100 sec bins |
 |
 |
| Module-wise count rates for Quadrant D Data is divided into 100 sec bins |
 |
 |
| Parameter | Plot |
|---|---|
| CZT HV Monitor |  |
| D_VDD |  |
| Temperature 1 |  |
| Veto HV Monitor |  |
| Veto LLD |  |
| Alpha Counter |  |
| _CPM_Rate |  |
| CZT Counter |  |
| +2.5 Volts monitor |  |
| +5 Volts monitor |  |
| _ROLL_ROT |  |
| _Roll_DEC |  |
| _Roll_RA |  |
| Veto Counter |  |