| Param | Original file | Final file |
|---|---|---|
| Filename | modeM0/AS1T03_070T02_9000002634_17739cztM0_level2.evt | modeM0/AS1T03_070T02_9000002634_17739cztM0_level2_quad_clean.evt |
| Size (bytes) | 615,461,760 | 113,388,480 |
| Size | 587.0 MB | 108.1 MB |
| Events in quadrant A | 4,300,595 | 708,890 |
| Events in quadrant B | 4,527,902 | 709,941 |
| Events in quadrant C | 4,389,831 | 684,329 |
| Events in quadrant D | 4,790,393 | 686,389 |
| Mode M9 | |||
|---|---|---|---|
| Quadrant | BADHDUFLAG | Total packets | Discarded packets |
| A | 0 | 13 | 0 |
| B | 0 | 13 | 0 |
| C | 0 | 13 | 0 |
| D | 0 | 13 | 0 |
| Mode SS | |||
|---|---|---|---|
| Quadrant | BADHDUFLAG | Total packets | Discarded packets |
| A | 0 | 190 | 0 |
| B | 0 | 190 | 0 |
| C | 0 | 190 | 0 |
| D | 0 | 190 | 0 |
| Mode M0 | |||
|---|---|---|---|
| Quadrant | BADHDUFLAG | Total packets | Discarded packets |
| A | 0 | 19071 | 2 |
| B | 0 | 19403 | 2 |
| C | 0 | 18977 | 3 |
| D | 0 | 20562 | 2 |
| Quadrant | Total seconds | Saturated seconds | Saturation percentage |
|---|---|---|---|
| A | 9290 | 102 | 1.097955% |
| B | 9290 | 136 | 1.463940% |
| C | 9289 | 130 | 1.399505% |
| D | 9289 | 138 | 1.485628% |
Noise dominated data is calculated using 1-second bins in cleaned event files. If a bin has >2000 counts, and if more than 50% of those come from <1% of pixels, then it is considered to be noise-dominated and hence unusable.
| Quadrant | # 1 sec bins | Bins with >0 counts | Bins with >2000 counts | High rate bins dominated by noise | Noise dominated (total time) | Noise dominated (detector-on time) | Marked lightcurve |
|---|---|---|---|---|---|---|---|
| A | 10650 | 9290 | 1 | 1 | 0.01% | 0.01% | 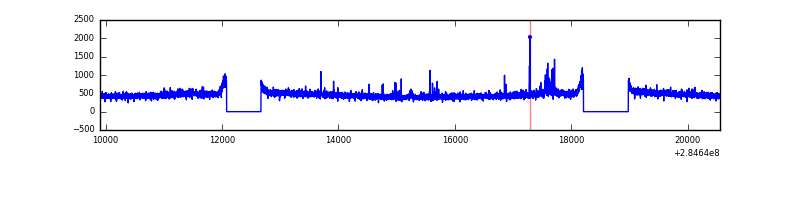 |
| B | 10650 | 9290 | 22 | 22 | 0.21% | 0.24% | 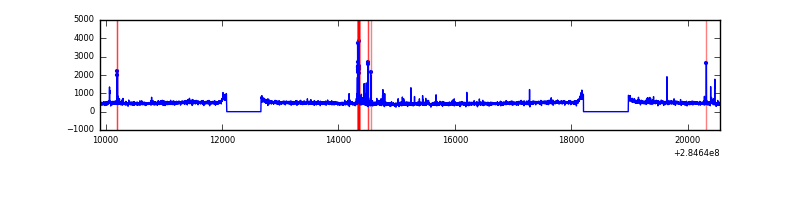 |
| C | 10649 | 9289 | 0 | 0 | 0.00% | 0.00% | 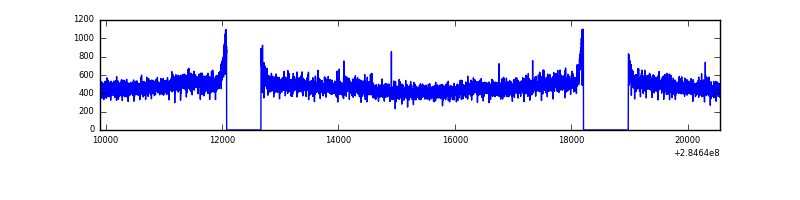 |
| D | 10649 | 9289 | 45 | 45 | 0.42% | 0.48% | 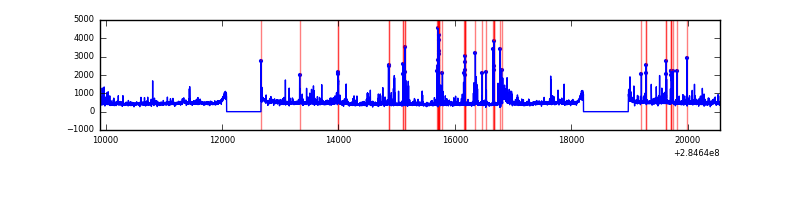 |
Top three noisy pixels from each quadrant. If the there are fewer than three noisy pixels in the level2.evt file, extra rows are filled as -1
| Pixel properties | Quadrant properties | ||||||
|---|---|---|---|---|---|---|---|
| Quadrant | DetID | PixID | Counts | Sigma | Mean | Median | Sigma |
| A | 15 | 174 | 51328 | 225.59 | 1102 | 1075 | 222.8 |
| A | 15 | 31 | 9352 | 37.16 | 1102 | 1075 | 222.8 |
| A | 0 | 226 | 9335 | 37.08 | 1102 | 1075 | 222.8 |
| B | 7 | 220 | 109100 | 514.36 | 1100 | 1071 | 210.0 |
| B | 10 | 245 | 33660 | 155.17 | 1100 | 1071 | 210.0 |
| B | 12 | 111 | 25668 | 117.12 | 1100 | 1071 | 210.0 |
| C | 14 | 238 | 162826 | 646.6 | 1063 | 1069 | 250.2 |
| C | 5 | 218 | 49621 | 194.08 | 1063 | 1069 | 250.2 |
| C | 3 | 233 | 29501 | 113.65 | 1063 | 1069 | 250.2 |
| D | 1 | 52 | 428223 | 1558.95 | 1074 | 1047 | 274.0 |
| D | 7 | 238 | 167931 | 609.03 | 1074 | 1047 | 274.0 |
| D | 2 | 234 | 45296 | 161.48 | 1074 | 1047 | 274.0 |
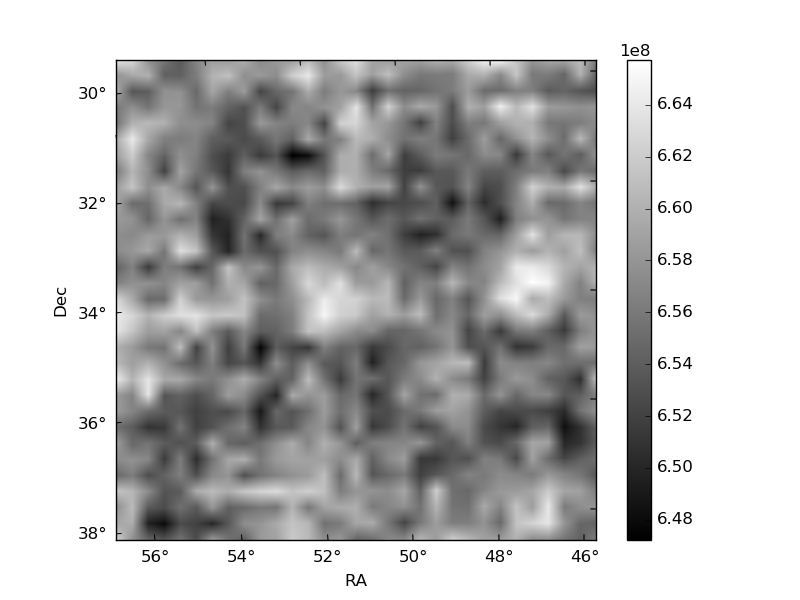
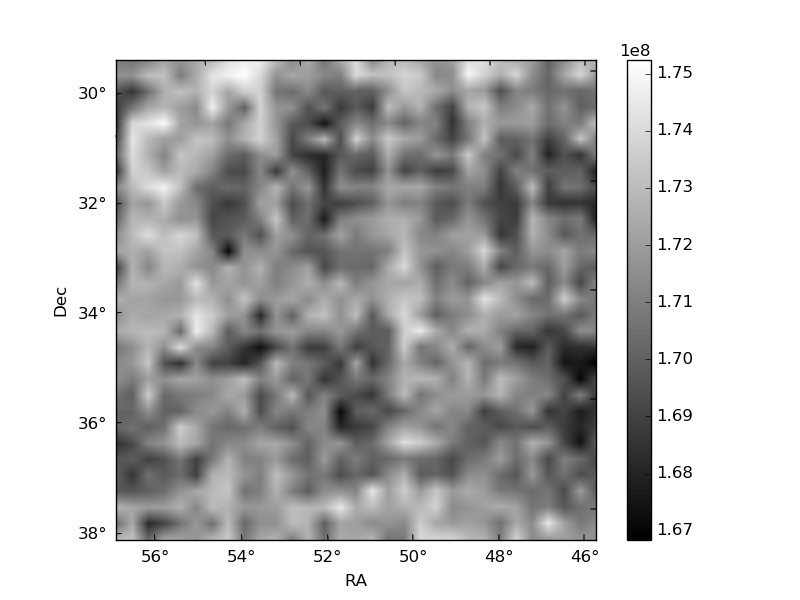
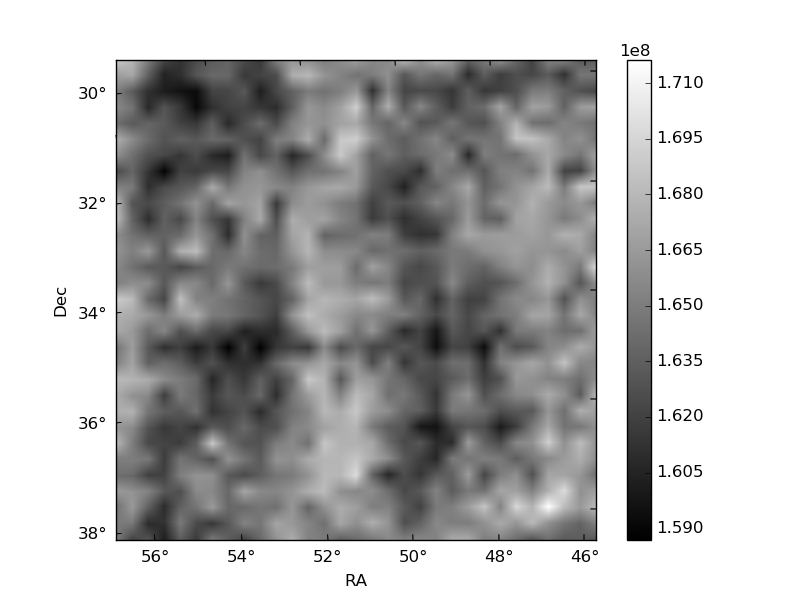
Histogram calculated using DETX and DETY for each event in the final _common_clean file
| Quadrant A | 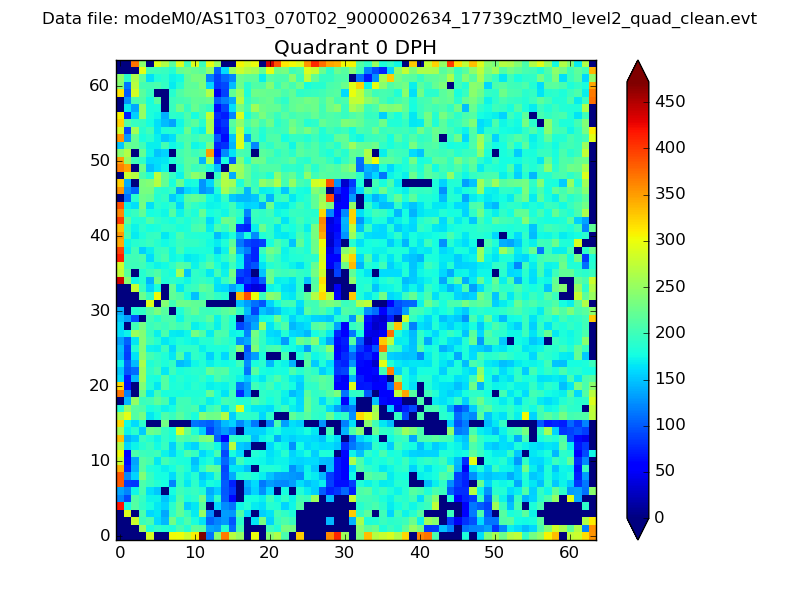 |
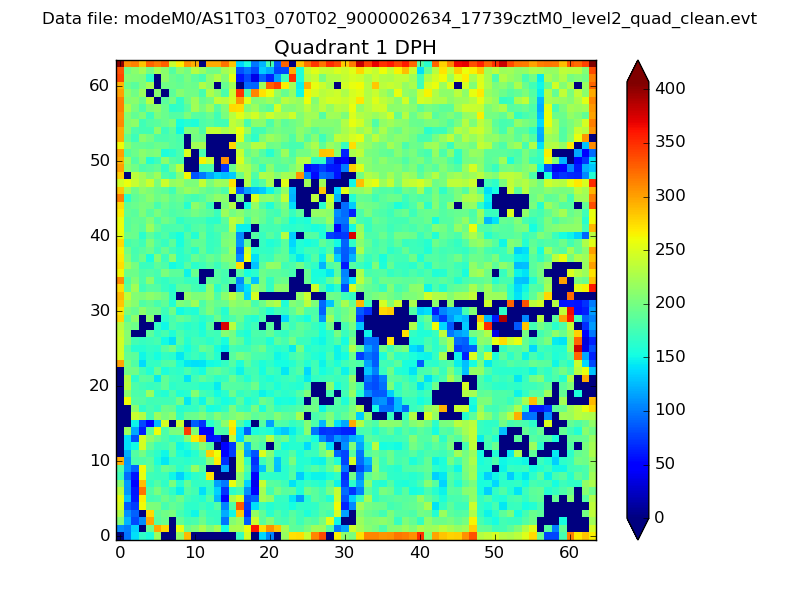 |
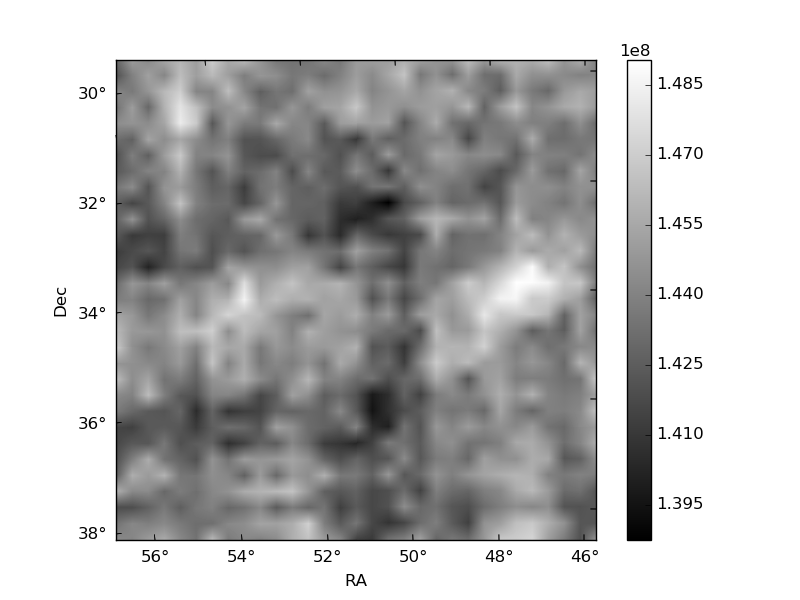
Quadrant B |
|---|---|---|---|
| Quadrant D | 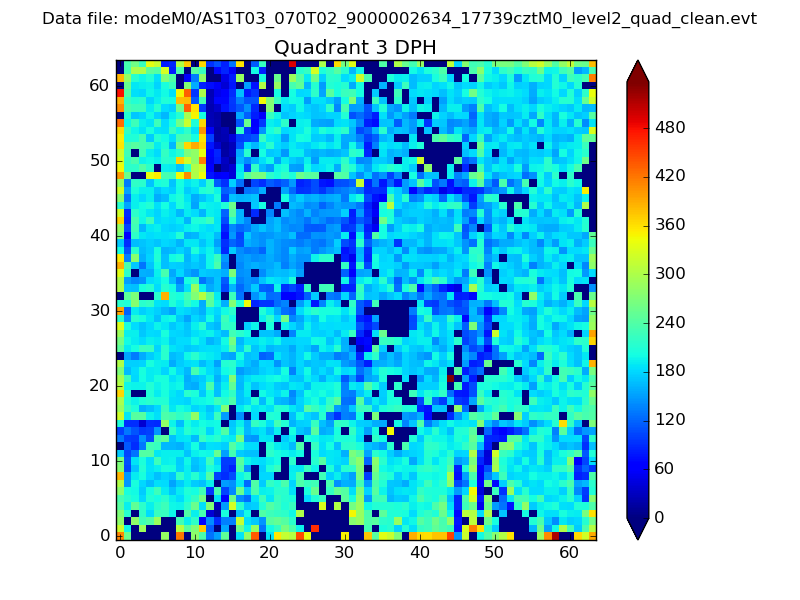 |
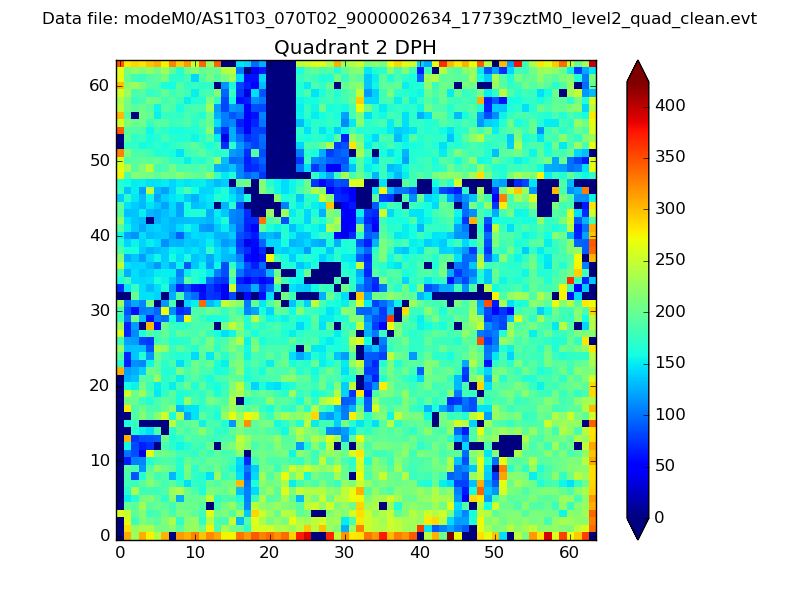 |
Quadrant C |
| Plot type | Count rate plots | Images |
|---|---|---|
| Comparison with Poisson distribution Blue bars denote a histogram of data divided into 1 sec bins. Red curve is a Poisson curve with rate = median count rate of data. |
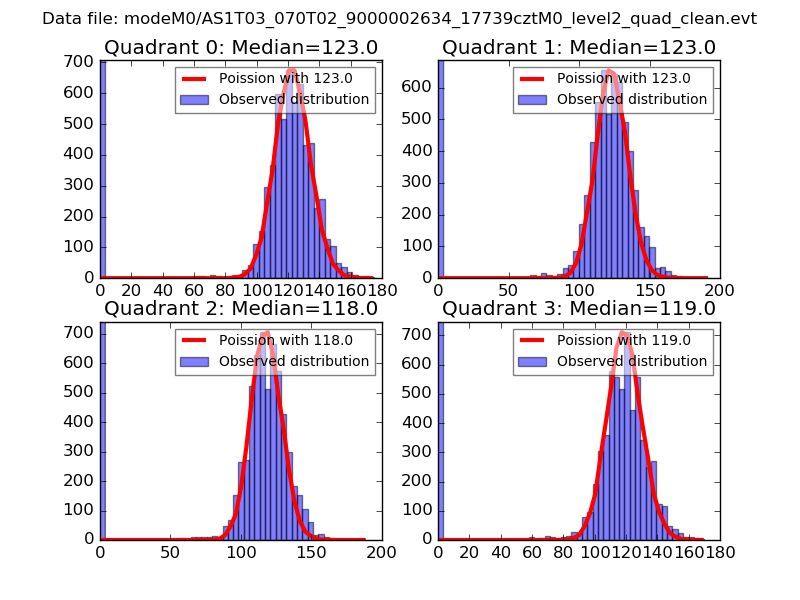 |
 |
| Quadrant-wise count rates Data is divided into 100 sec bins |
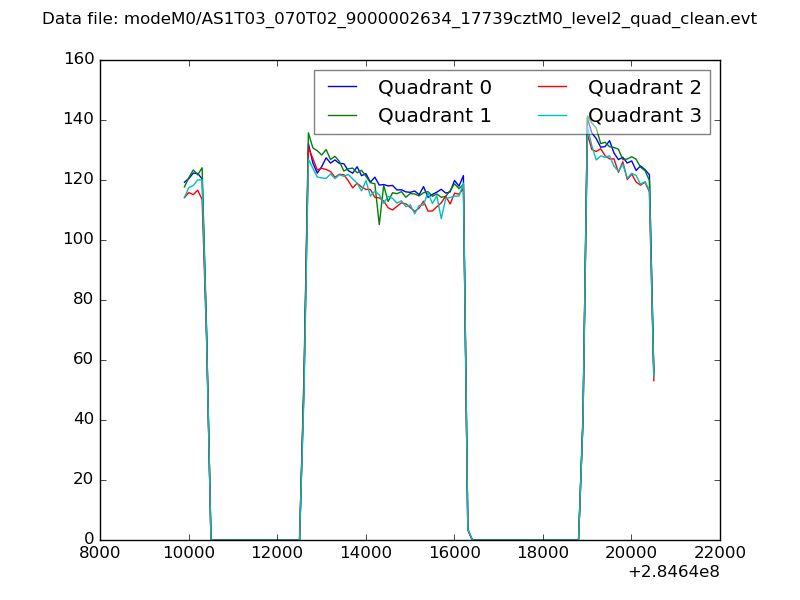 |
|
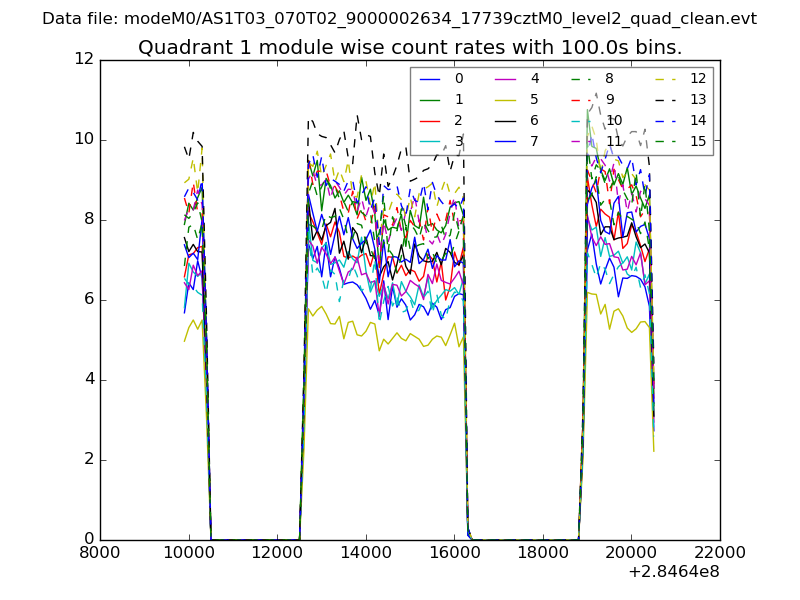
| Module-wise count rates for Quadrant A Data is divided into 100 sec bins |
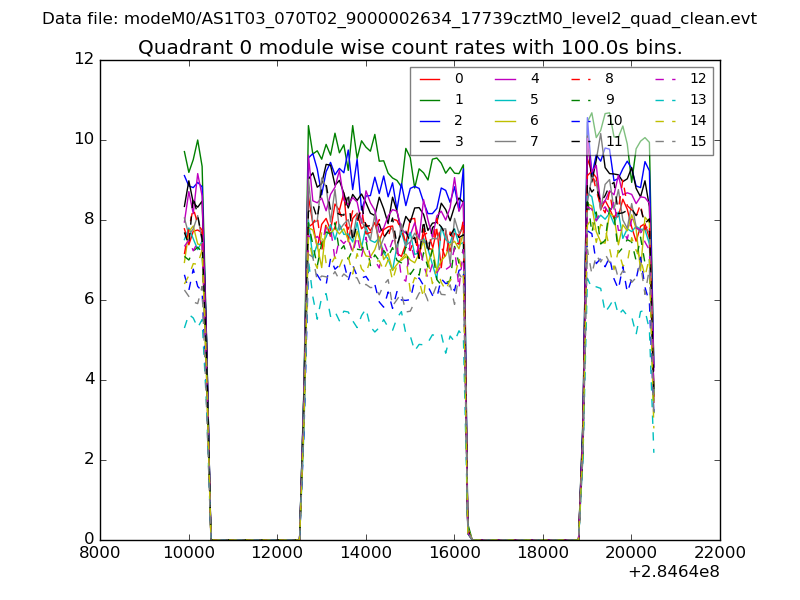 |
 |
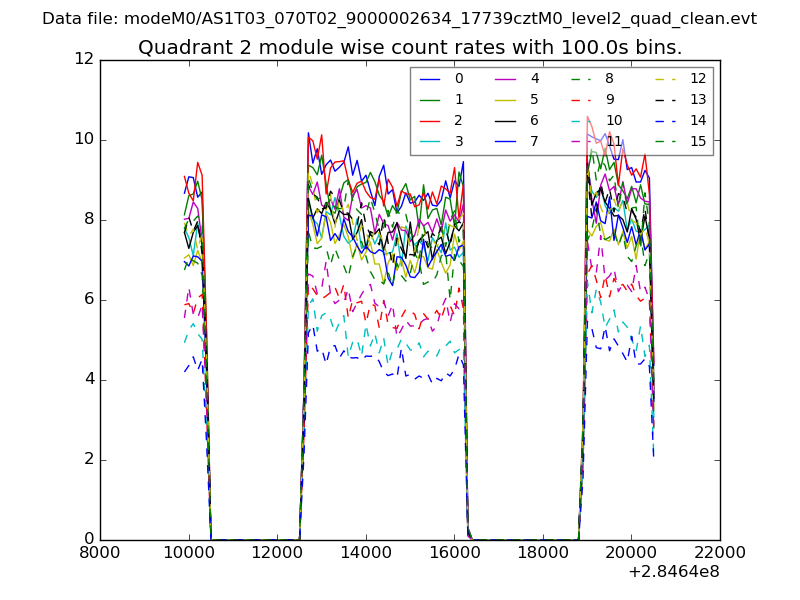
| Module-wise count rates for Quadrant B Data is divided into 100 sec bins |
 |
 |
| Module-wise count rates for Quadrant C Data is divided into 100 sec bins |
 |
 |
| Module-wise count rates for Quadrant D Data is divided into 100 sec bins |
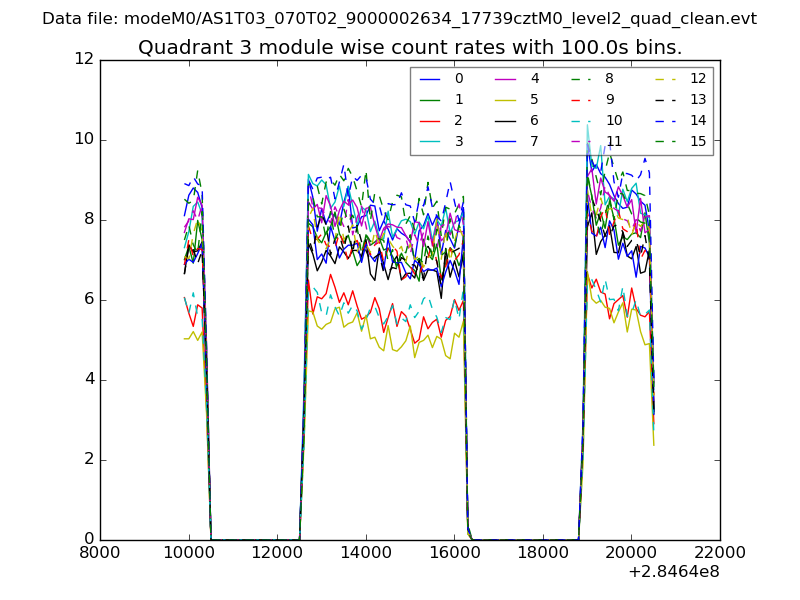 |
 |
| Parameter | Plot |
|---|---|
| CZT HV Monitor | 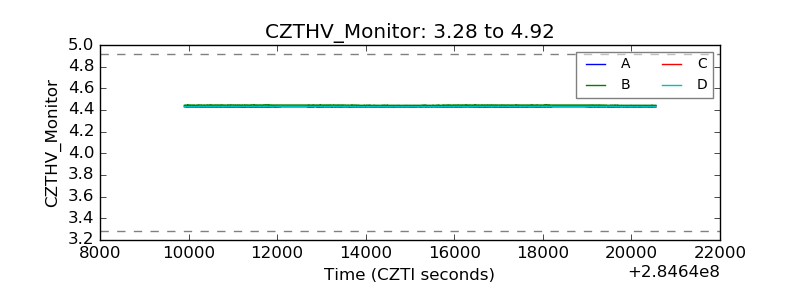 |
| D_VDD | 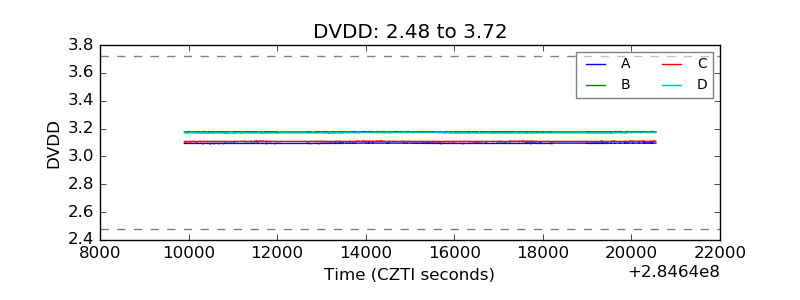 |
| Temperature 1 |  |
| Veto HV Monitor | 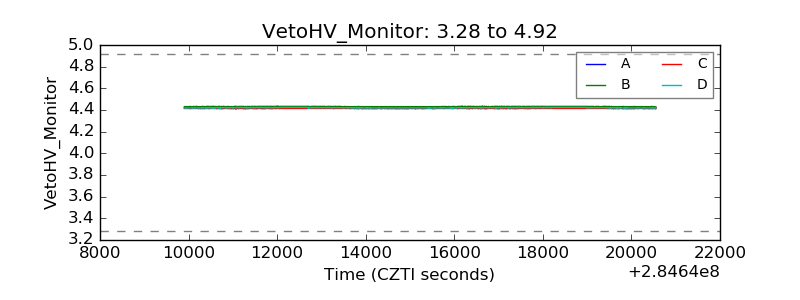 |
| Veto LLD | 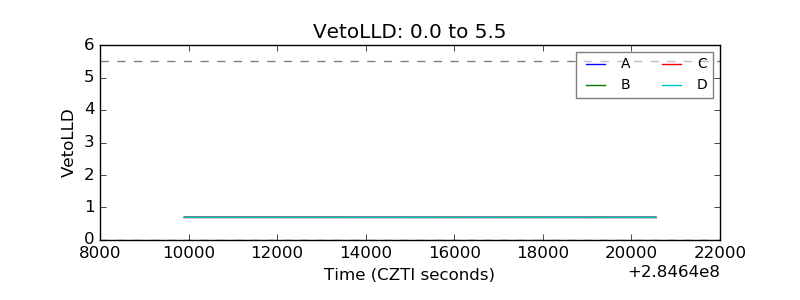 |
| Alpha Counter | 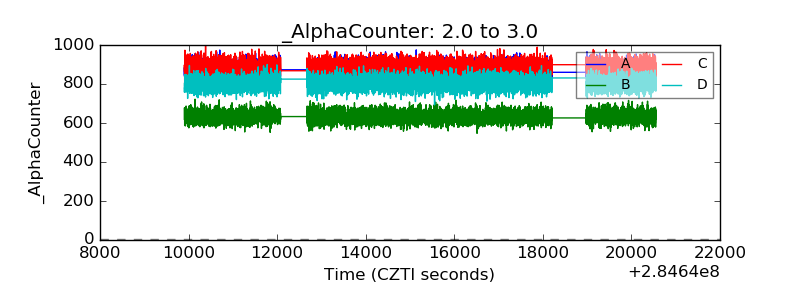 |
| _CPM_Rate | 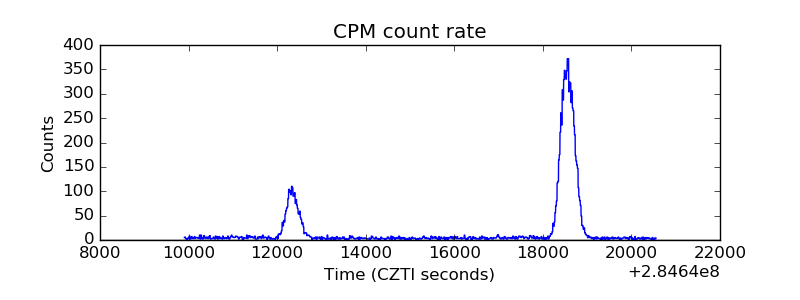 |
| CZT Counter | 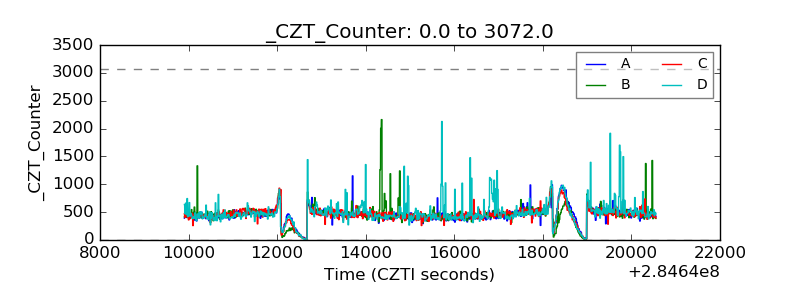 |
| +2.5 Volts monitor |  |
| +5 Volts monitor |  |
| _ROLL_ROT | 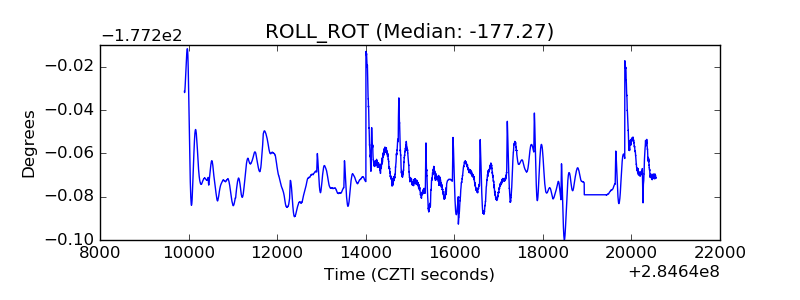 |
| _Roll_DEC | 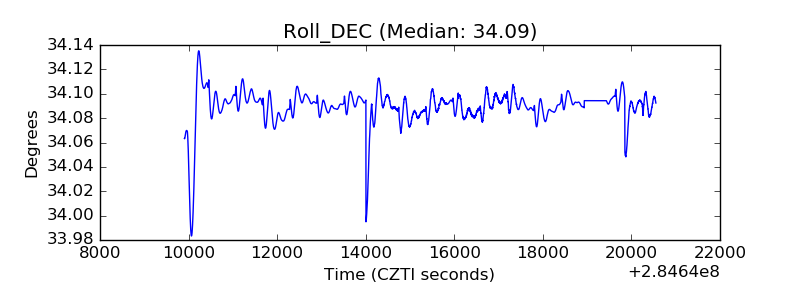 |
| _Roll_RA | 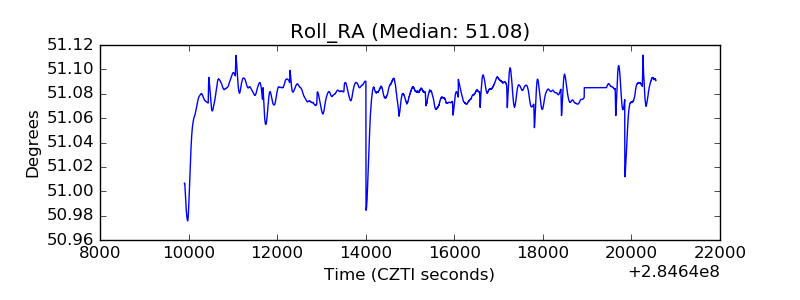 |
| Veto Counter | 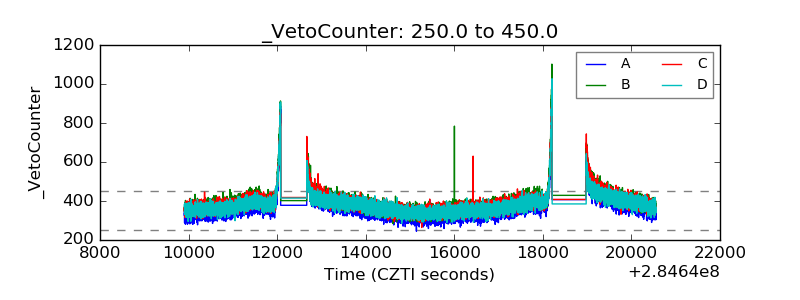 |