| Param | Original file | Final file |
|---|---|---|
| Filename | modeM0/AS1T03_070T02_9000002634_17740cztM0_level2.evt | modeM0/AS1T03_070T02_9000002634_17740cztM0_level2_quad_clean.evt |
| Size (bytes) | 128,946,240 | 36,293,760 |
| Size | 123.0 MB | 34.6 MB |
| Events in quadrant A | 872,848 | 243,055 |
| Events in quadrant B | 907,348 | 243,004 |
| Events in quadrant C | 882,075 | 234,883 |
| Events in quadrant D | 1,105,297 | 233,476 |
| Mode SS | |||
|---|---|---|---|
| Quadrant | BADHDUFLAG | Total packets | Discarded packets |
| A | 0 | 40 | 0 |
| B | 0 | 40 | 0 |
| C | 0 | 40 | 0 |
| D | 0 | 40 | 0 |
| Mode M0 | |||
|---|---|---|---|
| Quadrant | BADHDUFLAG | Total packets | Discarded packets |
| A | 0 | 3984 | 0 |
| B | 0 | 4044 | 0 |
| C | 0 | 3972 | 0 |
| D | 0 | 4558 | 0 |
| Quadrant | Total seconds | Saturated seconds | Saturation percentage |
|---|---|---|---|
| A | 1981 | 3 | 0.151439% |
| B | 1981 | 5 | 0.252398% |
| C | 1981 | 6 | 0.302877% |
| D | 1981 | 22 | 1.110550% |
Noise dominated data is calculated using 1-second bins in cleaned event files. If a bin has >2000 counts, and if more than 50% of those come from <1% of pixels, then it is considered to be noise-dominated and hence unusable.
| Quadrant | # 1 sec bins | Bins with >0 counts | Bins with >2000 counts | High rate bins dominated by noise | Noise dominated (total time) | Noise dominated (detector-on time) | Marked lightcurve |
|---|---|---|---|---|---|---|---|
| A | 1981 | 1981 | 0 | 0 | 0.00% | 0.00% | 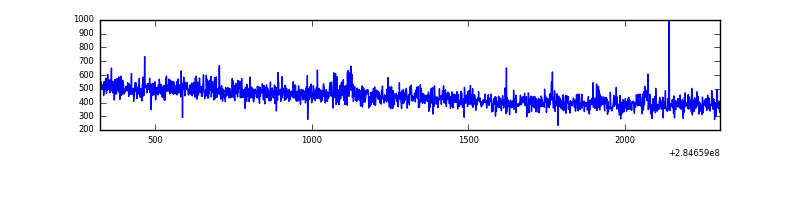 |
| B | 1981 | 1981 | 1 | 1 | 0.05% | 0.05% | 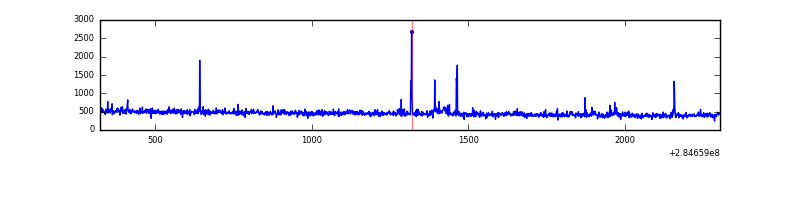 |
| C | 1981 | 1981 | 0 | 0 | 0.00% | 0.00% | 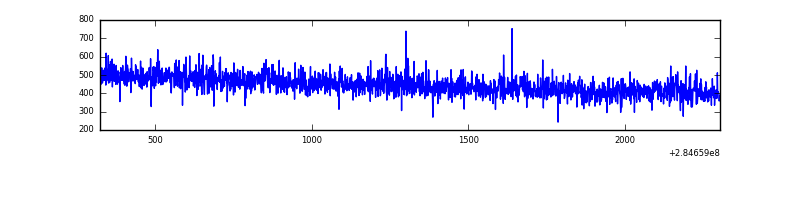 |
| D | 1981 | 1981 | 17 | 17 | 0.86% | 0.86% | 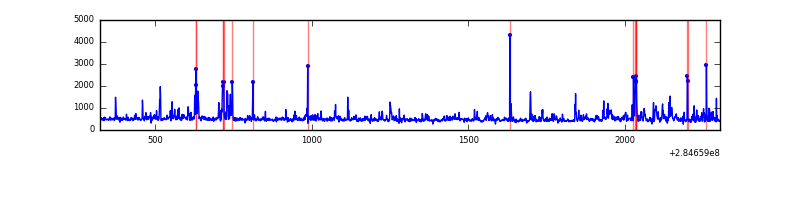 |
Top three noisy pixels from each quadrant. If the there are fewer than three noisy pixels in the level2.evt file, extra rows are filled as -1
| Pixel properties | Quadrant properties | ||||||
|---|---|---|---|---|---|---|---|
| Quadrant | DetID | PixID | Counts | Sigma | Mean | Median | Sigma |
| A | 15 | 174 | 4963 | 99.45 | 225 | 219 | 47.7 |
| A | 15 | 191 | 2146 | 40.4 | 225 | 219 | 47.7 |
| A | 0 | 226 | 1969 | 36.69 | 225 | 219 | 47.7 |
| B | 7 | 220 | 10050 | 223.65 | 221 | 215 | 44.0 |
| B | 6 | 36 | 7948 | 175.85 | 221 | 215 | 44.0 |
| B | 0 | 197 | 5203 | 113.43 | 221 | 215 | 44.0 |
| C | 14 | 238 | 32443 | 633.71 | 214 | 215 | 50.9 |
| C | 5 | 218 | 9015 | 173.04 | 214 | 215 | 50.9 |
| C | 13 | 61 | 1516 | 25.58 | 214 | 215 | 50.9 |
| D | 1 | 52 | 208530 | 3454.46 | 220 | 214 | 60.3 |
| D | 7 | 238 | 21674 | 355.87 | 220 | 214 | 60.3 |
| D | 15 | 145 | 12860 | 209.71 | 220 | 214 | 60.3 |
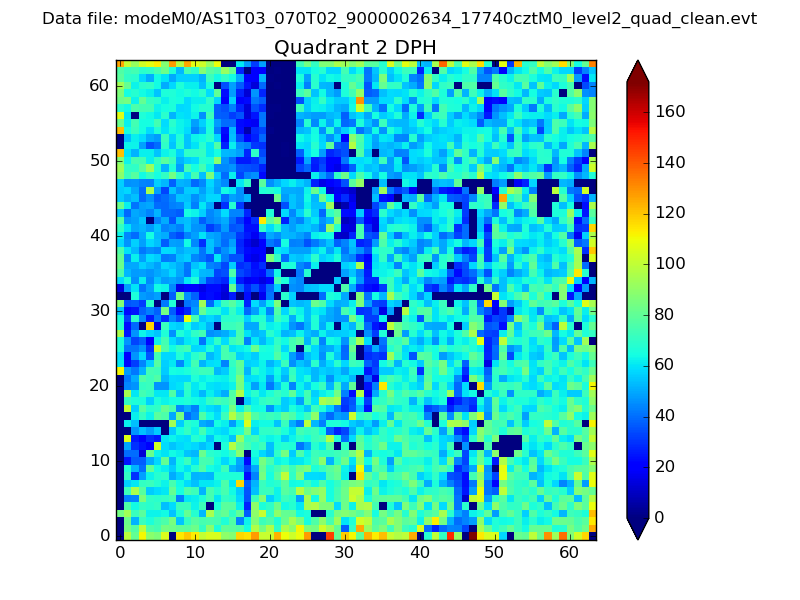
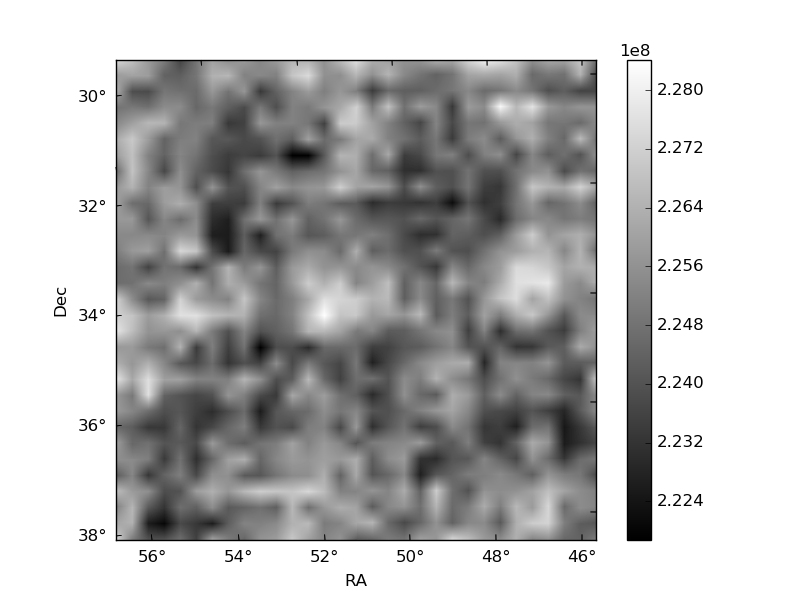
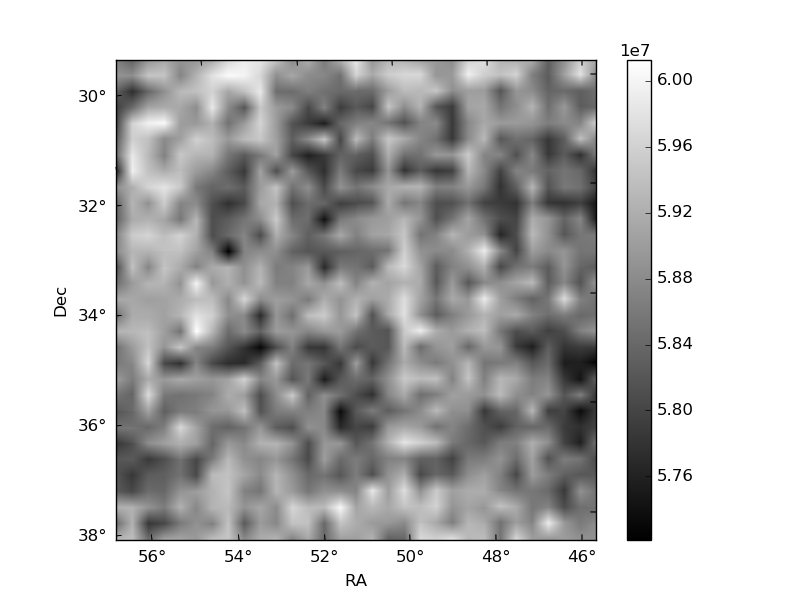
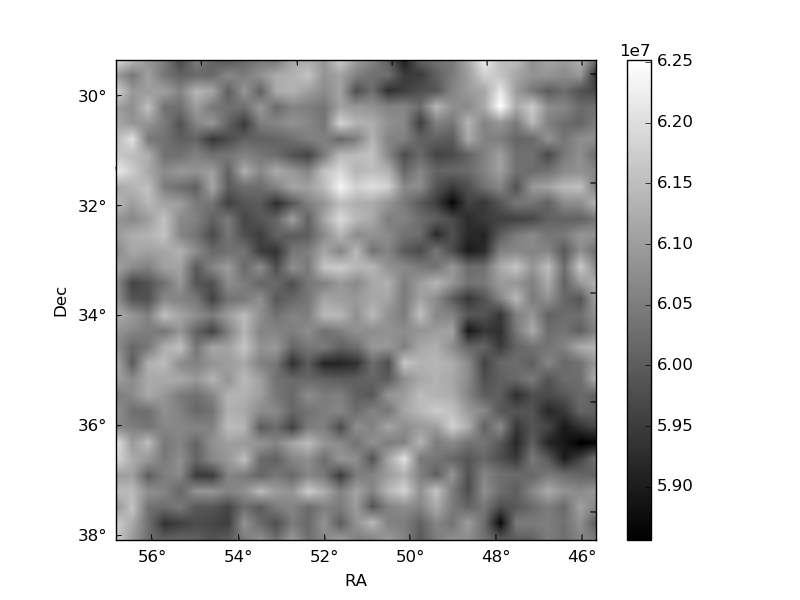
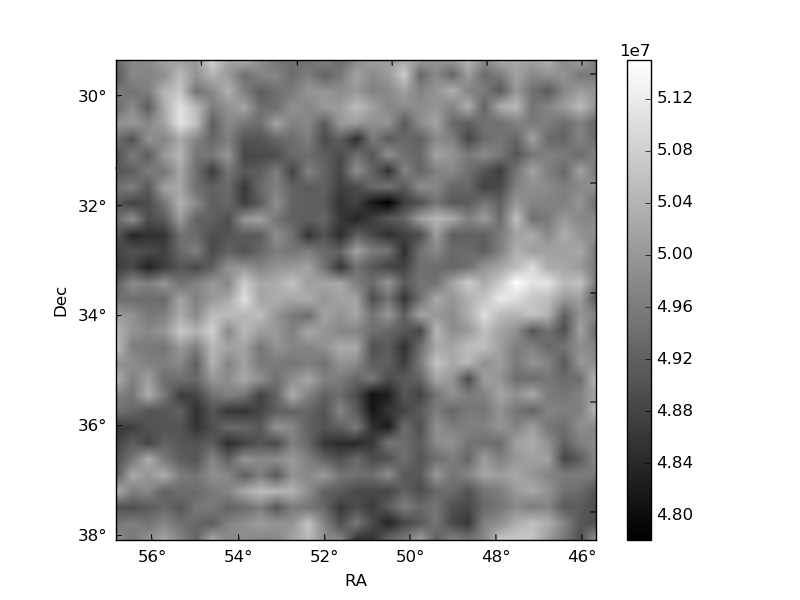
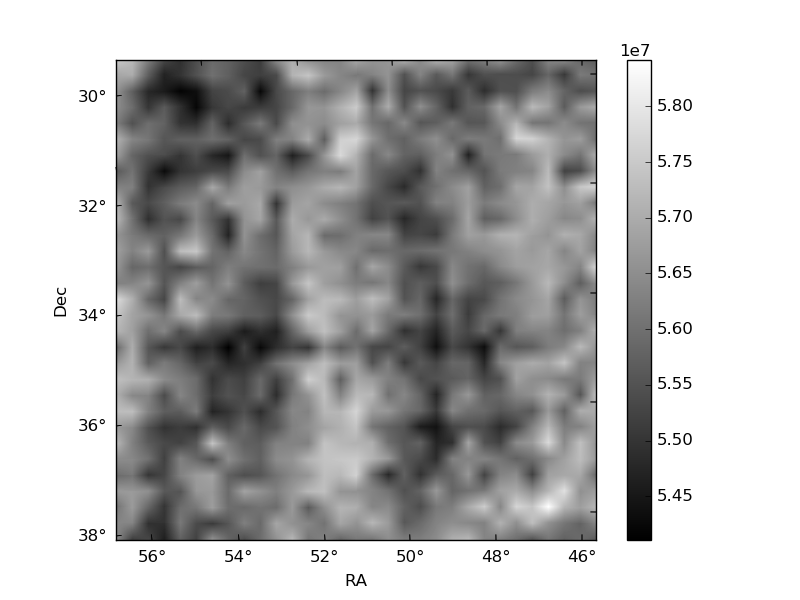
Histogram calculated using DETX and DETY for each event in the final _common_clean file
| Quadrant A | 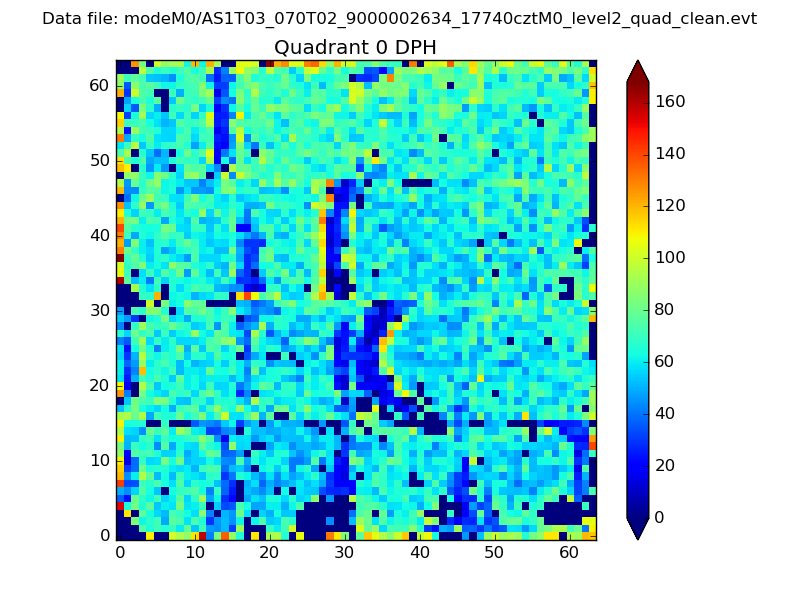 |
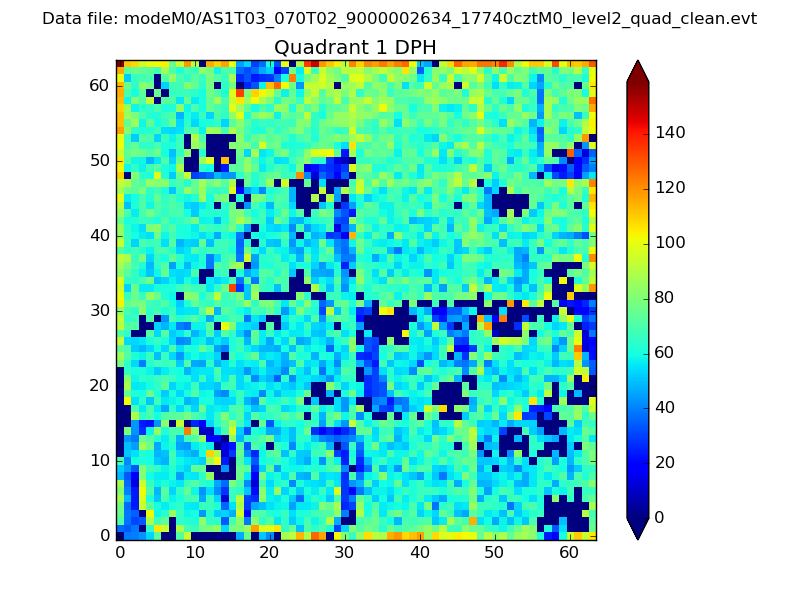 |
Quadrant B |
|---|---|---|---|
| Quadrant D | 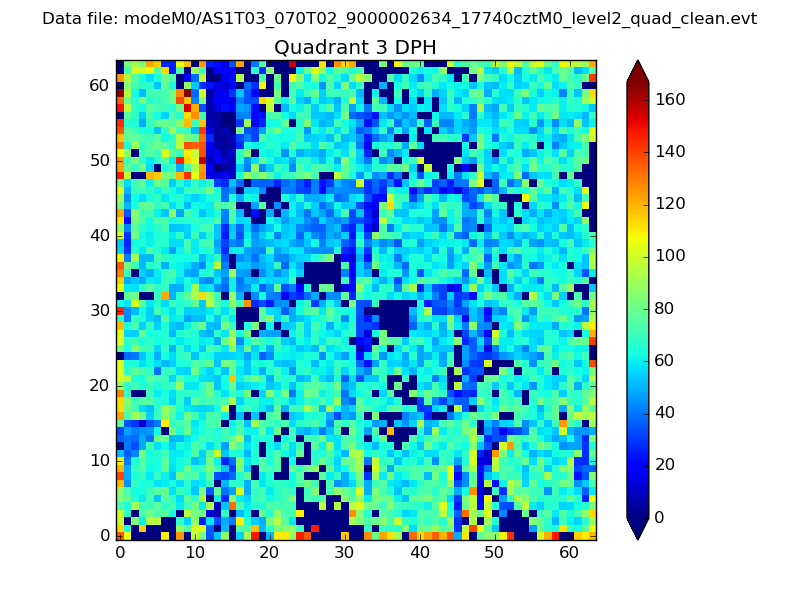 |
 |
Quadrant C |
| Plot type | Count rate plots | Images |
|---|---|---|
| Comparison with Poisson distribution Blue bars denote a histogram of data divided into 1 sec bins. Red curve is a Poisson curve with rate = median count rate of data. |
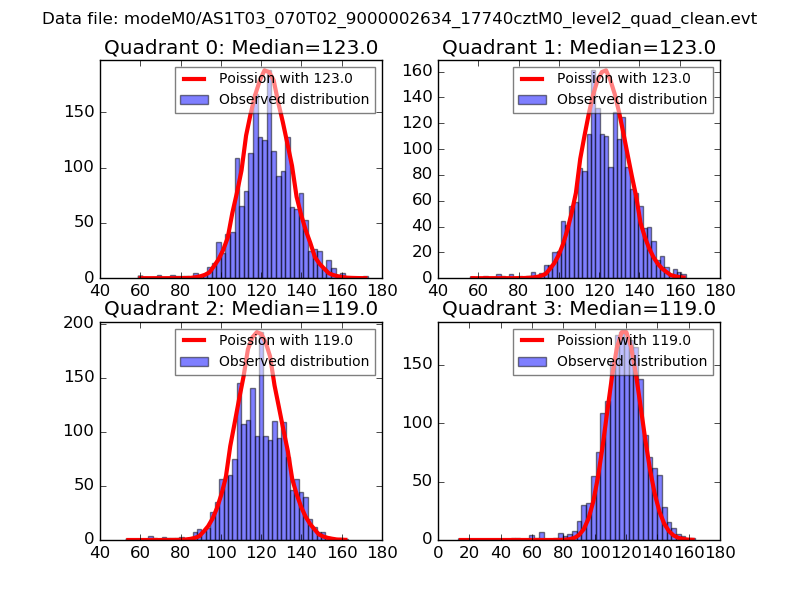 |
 |
| Quadrant-wise count rates Data is divided into 100 sec bins |
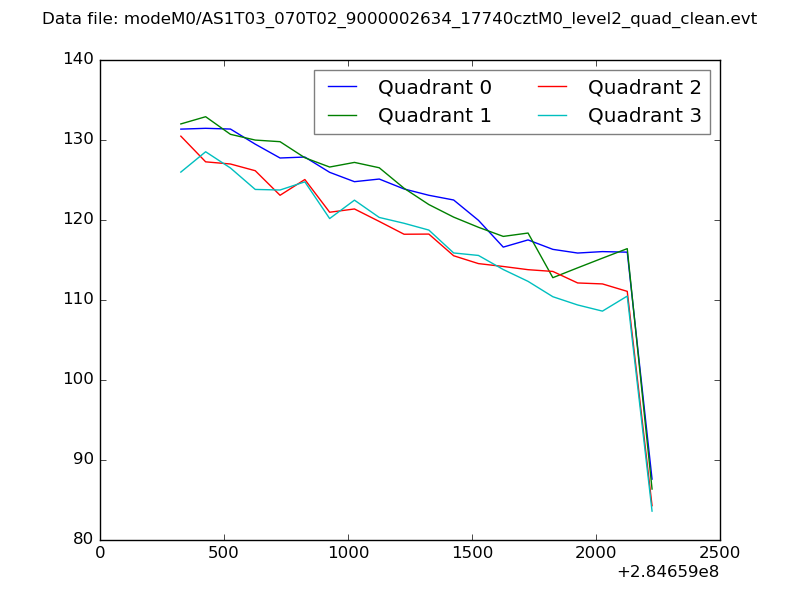 |
|
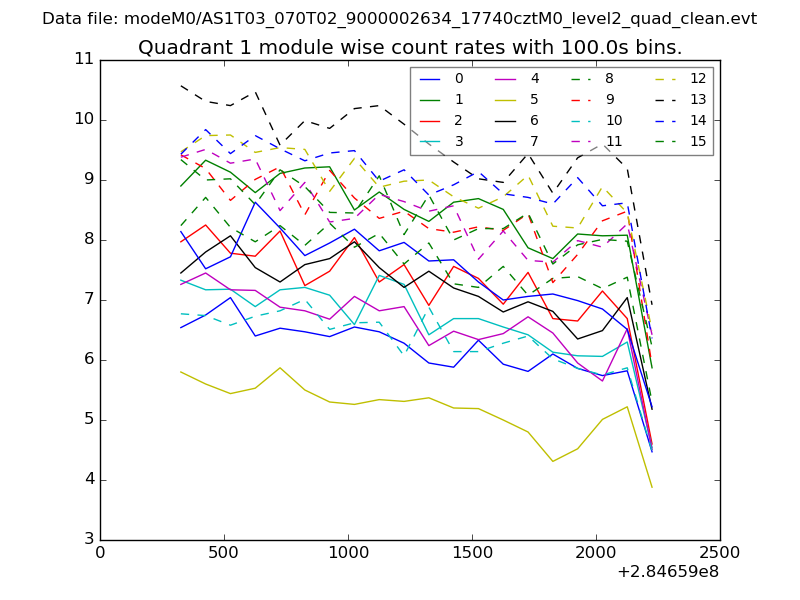
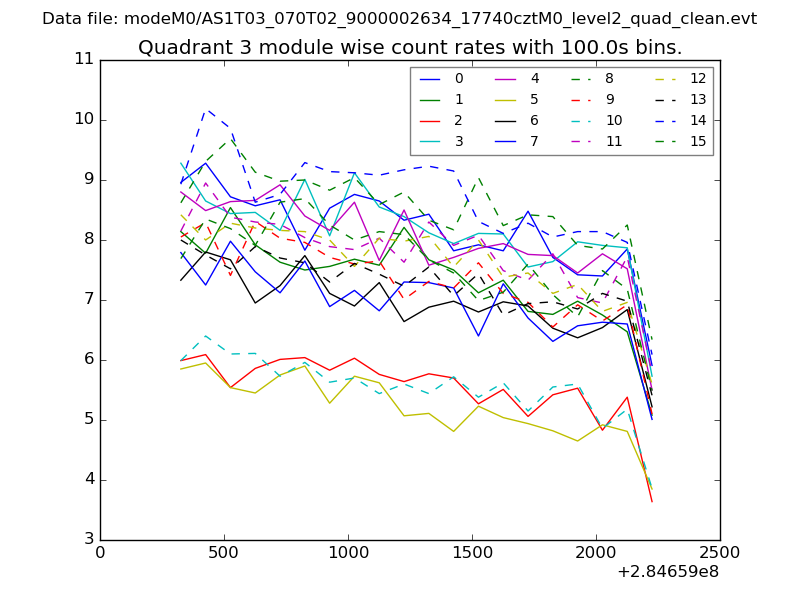
| Module-wise count rates for Quadrant A Data is divided into 100 sec bins |
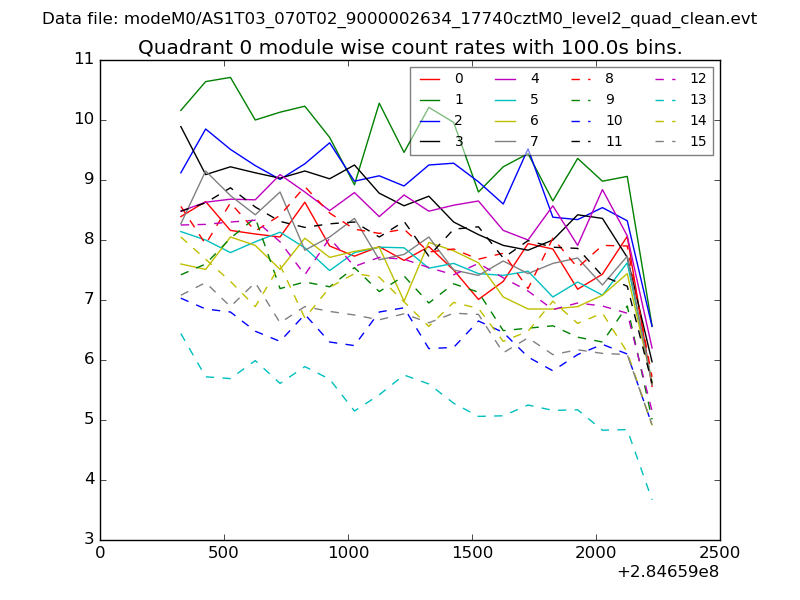 |
 |
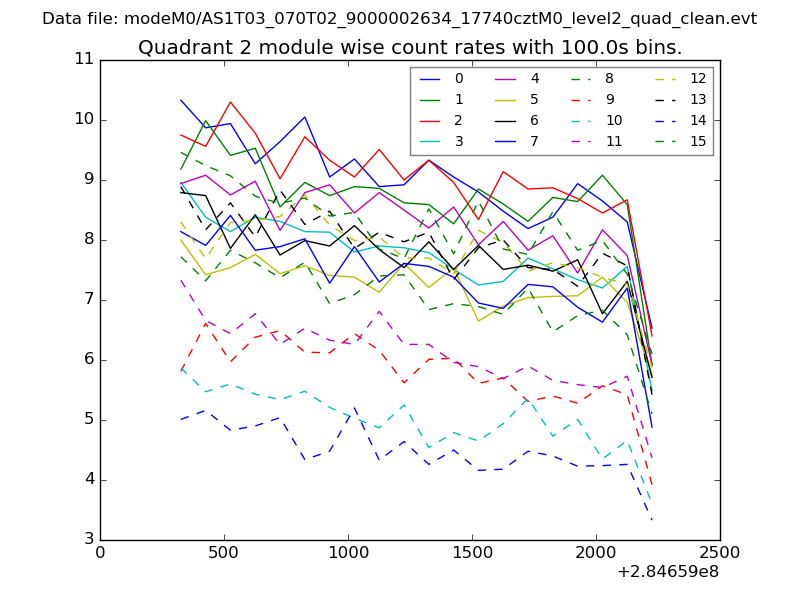
| Module-wise count rates for Quadrant B Data is divided into 100 sec bins |
 |
 |
| Module-wise count rates for Quadrant C Data is divided into 100 sec bins |
 |
 |
| Module-wise count rates for Quadrant D Data is divided into 100 sec bins |
 |
 |
| Parameter | Plot |
|---|---|
| CZT HV Monitor | 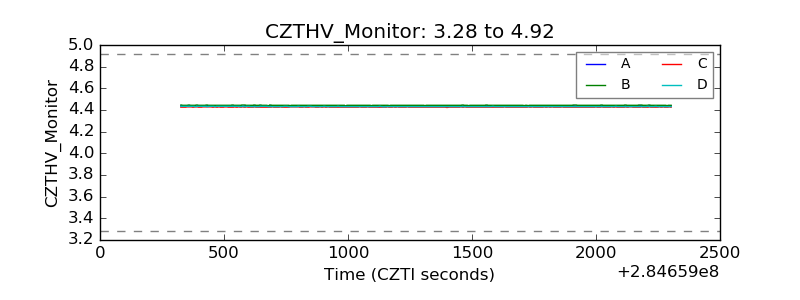 |
| D_VDD |  |
| Temperature 1 |  |
| Veto HV Monitor | 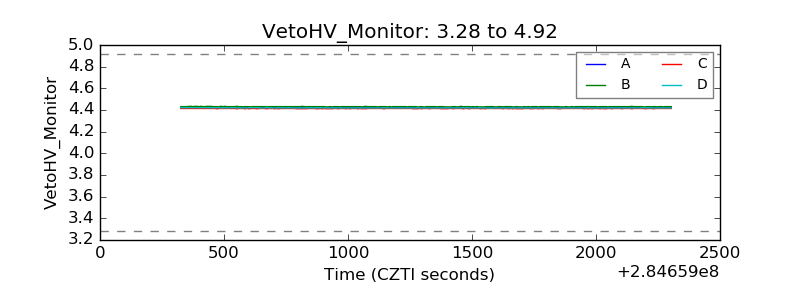 |
| Veto LLD | 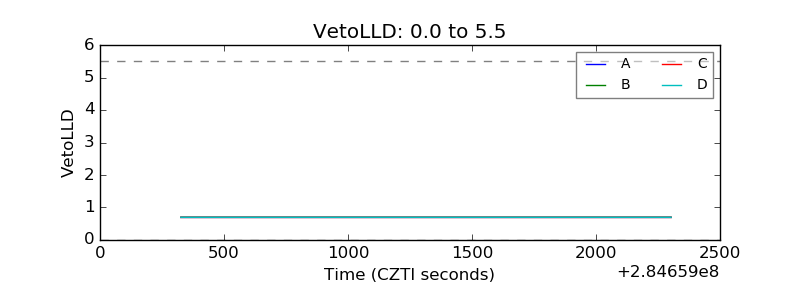 |
| Alpha Counter | 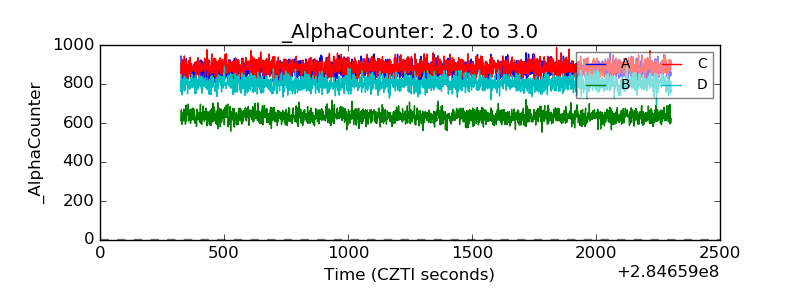 |
| _CPM_Rate | 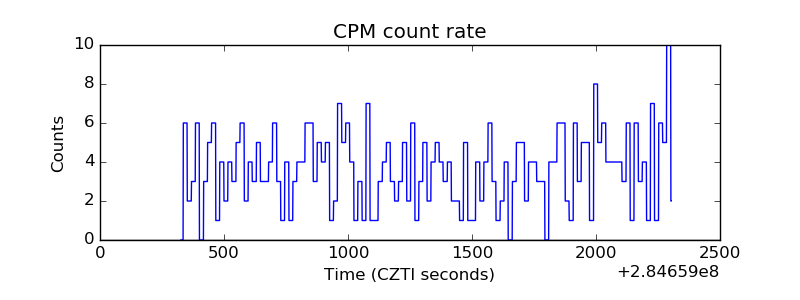 |
| CZT Counter | 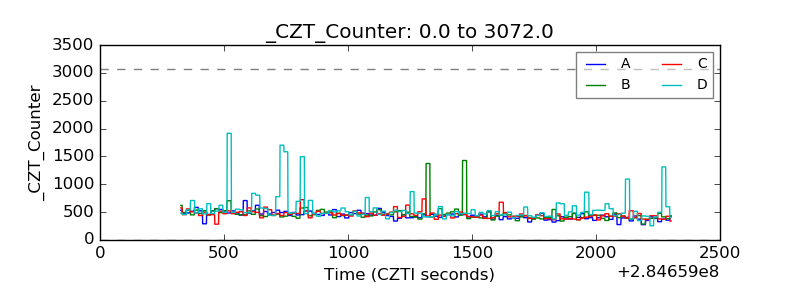 |
| +2.5 Volts monitor | 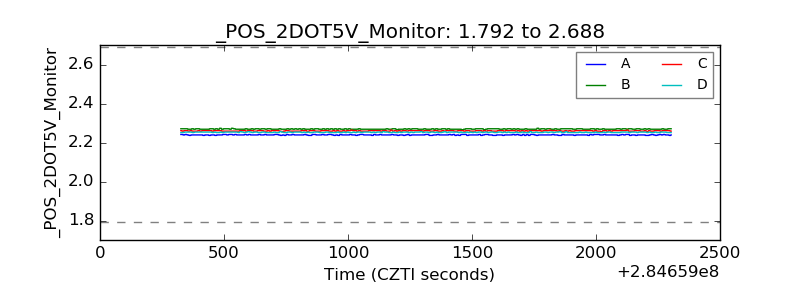 |
| +5 Volts monitor |  |
| _ROLL_ROT | 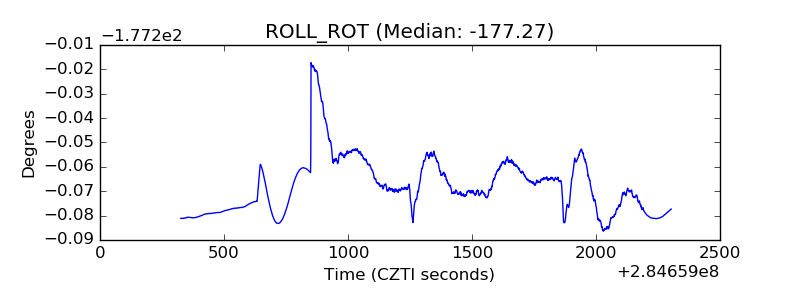 |
| _Roll_DEC | 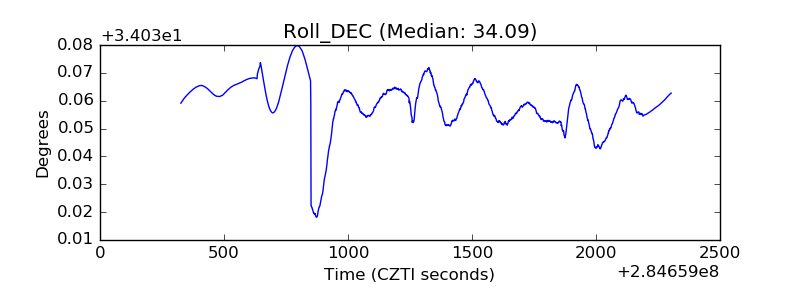 |
| _Roll_RA | 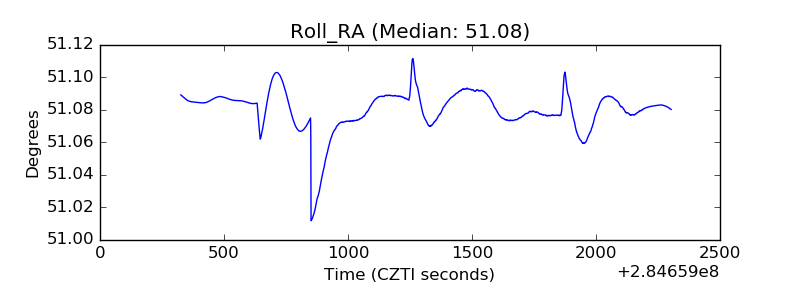 |
| Veto Counter | 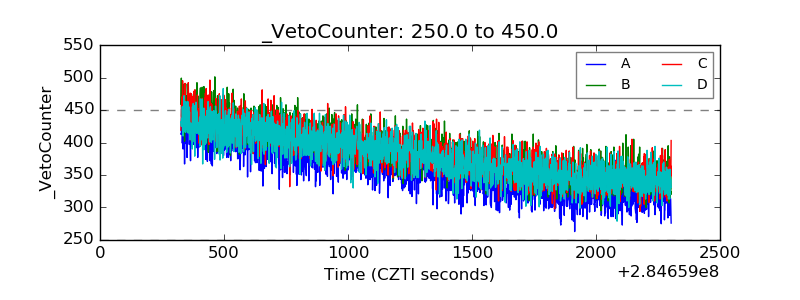 |