| Param | Original file | Final file |
|---|---|---|
| Filename | modeM0/AS1T03_070T03_9000002636cztM0_level2.fits | modeM0/AS1T03_070T03_9000002636cztM0_level2_quad_clean.evt |
| Size (bytes) | 88,856,640 | 58,394,880 |
| Size | 84.7 MB | 55.7 MB |
| Events in quadrant A | 544,198 | 293,803 |
| Events in quadrant B | 510,148 | 291,399 |
| Events in quadrant C | 524,430 | 275,995 |
| Events in quadrant D | 462,760 | 256,569 |
| Mode SS | |||
|---|---|---|---|
| Quadrant | BADHDUFLAG | Total packets | Discarded packets |
| A | 0 | 192 | 0 |
| B | 0 | 192 | 0 |
| C | 0 | 192 | 0 |
| D | 0 | 192 | 0 |
| Mode M9 | |||
|---|---|---|---|
| Quadrant | BADHDUFLAG | Total packets | Discarded packets |
| A | 0 | 20 | 0 |
| B | 0 | 20 | 0 |
| C | 0 | 20 | 0 |
| D | 0 | 20 | 0 |
| Mode M0 | |||
|---|---|---|---|
| Quadrant | BADHDUFLAG | Total packets | Discarded packets |
| A | 0 | 19335 | 0 |
| B | 0 | 21286 | 0 |
| C | 0 | 19435 | 0 |
| D | 0 | 20416 | 0 |
| Quadrant | Total seconds | Saturated seconds | Saturation percentage |
|---|---|---|---|
| A | 9364 | 68 | 0.726185% |
| B | 9364 | 331 | 3.534814% |
| C | 9364 | 108 | 1.153353% |
| D | 9364 | 119 | 1.270824% |
Noise dominated data is calculated using 1-second bins in cleaned event files. If a bin has >2000 counts, and if more than 50% of those come from <1% of pixels, then it is considered to be noise-dominated and hence unusable.
| Quadrant | # 1 sec bins | Bins with >0 counts | Bins with >2000 counts | High rate bins dominated by noise | Noise dominated (total time) | Noise dominated (detector-on time) | Marked lightcurve |
|---|---|---|---|---|---|---|---|
| A | 11374 | 9363 | 0 | 0 | 0.00% | 0.00% | 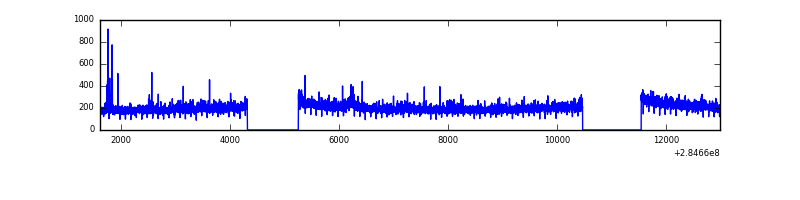 |
| B | 11374 | 9341 | 0 | 0 | 0.00% | 0.00% |  |
| C | 11374 | 9362 | 0 | 0 | 0.00% | 0.00% |  |
| D | 11374 | 9363 | 0 | 0 | 0.00% | 0.00% | 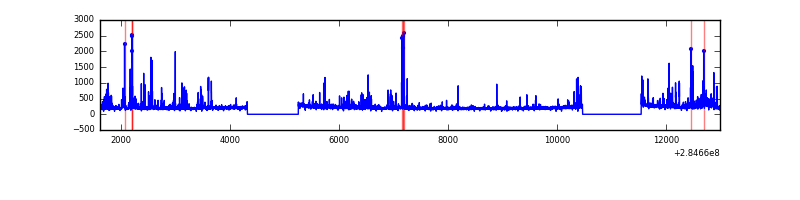 |
Top three noisy pixels from each quadrant. If the there are fewer than three noisy pixels in the level2.evt file, extra rows are filled as -1
| Pixel properties | Quadrant properties | ||||||
|---|---|---|---|---|---|---|---|
| Quadrant | DetID | PixID | Counts | Sigma | Mean | Median | Sigma |
| A | 0 | 29 | 484 | 9.34 | 141 | 132 | 37.7 |
| A | 9 | 19 | 458 | 8.65 | 141 | 132 | 37.7 |
| A | 7 | 110 | 449 | 8.41 | 141 | 132 | 37.7 |
| B | 2 | 9 | 454 | 11.12 | 134 | 128 | 29.3 |
| B | 2 | 8 | 359 | 7.88 | 134 | 128 | 29.3 |
| B | 5 | 232 | 346 | 7.44 | 134 | 128 | 29.3 |
| C | 12 | 241 | 373 | 6.6 | 138 | 130 | 36.8 |
| C | 3 | 158 | 367 | 6.43 | 138 | 130 | 36.8 |
| C | 9 | 233 | 363 | 6.32 | 138 | 130 | 36.8 |
| D | 6 | 231 | 366 | 6.66 | 131 | 120 | 36.9 |
| D | 6 | 67 | 340 | 5.96 | 131 | 120 | 36.9 |
| D | 7 | 3 | 330 | 5.69 | 131 | 120 | 36.9 |
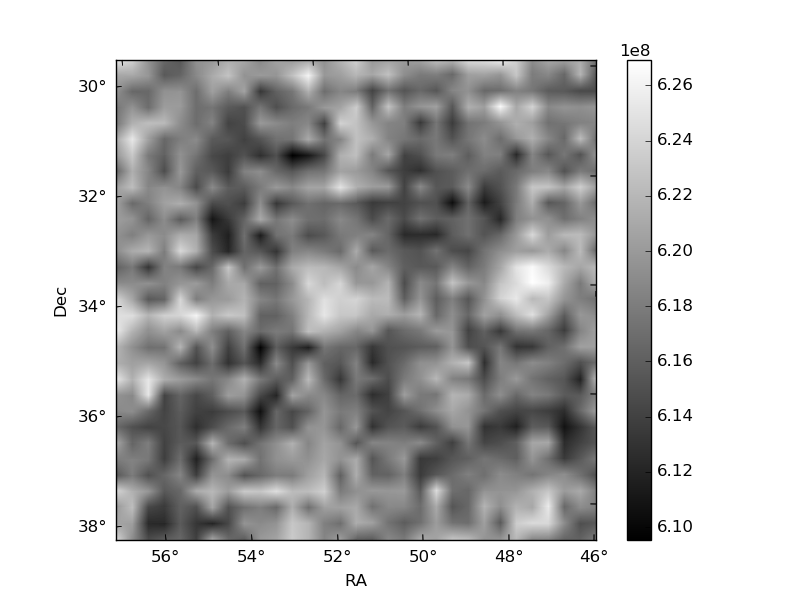
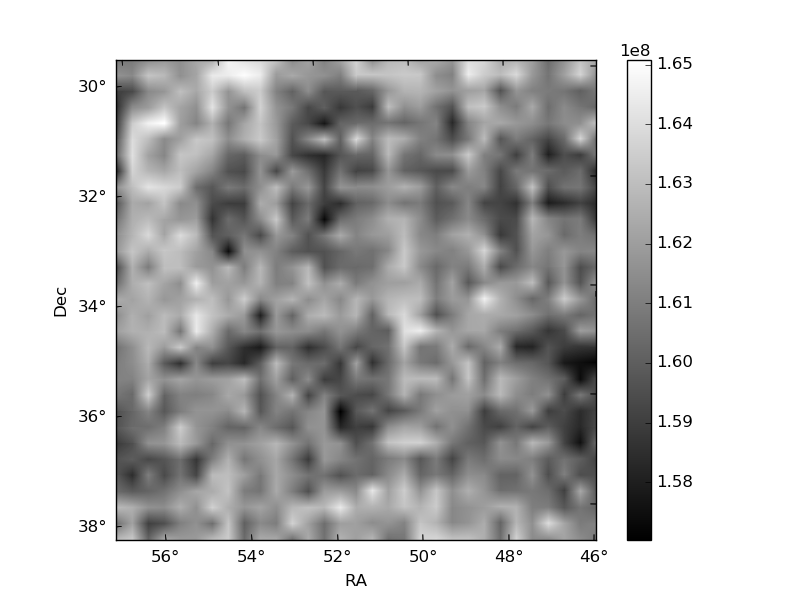
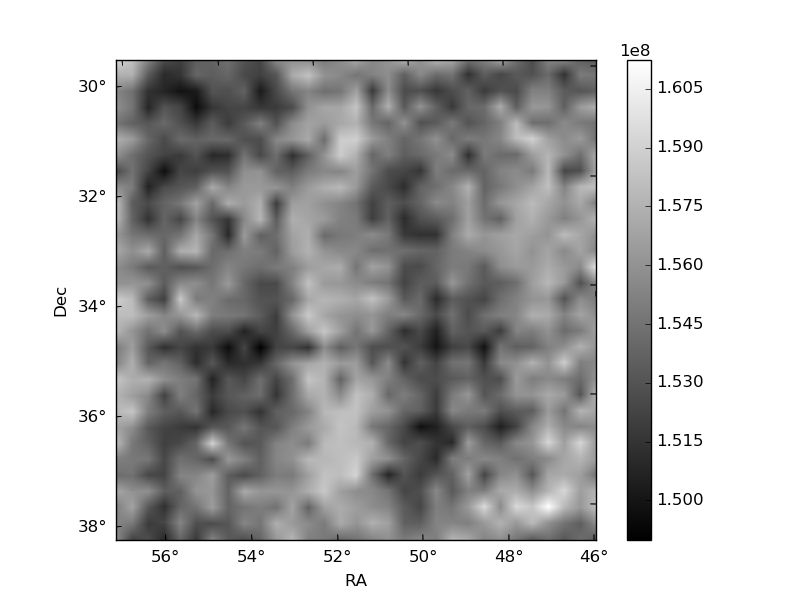
Histogram calculated using DETX and DETY for each event in the final _common_clean file
| Quadrant A |  |
 |
Quadrant B |
|---|---|---|---|
| Quadrant D |  |
 |
Quadrant C |
| Plot type | Count rate plots | Images |
|---|---|---|
| Comparison with Poisson distribution Blue bars denote a histogram of data divided into 1 sec bins. Red curve is a Poisson curve with rate = median count rate of data. |
 |
 |
| Quadrant-wise count rates Data is divided into 100 sec bins |
 |
|
| Module-wise count rates for Quadrant A Data is divided into 100 sec bins |
 |
 |
| Module-wise count rates for Quadrant B Data is divided into 100 sec bins |
 |
 |
| Module-wise count rates for Quadrant C Data is divided into 100 sec bins |
 |
 |
| Module-wise count rates for Quadrant D Data is divided into 100 sec bins |
 |
 |
| Parameter | Plot |
|---|---|
| CZT HV Monitor | 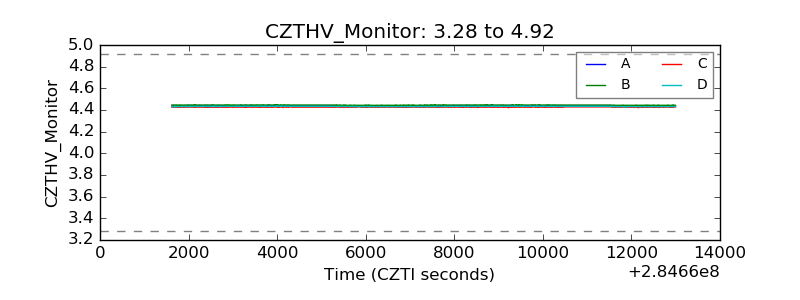 |
| D_VDD |  |
| Temperature 1 | 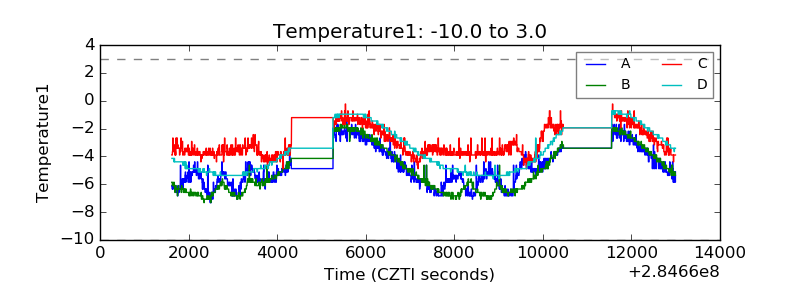 |
| Veto HV Monitor |  |
| Veto LLD |  |
| Alpha Counter |  |
| _CPM_Rate |  |
| CZT Counter |  |
| +2.5 Volts monitor |  |
| +5 Volts monitor | 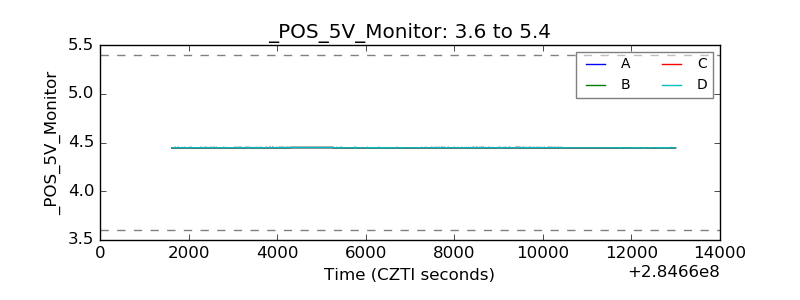 |
| _ROLL_ROT |  |
| _Roll_DEC | 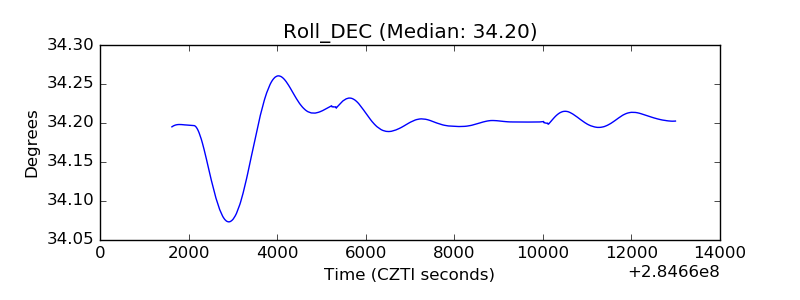 |
| _Roll_RA |  |
| Veto Counter |  |