| Param | Original file | Final file |
|---|---|---|
| Filename | modeM0/AS1T03_070T03_9000002636_17740cztM0_level2.evt | modeM0/AS1T03_070T03_9000002636_17740cztM0_level2_quad_clean.evt |
| Size (bytes) | 268,896,960 | 42,744,960 |
| Size | 256.4 MB | 40.8 MB |
| Events in quadrant A | 1,917,339 | 256,875 |
| Events in quadrant B | 1,946,872 | 258,667 |
| Events in quadrant C | 1,959,710 | 246,922 |
| Events in quadrant D | 2,044,292 | 247,310 |
| Mode SS | |||
|---|---|---|---|
| Quadrant | BADHDUFLAG | Total packets | Discarded packets |
| A | 0 | 82 | 0 |
| B | 0 | 82 | 0 |
| C | 0 | 82 | 0 |
| D | 0 | 82 | 0 |
| Mode M9 | |||
|---|---|---|---|
| Quadrant | BADHDUFLAG | Total packets | Discarded packets |
| A | 0 | 9 | 0 |
| B | 0 | 9 | 0 |
| C | 0 | 9 | 0 |
| D | 0 | 9 | 0 |
| Mode M0 | |||
|---|---|---|---|
| Quadrant | BADHDUFLAG | Total packets | Discarded packets |
| A | 0 | 8362 | 1 |
| B | 0 | 8393 | 1 |
| C | 0 | 8346 | 1 |
| D | 0 | 8805 | 1 |
| Quadrant | Total seconds | Saturated seconds | Saturation percentage |
|---|---|---|---|
| A | 4029 | 33 | 0.819062% |
| B | 4029 | 46 | 1.141723% |
| C | 4029 | 44 | 1.092082% |
| D | 4029 | 44 | 1.092082% |
Noise dominated data is calculated using 1-second bins in cleaned event files. If a bin has >2000 counts, and if more than 50% of those come from <1% of pixels, then it is considered to be noise-dominated and hence unusable.
| Quadrant | # 1 sec bins | Bins with >0 counts | Bins with >2000 counts | High rate bins dominated by noise | Noise dominated (total time) | Noise dominated (detector-on time) | Marked lightcurve |
|---|---|---|---|---|---|---|---|
| A | 4964 | 4029 | 2 | 2 | 0.04% | 0.05% | 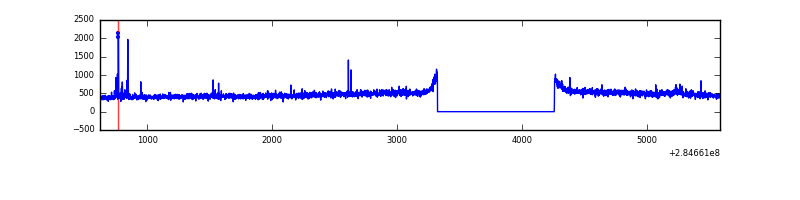 |
| B | 4964 | 4030 | 3 | 3 | 0.06% | 0.07% | 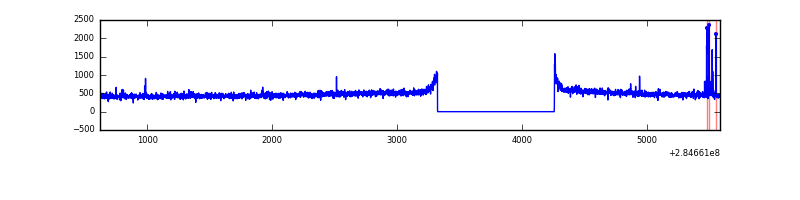 |
| C | 4964 | 4030 | 0 | 0 | 0.00% | 0.00% | 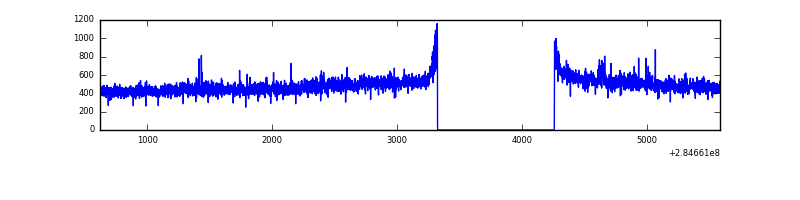 |
| D | 4964 | 4030 | 15 | 15 | 0.30% | 0.37% | 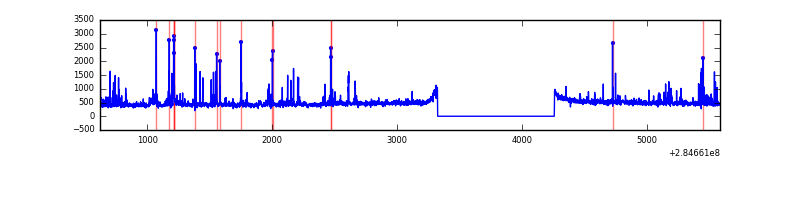 |
Top three noisy pixels from each quadrant. If the there are fewer than three noisy pixels in the level2.evt file, extra rows are filled as -1
| Pixel properties | Quadrant properties | ||||||
|---|---|---|---|---|---|---|---|
| Quadrant | DetID | PixID | Counts | Sigma | Mean | Median | Sigma |
| A | 15 | 174 | 23881 | 233.19 | 486 | 475 | 100.4 |
| A | 15 | 191 | 22371 | 218.14 | 486 | 475 | 100.4 |
| A | 0 | 226 | 4246 | 37.57 | 486 | 475 | 100.4 |
| B | 0 | 197 | 22315 | 226.75 | 487 | 474 | 96.3 |
| B | 12 | 111 | 11336 | 112.77 | 487 | 474 | 96.3 |
| B | 11 | 111 | 9867 | 97.51 | 487 | 474 | 96.3 |
| C | 14 | 238 | 71013 | 628.91 | 470 | 474 | 112.2 |
| C | 5 | 218 | 39707 | 349.79 | 470 | 474 | 112.2 |
| C | 9 | 160 | 5355 | 43.52 | 470 | 474 | 112.2 |
| D | 1 | 52 | 209215 | 1769.93 | 475 | 460 | 117.9 |
| D | 2 | 234 | 17373 | 143.4 | 475 | 460 | 117.9 |
| D | 7 | 238 | 11598 | 94.43 | 475 | 460 | 117.9 |
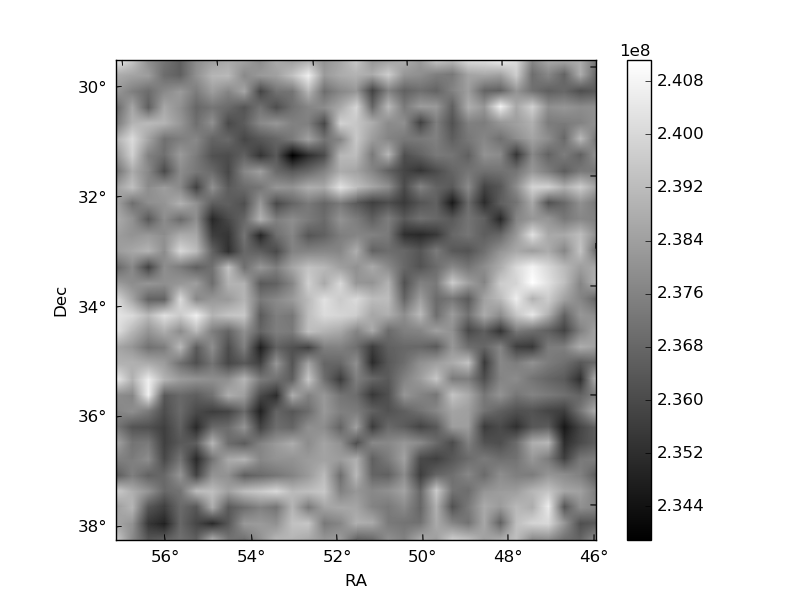
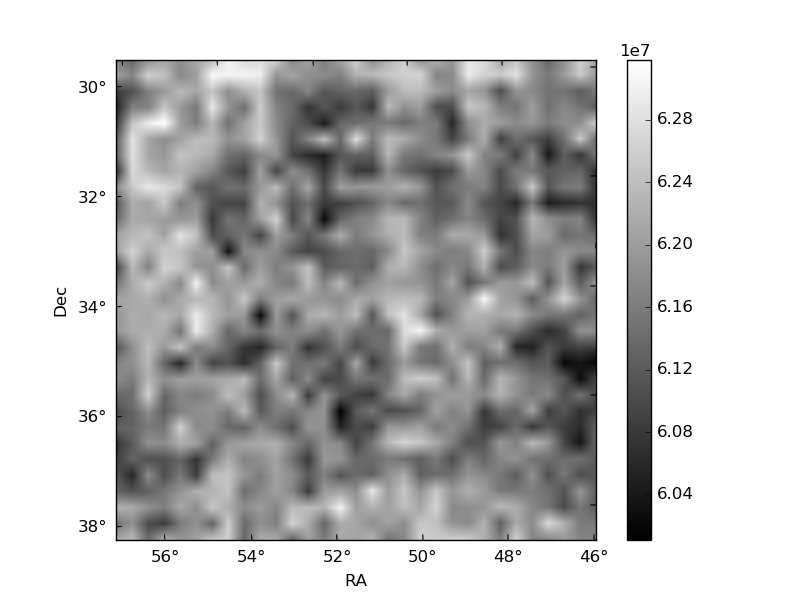
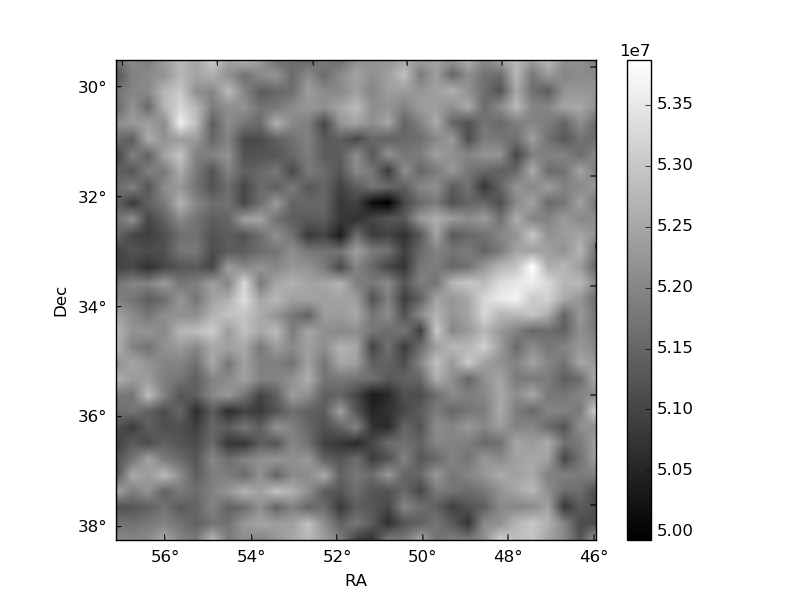
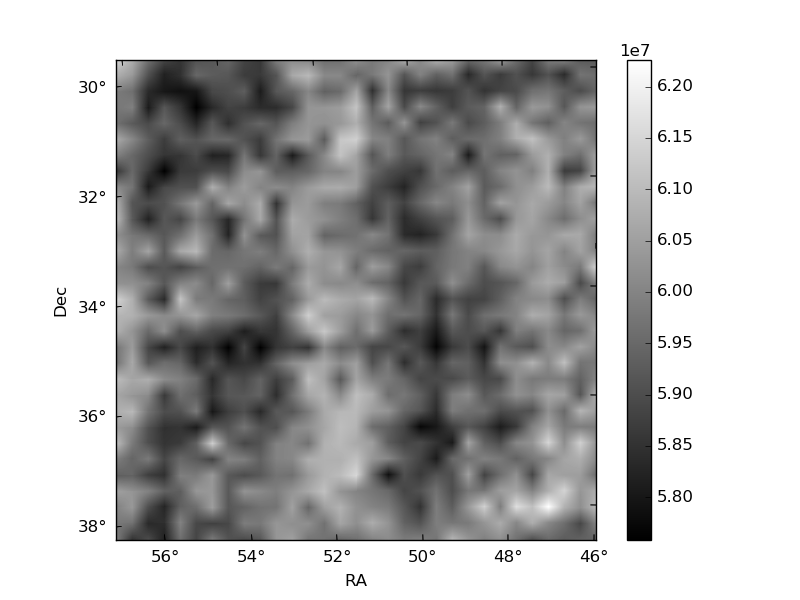
Histogram calculated using DETX and DETY for each event in the final _common_clean file
| Quadrant A | 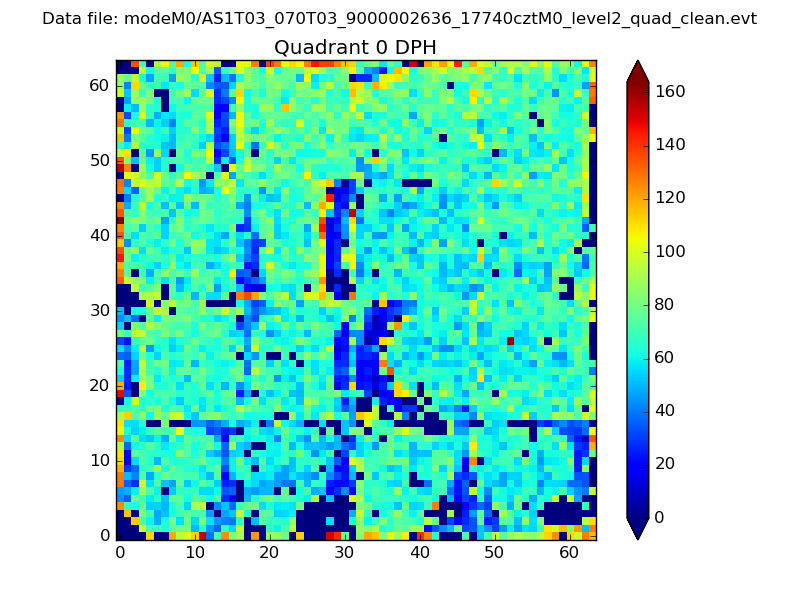 |
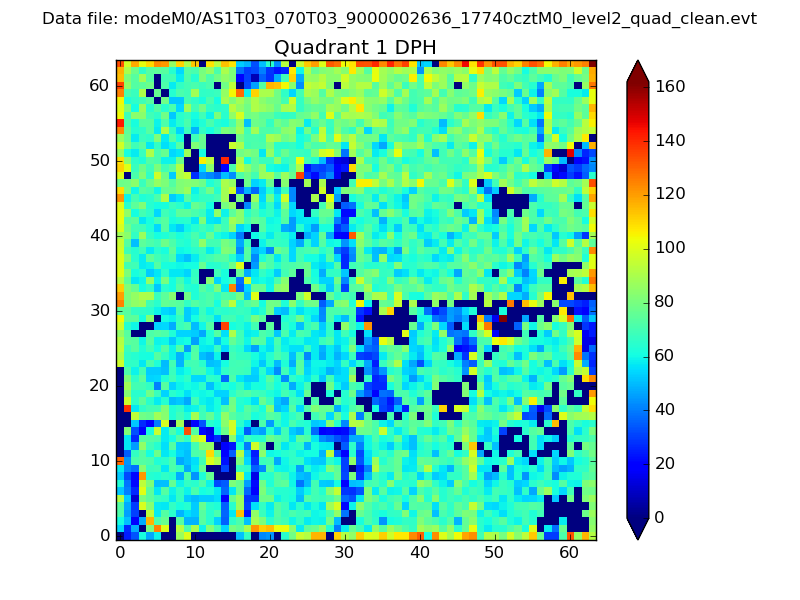 |
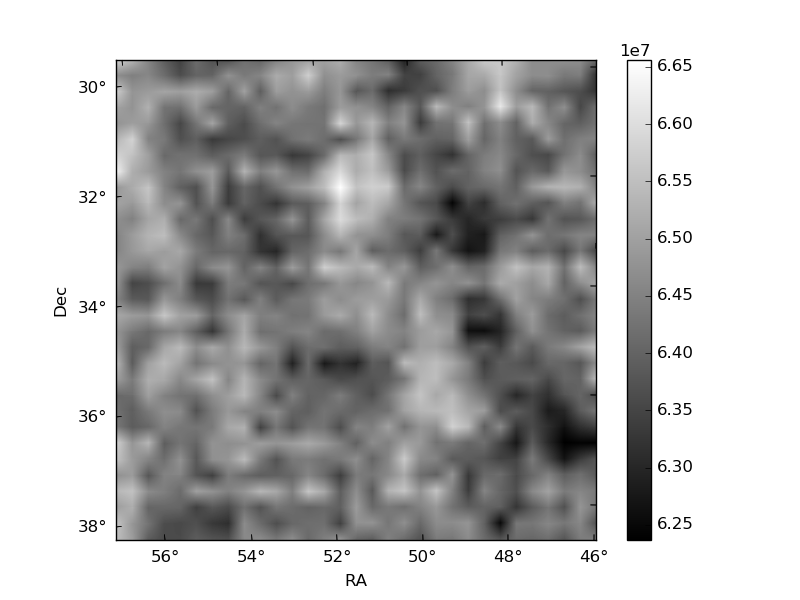
Quadrant B |
|---|---|---|---|
| Quadrant D | 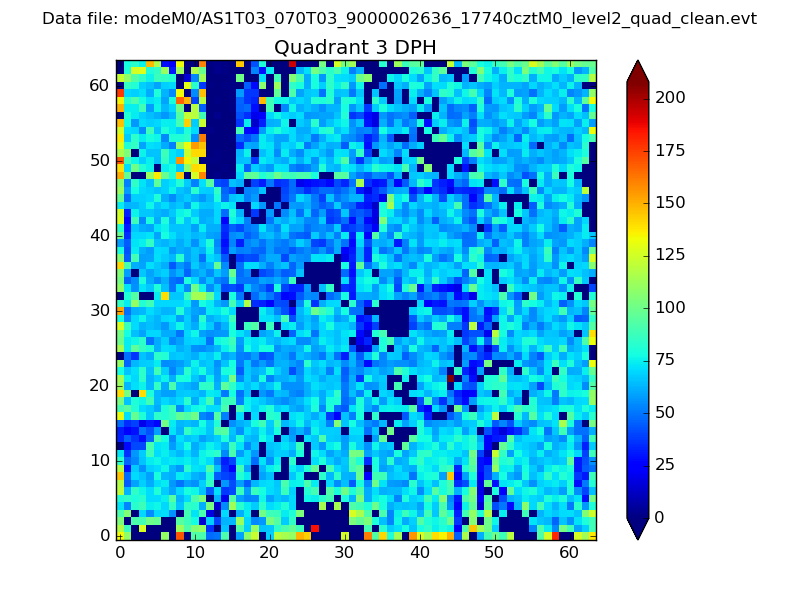 |
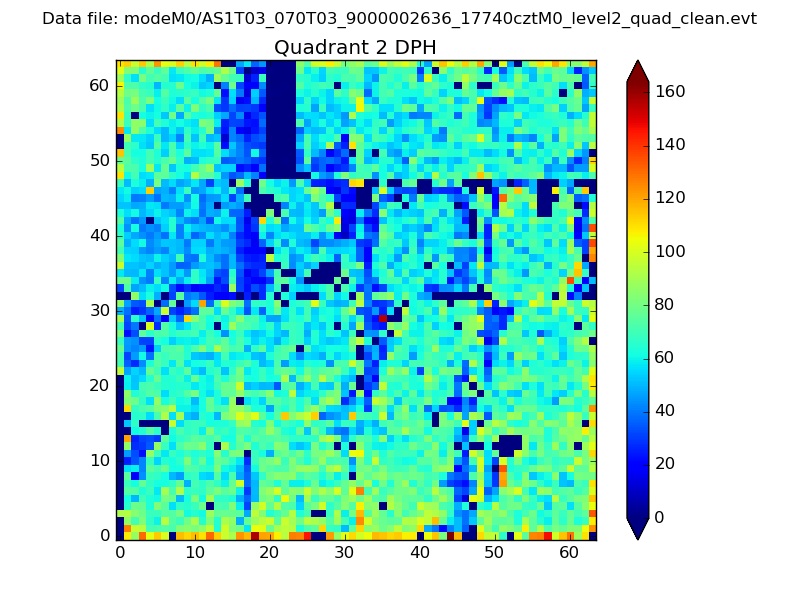 |
Quadrant C |
| Plot type | Count rate plots | Images |
|---|---|---|
| Comparison with Poisson distribution Blue bars denote a histogram of data divided into 1 sec bins. Red curve is a Poisson curve with rate = median count rate of data. |
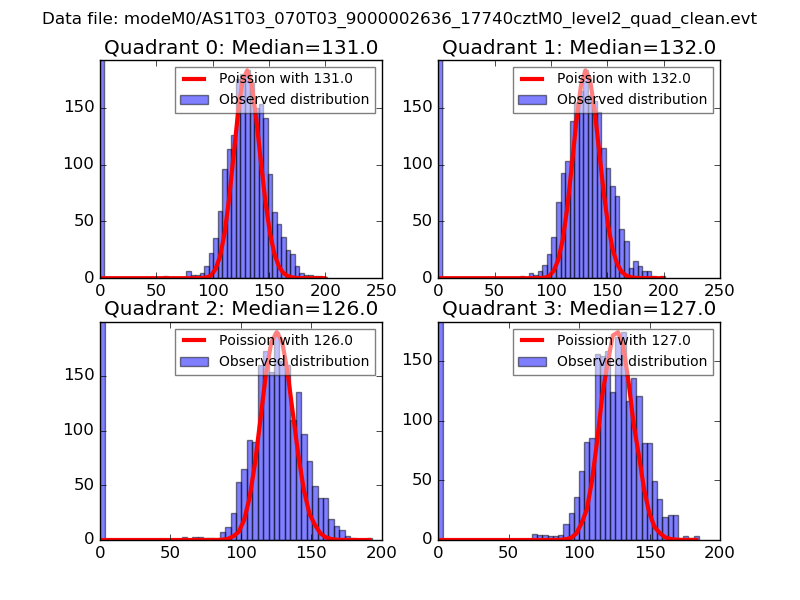 |
 |
| Quadrant-wise count rates Data is divided into 100 sec bins |
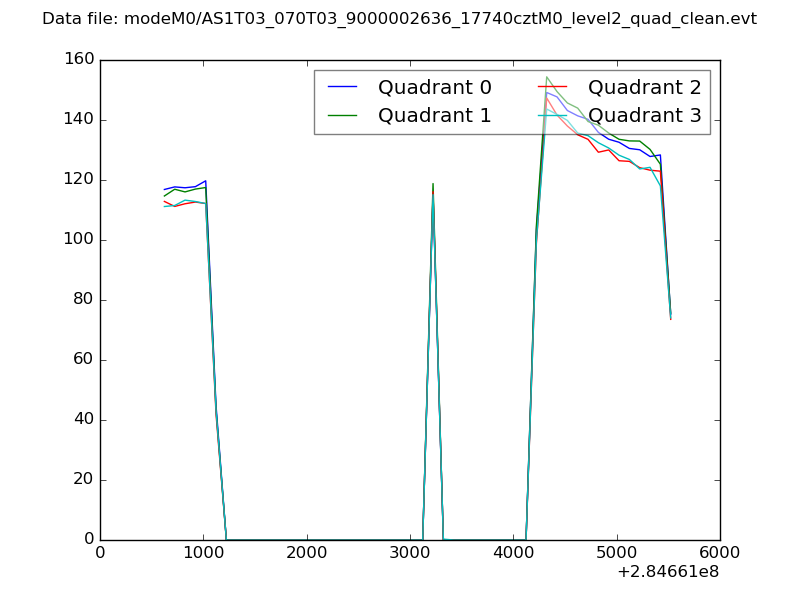 |
|
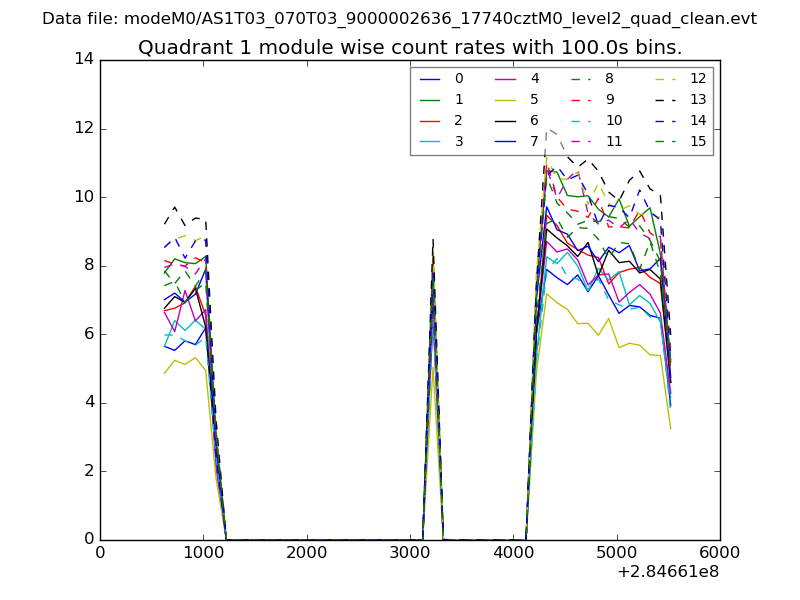
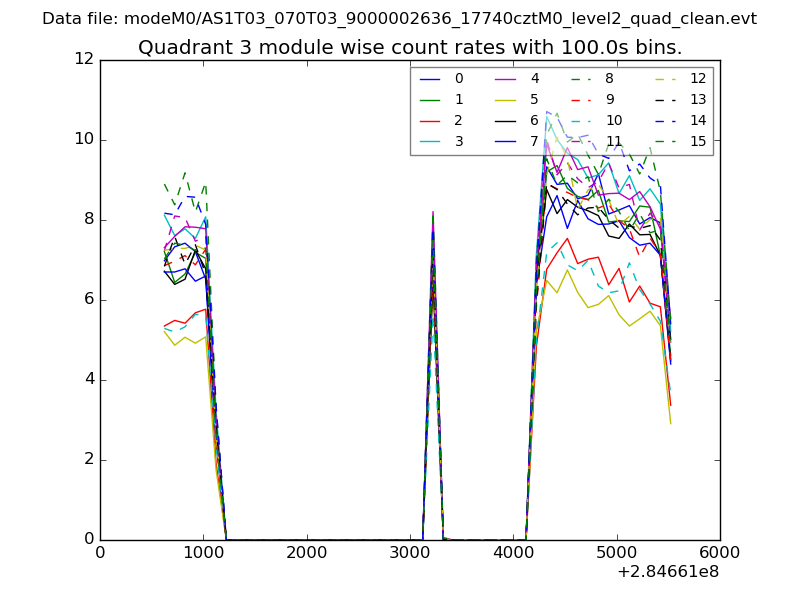
| Module-wise count rates for Quadrant A Data is divided into 100 sec bins |
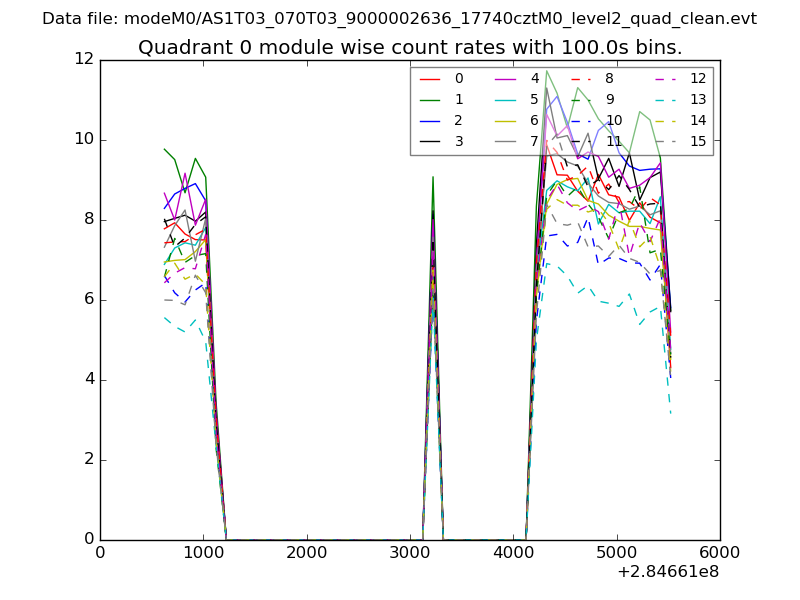 |
 |
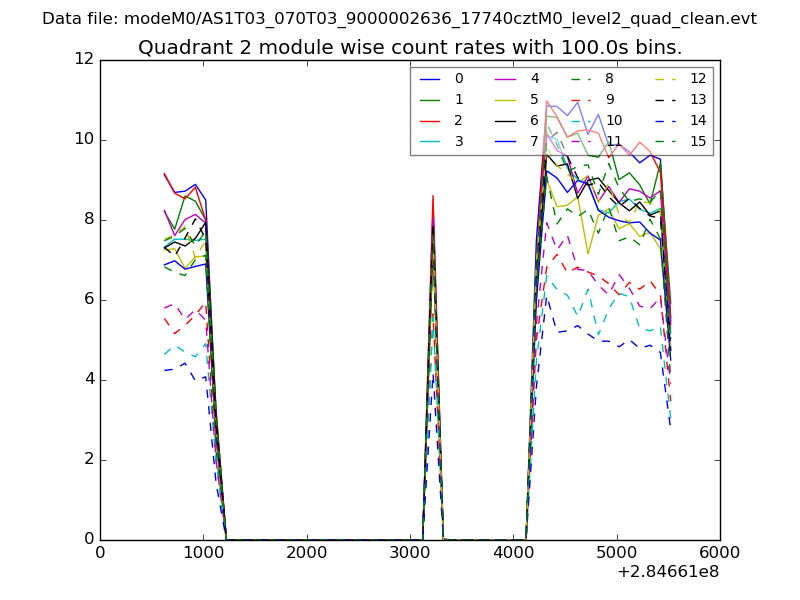
| Module-wise count rates for Quadrant B Data is divided into 100 sec bins |
 |
 |
| Module-wise count rates for Quadrant C Data is divided into 100 sec bins |
 |
 |
| Module-wise count rates for Quadrant D Data is divided into 100 sec bins |
 |
 |
| Parameter | Plot |
|---|---|
| CZT HV Monitor | 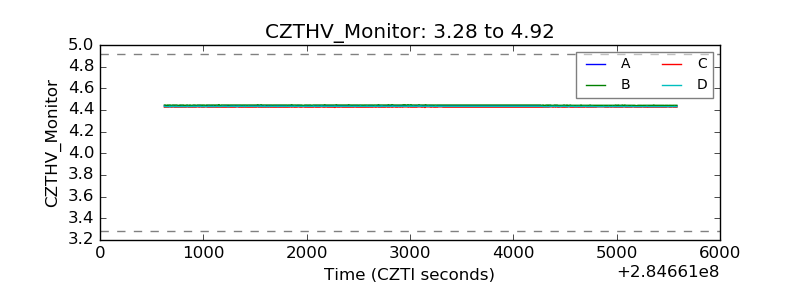 |
| D_VDD | 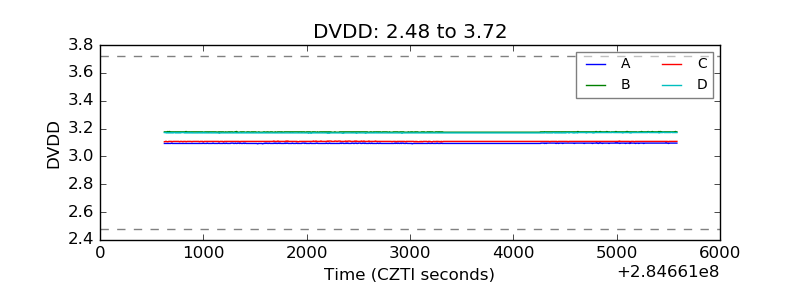 |
| Temperature 1 | 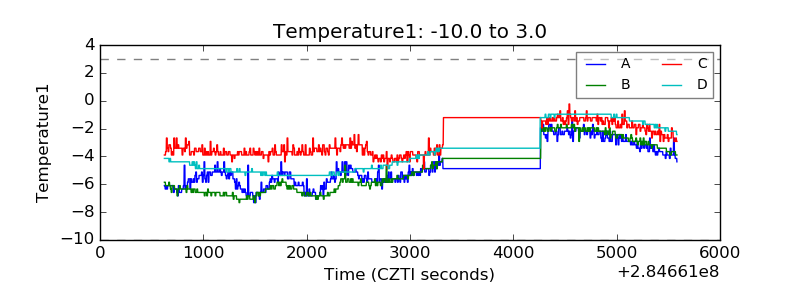 |
| Veto HV Monitor | 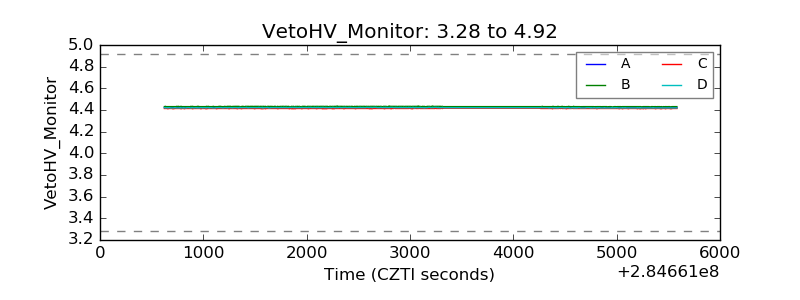 |
| Veto LLD | 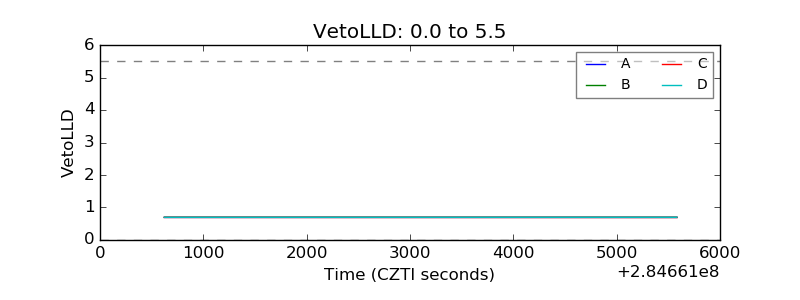 |
| Alpha Counter | 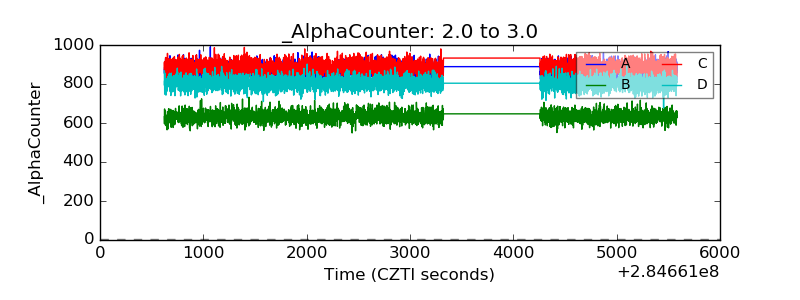 |
| _CPM_Rate | 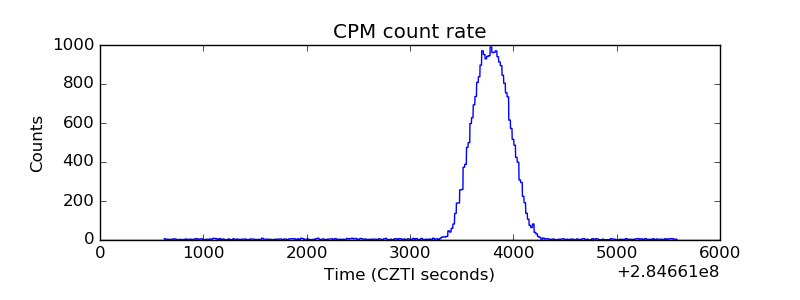 |
| CZT Counter | 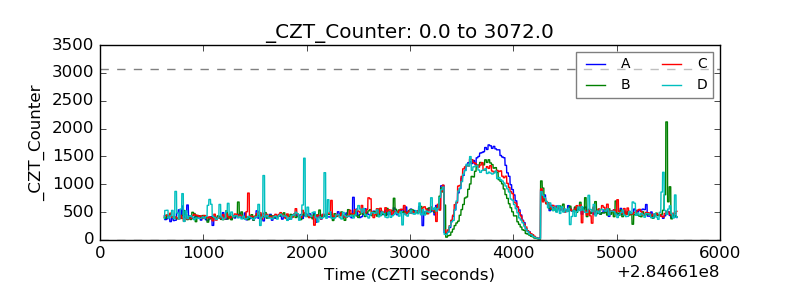 |
| +2.5 Volts monitor |  |
| +5 Volts monitor | 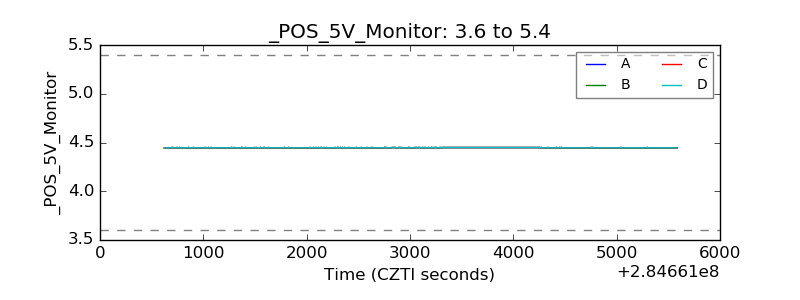 |
| _ROLL_ROT | 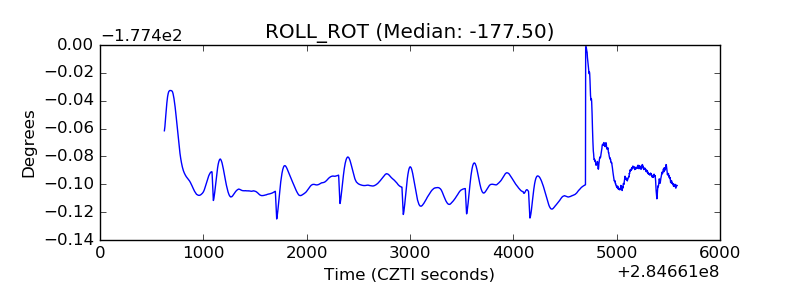 |
| _Roll_DEC |  |
| _Roll_RA | 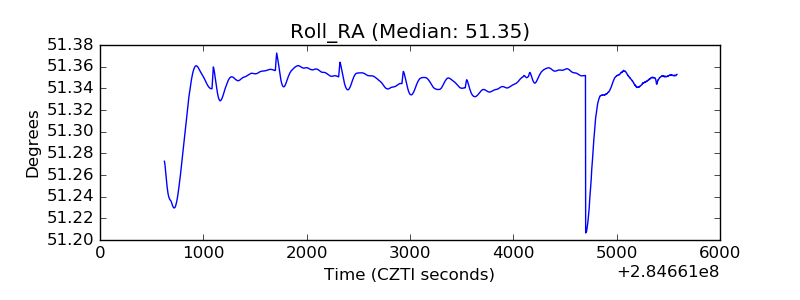 |
| Veto Counter |  |