| Param | Original file | Final file |
|---|---|---|
| Filename | modeM0/AS1T03_070T03_9000002636_17741cztM0_level2.evt | modeM0/AS1T03_070T03_9000002636_17741cztM0_level2_quad_clean.evt |
| Size (bytes) | 461,272,320 | 94,230,720 |
| Size | 439.9 MB | 89.9 MB |
| Events in quadrant A | 3,131,726 | 614,959 |
| Events in quadrant B | 3,791,905 | 595,151 |
| Events in quadrant C | 3,266,503 | 591,252 |
| Events in quadrant D | 3,326,659 | 587,722 |
| Mode SS | |||
|---|---|---|---|
| Quadrant | BADHDUFLAG | Total packets | Discarded packets |
| A | 0 | 136 | 0 |
| B | 0 | 136 | 0 |
| C | 0 | 136 | 0 |
| D | 0 | 136 | 0 |
| Mode M9 | |||
|---|---|---|---|
| Quadrant | BADHDUFLAG | Total packets | Discarded packets |
| A | 0 | 14 | 0 |
| B | 0 | 15 | 0 |
| C | 0 | 15 | 0 |
| D | 0 | 15 | 0 |
| Mode M0 | |||
|---|---|---|---|
| Quadrant | BADHDUFLAG | Total packets | Discarded packets |
| A | 0 | 13785 | 2 |
| B | 0 | 15785 | 2 |
| C | 0 | 13933 | 2 |
| D | 0 | 14566 | 2 |
| Quadrant | Total seconds | Saturated seconds | Saturation percentage |
|---|---|---|---|
| A | 6661 | 40 | 0.600510% |
| B | 6661 | 301 | 4.518841% |
| C | 6661 | 80 | 1.201021% |
| D | 6661 | 84 | 1.261072% |
Noise dominated data is calculated using 1-second bins in cleaned event files. If a bin has >2000 counts, and if more than 50% of those come from <1% of pixels, then it is considered to be noise-dominated and hence unusable.
| Quadrant | # 1 sec bins | Bins with >0 counts | Bins with >2000 counts | High rate bins dominated by noise | Noise dominated (total time) | Noise dominated (detector-on time) | Marked lightcurve |
|---|---|---|---|---|---|---|---|
| A | 7736 | 6662 | 0 | 0 | 0.00% | 0.00% | 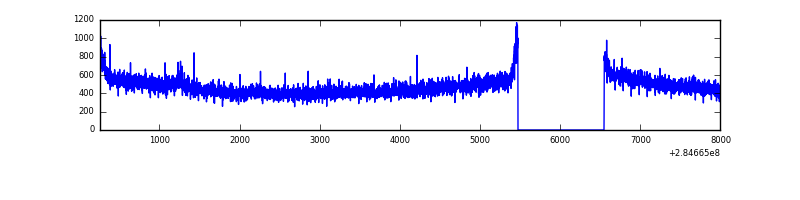 |
| B | 7736 | 6662 | 207 | 207 | 2.68% | 3.11% | 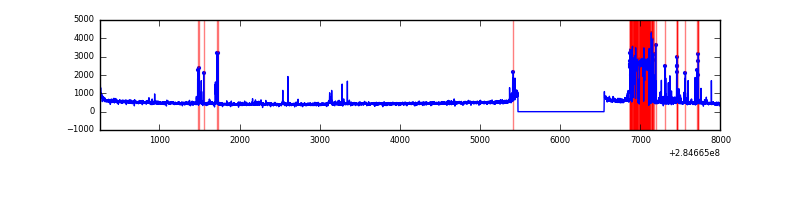 |
| C | 7736 | 6662 | 0 | 0 | 0.00% | 0.00% | 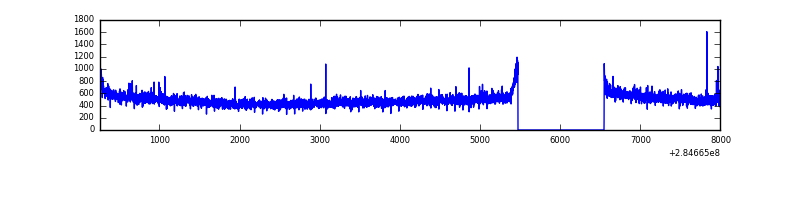 |
| D | 7736 | 6662 | 29 | 29 | 0.37% | 0.44% | 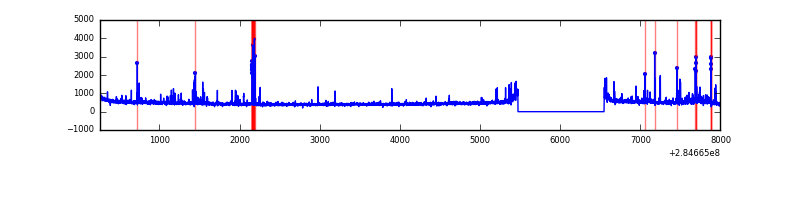 |
Top three noisy pixels from each quadrant. If the there are fewer than three noisy pixels in the level2.evt file, extra rows are filled as -1
| Pixel properties | Quadrant properties | ||||||
|---|---|---|---|---|---|---|---|
| Quadrant | DetID | PixID | Counts | Sigma | Mean | Median | Sigma |
| A | 15 | 191 | 44687 | 270.54 | 802 | 784 | 162.3 |
| A | 0 | 226 | 7213 | 39.62 | 802 | 784 | 162.3 |
| A | 3 | 137 | 5990 | 32.08 | 802 | 784 | 162.3 |
| B | 4 | 142 | 537282 | 3573.65 | 782 | 760 | 150.1 |
| B | 10 | 245 | 100403 | 663.7 | 782 | 760 | 150.1 |
| B | 0 | 197 | 47185 | 309.23 | 782 | 760 | 150.1 |
| C | 14 | 238 | 119440 | 657.31 | 775 | 780 | 180.5 |
| C | 5 | 218 | 66015 | 361.36 | 775 | 780 | 180.5 |
| C | 3 | 233 | 37443 | 203.09 | 775 | 780 | 180.5 |
| D | 1 | 52 | 245249 | 1193.99 | 779 | 761 | 204.8 |
| D | 2 | 234 | 29513 | 140.41 | 779 | 761 | 204.8 |
| D | 7 | 238 | 22601 | 106.66 | 779 | 761 | 204.8 |
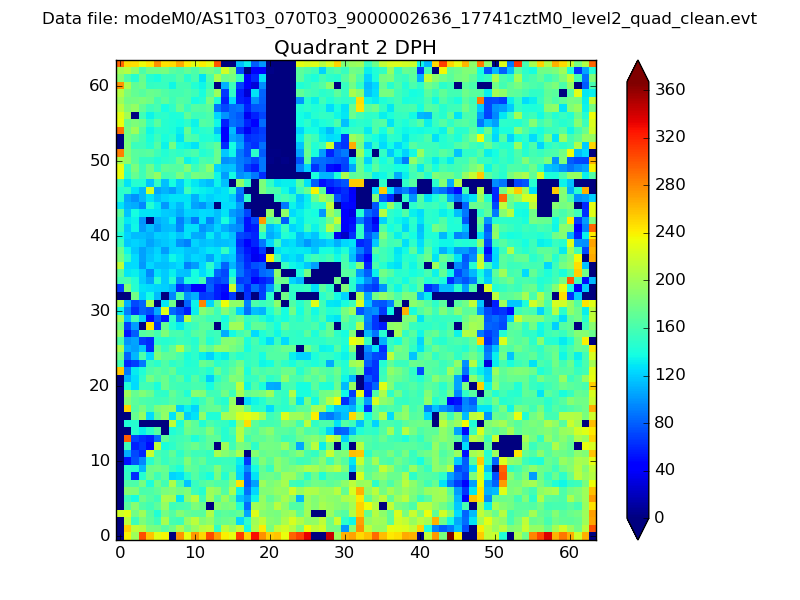
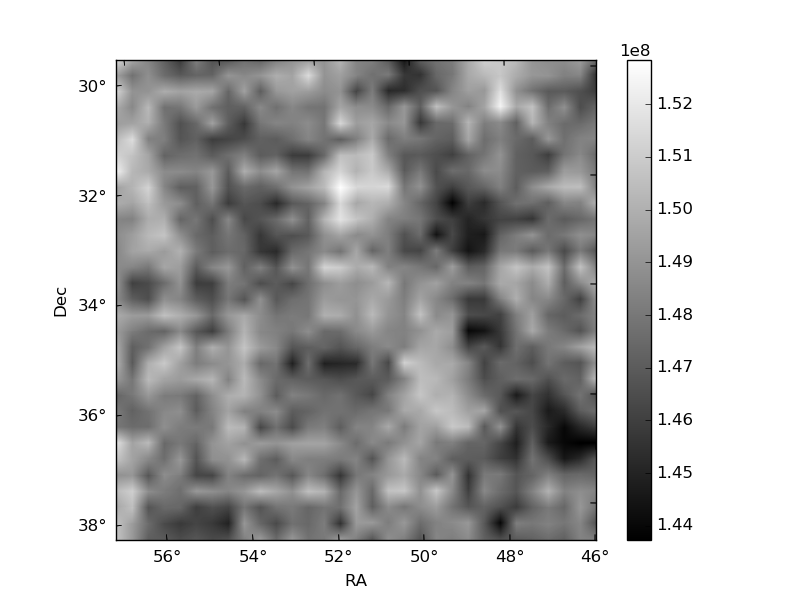
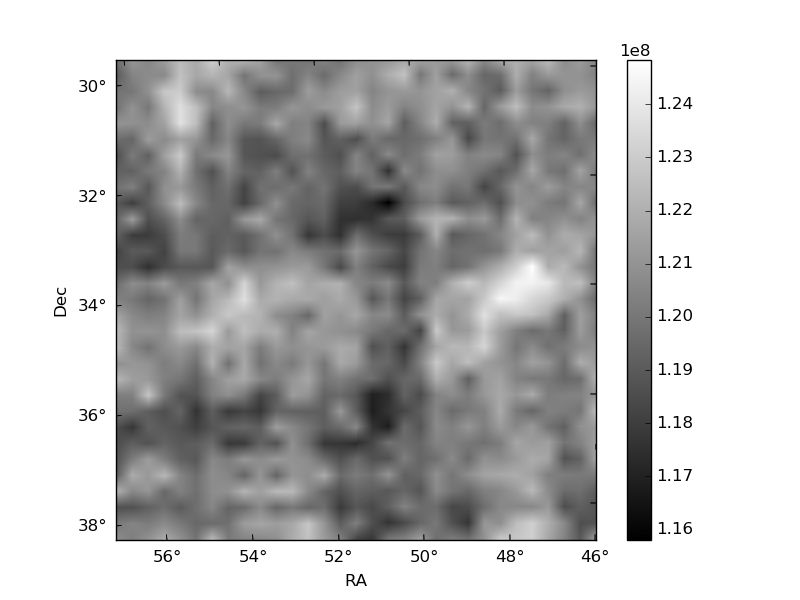
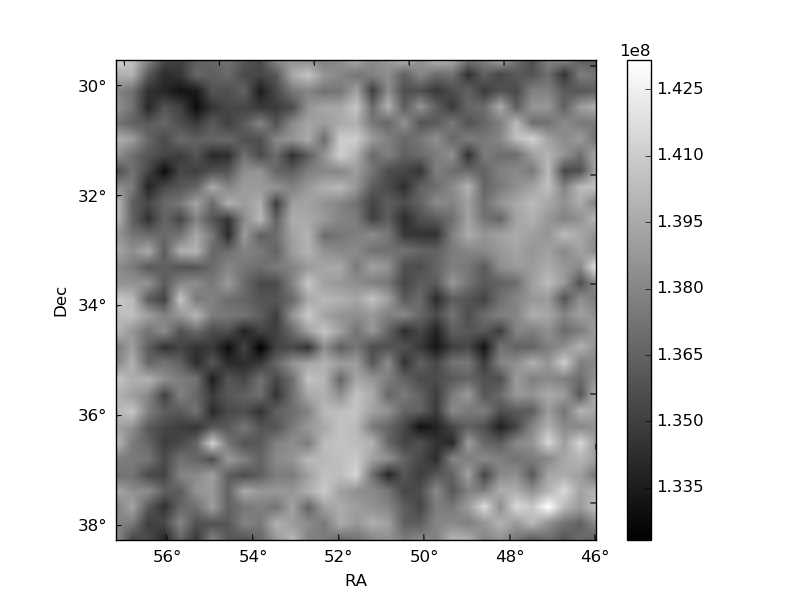
Histogram calculated using DETX and DETY for each event in the final _common_clean file
| Quadrant A | 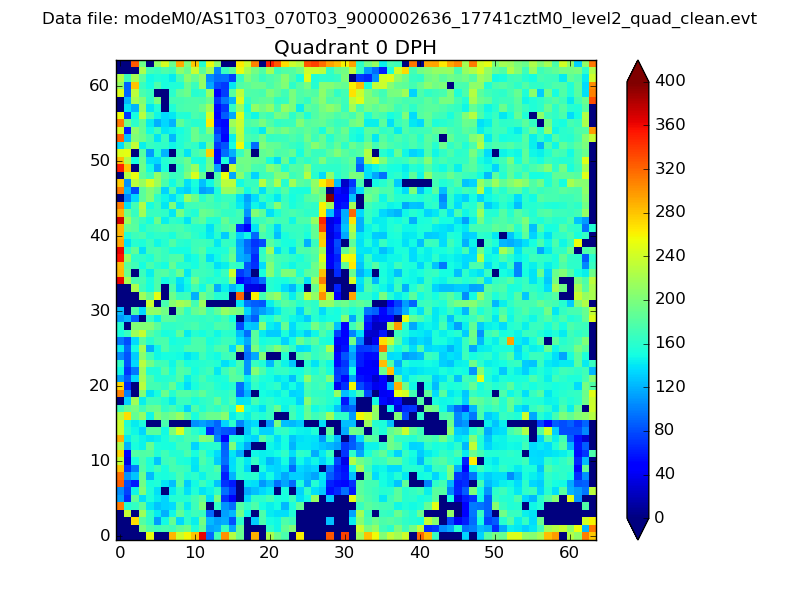 |
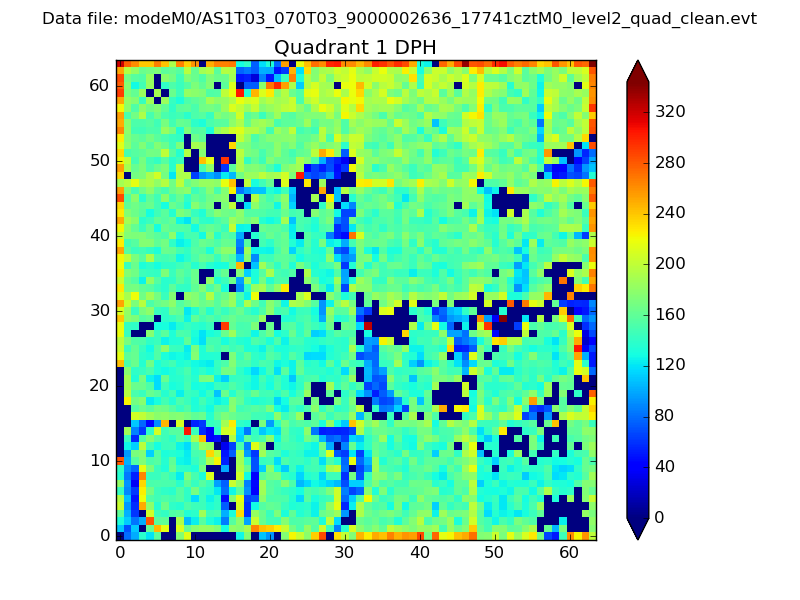 |
Quadrant B |
|---|---|---|---|
| Quadrant D | 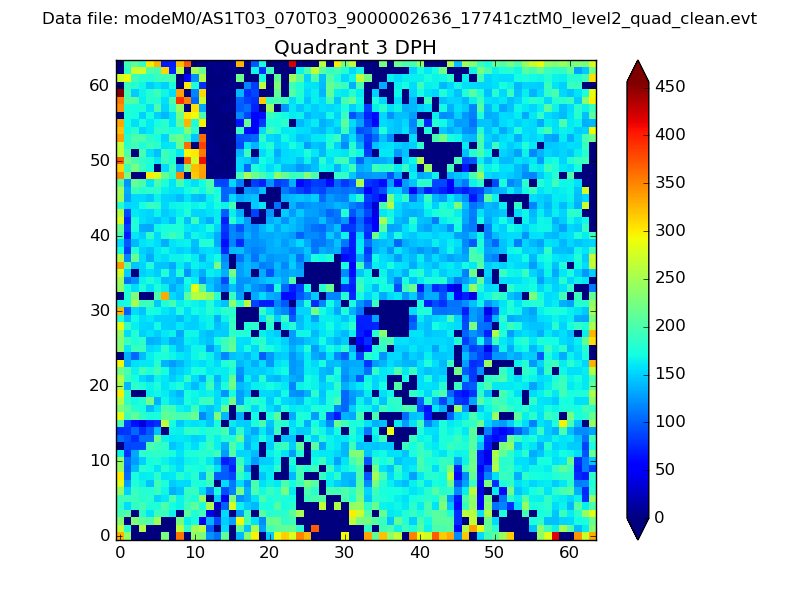 |
 |
Quadrant C |
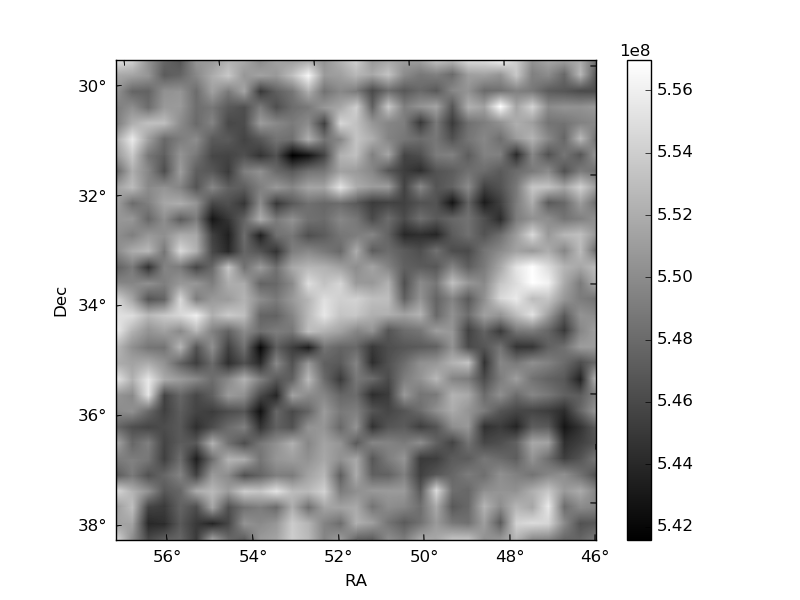
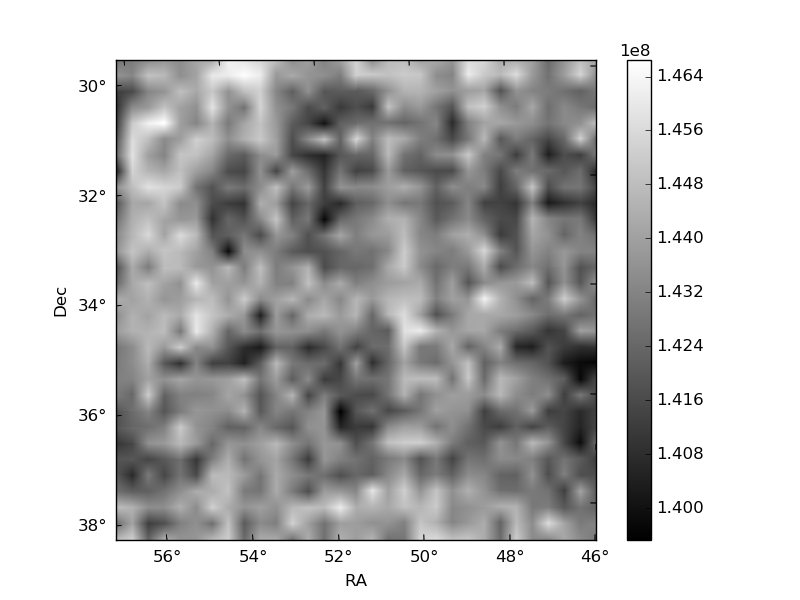
| Plot type | Count rate plots | Images |
|---|---|---|
| Comparison with Poisson distribution Blue bars denote a histogram of data divided into 1 sec bins. Red curve is a Poisson curve with rate = median count rate of data. |
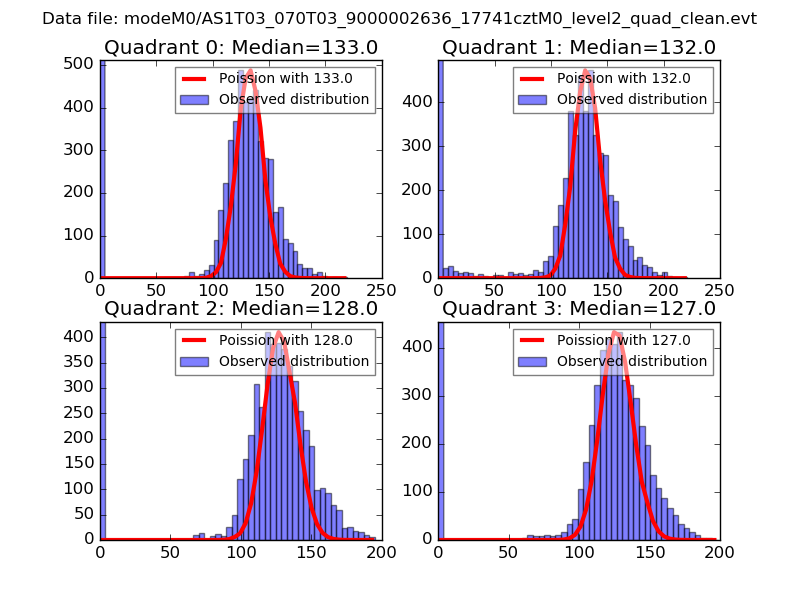 |
 |
| Quadrant-wise count rates Data is divided into 100 sec bins |
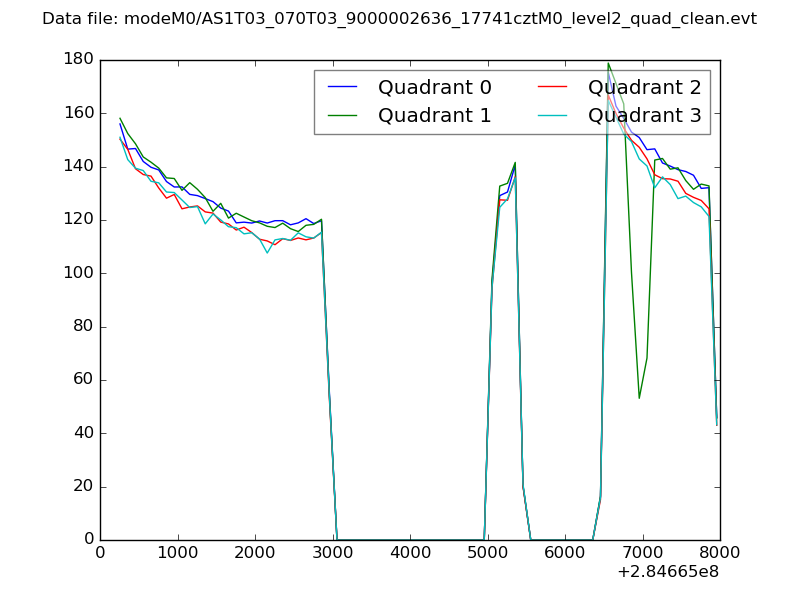 |
|
| Module-wise count rates for Quadrant A Data is divided into 100 sec bins |
 |
 |
| Module-wise count rates for Quadrant B Data is divided into 100 sec bins |
 |
 |
| Module-wise count rates for Quadrant C Data is divided into 100 sec bins |
 |
 |
| Module-wise count rates for Quadrant D Data is divided into 100 sec bins |
 |
 |
| Parameter | Plot |
|---|---|
| CZT HV Monitor |  |
| D_VDD | 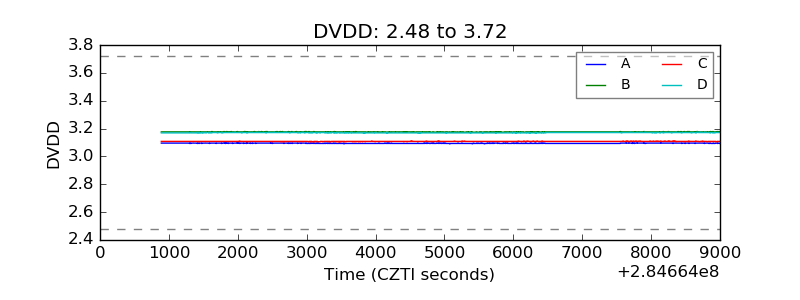 |
| Temperature 1 | 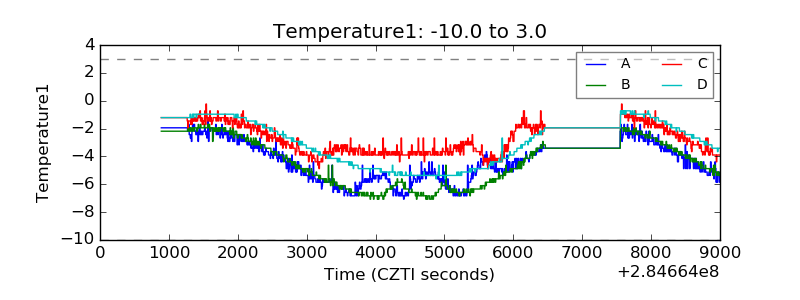 |
| Veto HV Monitor | 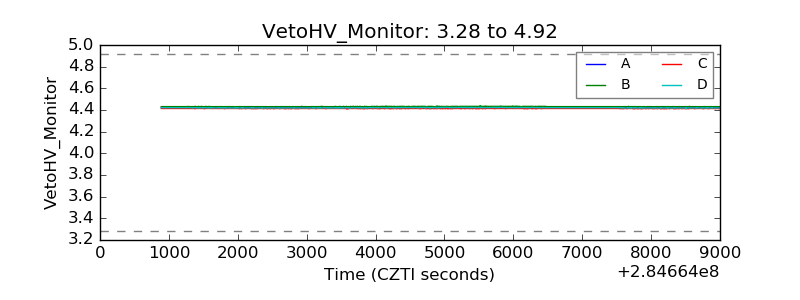 |
| Veto LLD | 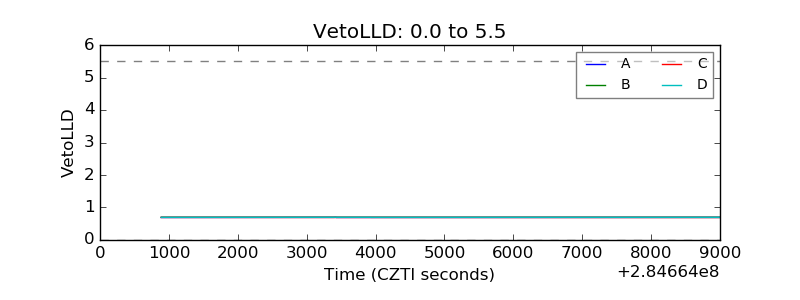 |
| Alpha Counter |  |
| _CPM_Rate | 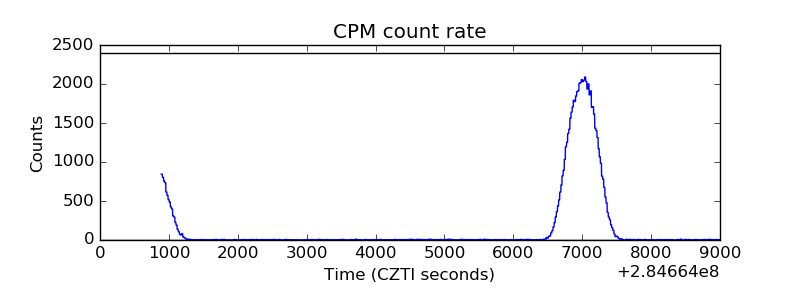 |
| CZT Counter | 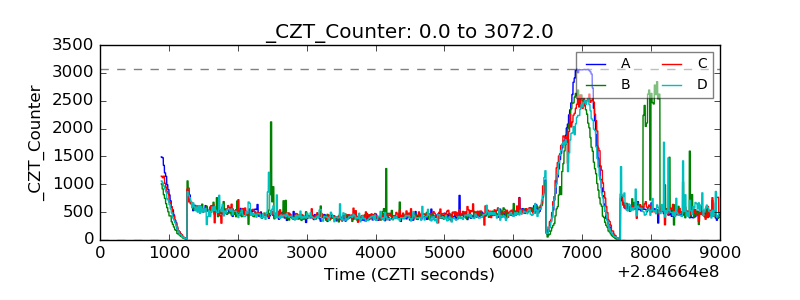 |
| +2.5 Volts monitor |  |
| +5 Volts monitor |  |
| _ROLL_ROT |  |
| _Roll_DEC |  |
| _Roll_RA | 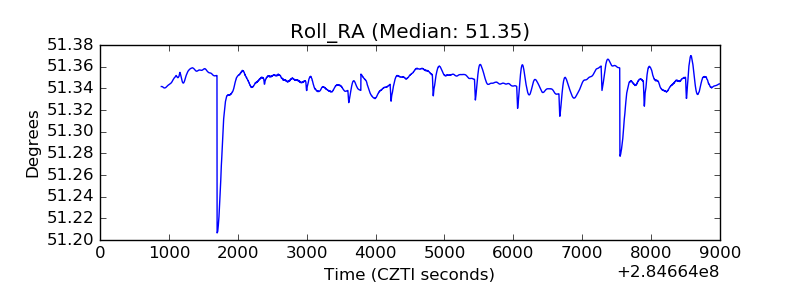 |
| Veto Counter |  |