| Param | Original file | Final file |
|---|---|---|
| Filename | modeM0/AS1T03_070T03_9000002636_17743cztM0_level2.evt | modeM0/AS1T03_070T03_9000002636_17743cztM0_level2_quad_clean.evt |
| Size (bytes) | 124,764,480 | 30,127,680 |
| Size | 119.0 MB | 28.7 MB |
| Events in quadrant A | 738,429 | 211,642 |
| Events in quadrant B | 1,299,930 | 189,696 |
| Events in quadrant C | 776,284 | 203,718 |
| Events in quadrant D | 862,537 | 198,996 |
| Mode SS | |||
|---|---|---|---|
| Quadrant | BADHDUFLAG | Total packets | Discarded packets |
| A | 0 | 30 | 0 |
| B | 0 | 30 | 0 |
| C | 0 | 30 | 0 |
| D | 0 | 30 | 0 |
| Mode M9 | |||
|---|---|---|---|
| Quadrant | BADHDUFLAG | Total packets | Discarded packets |
| A | 1 | 273359709408 | 0 |
| B | 1 | -1 | -1 |
| C | 1 | -1 | -1 |
| D | 1 | -1 | -1 |
| Mode M0 | |||
|---|---|---|---|
| Quadrant | BADHDUFLAG | Total packets | Discarded packets |
| A | 0 | 3082 | 1 |
| B | 0 | 4849 | 1 |
| C | 0 | 3164 | 1 |
| D | 0 | 3478 | 1 |
| Quadrant | Total seconds | Saturated seconds | Saturation percentage |
|---|---|---|---|
| A | 1446 | 4 | 0.276625% |
| B | 1446 | 235 | 16.251729% |
| C | 1446 | 14 | 0.968188% |
| D | 1446 | 22 | 1.521438% |
Noise dominated data is calculated using 1-second bins in cleaned event files. If a bin has >2000 counts, and if more than 50% of those come from <1% of pixels, then it is considered to be noise-dominated and hence unusable.
| Quadrant | # 1 sec bins | Bins with >0 counts | Bins with >2000 counts | High rate bins dominated by noise | Noise dominated (total time) | Noise dominated (detector-on time) | Marked lightcurve |
|---|---|---|---|---|---|---|---|
| A | 1446 | 1446 | 0 | 0 | 0.00% | 0.00% | 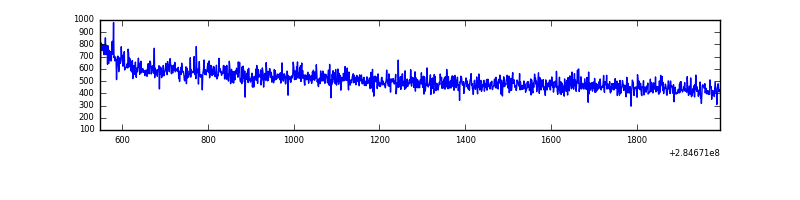 |
| B | 1446 | 1446 | 201 | 201 | 13.90% | 13.90% | 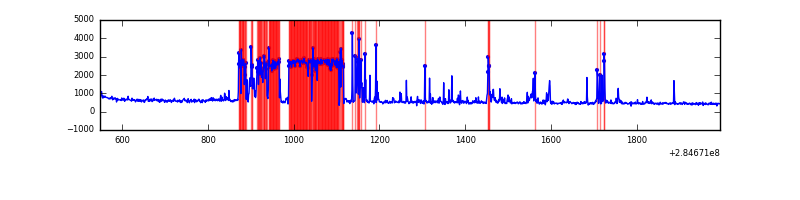 |
| C | 1446 | 1446 | 0 | 0 | 0.00% | 0.00% | 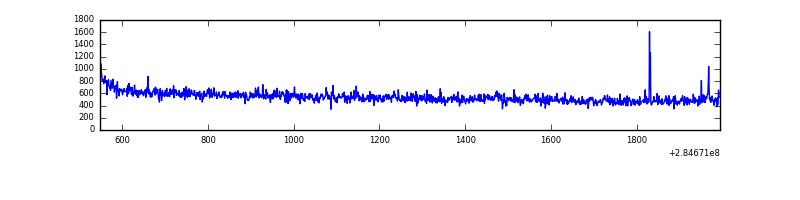 |
| D | 1446 | 1446 | 11 | 11 | 0.76% | 0.76% | 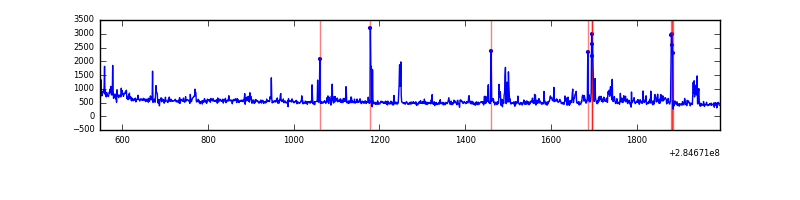 |
Top three noisy pixels from each quadrant. If the there are fewer than three noisy pixels in the level2.evt file, extra rows are filled as -1
| Pixel properties | Quadrant properties | ||||||
|---|---|---|---|---|---|---|---|
| Quadrant | DetID | PixID | Counts | Sigma | Mean | Median | Sigma |
| A | 15 | 191 | 6468 | 157.64 | 190 | 185 | 39.9 |
| A | 0 | 226 | 1744 | 39.11 | 190 | 185 | 39.9 |
| A | 12 | 194 | 1452 | 31.79 | 190 | 185 | 39.9 |
| B | 4 | 142 | 536562 | 15906.85 | 170 | 165 | 33.7 |
| B | 10 | 245 | 64054 | 1894.63 | 170 | 165 | 33.7 |
| B | 6 | 36 | 12067 | 352.95 | 170 | 165 | 33.7 |
| C | 14 | 238 | 28251 | 637.44 | 183 | 184 | 44.0 |
| C | 5 | 218 | 14142 | 317.0 | 183 | 184 | 44.0 |
| C | 3 | 233 | 12299 | 275.15 | 183 | 184 | 44.0 |
| D | 1 | 52 | 99864 | 2188.64 | 186 | 180 | 45.5 |
| D | 10 | 70 | 17360 | 377.2 | 186 | 180 | 45.5 |
| D | 7 | 238 | 15111 | 327.82 | 186 | 180 | 45.5 |
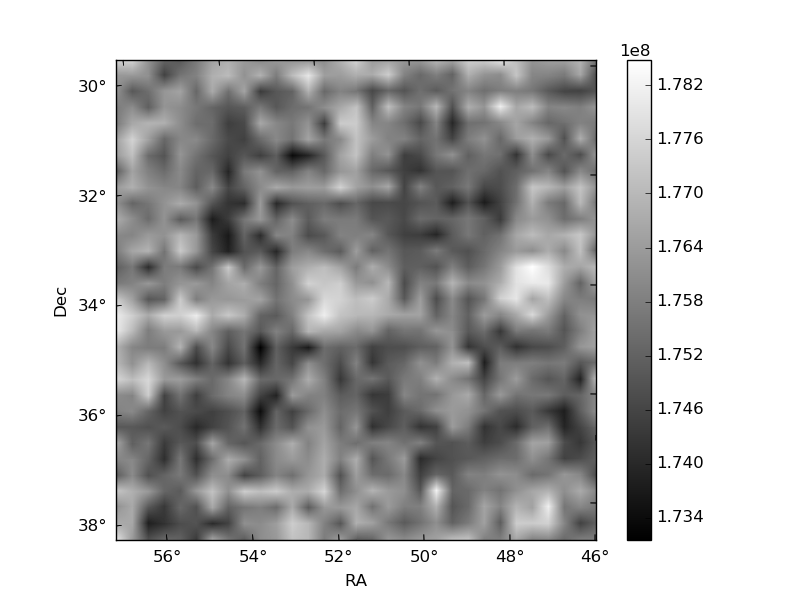
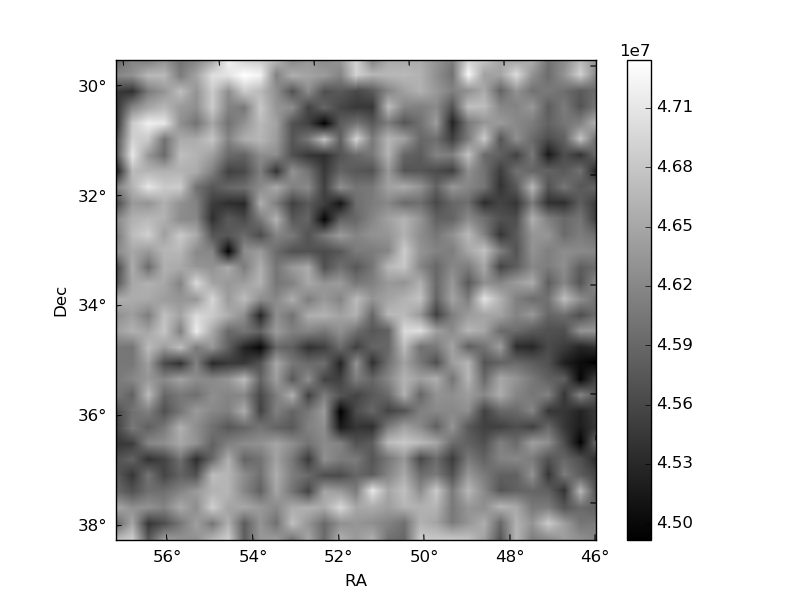
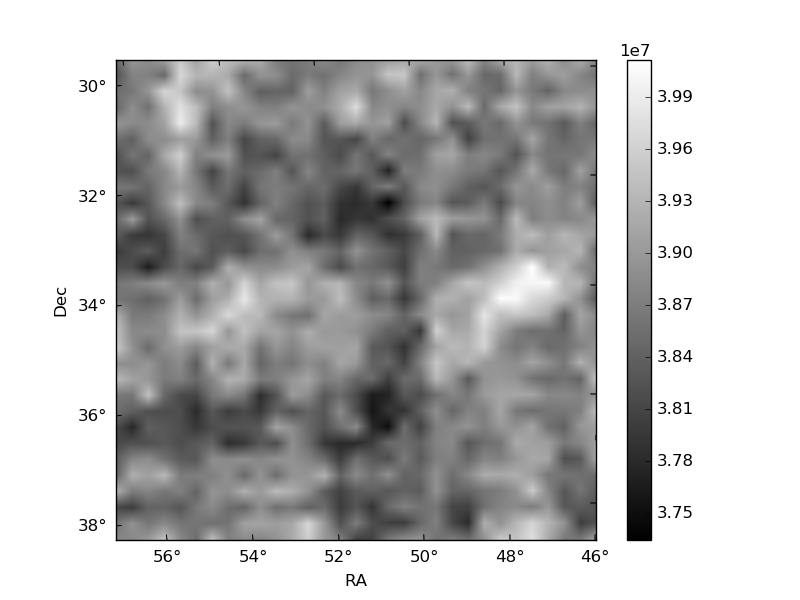
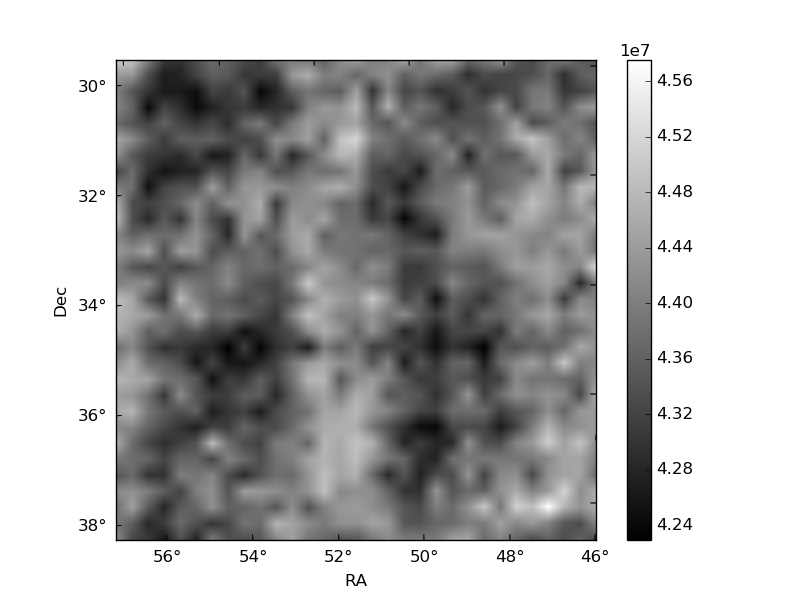
Histogram calculated using DETX and DETY for each event in the final _common_clean file
| Quadrant A | 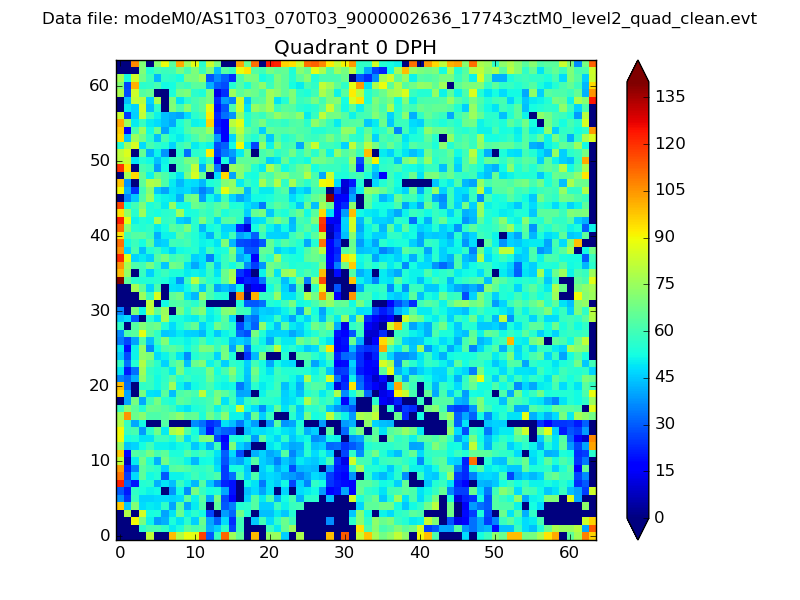 |
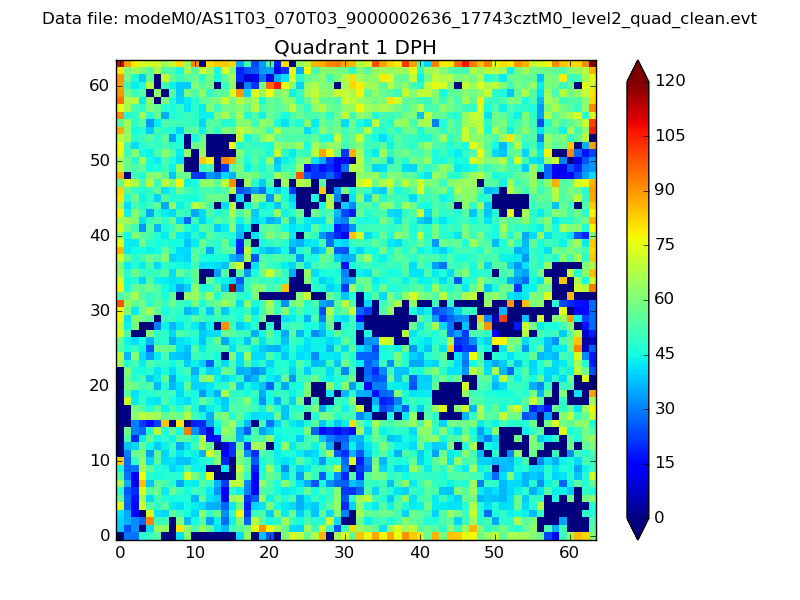 |
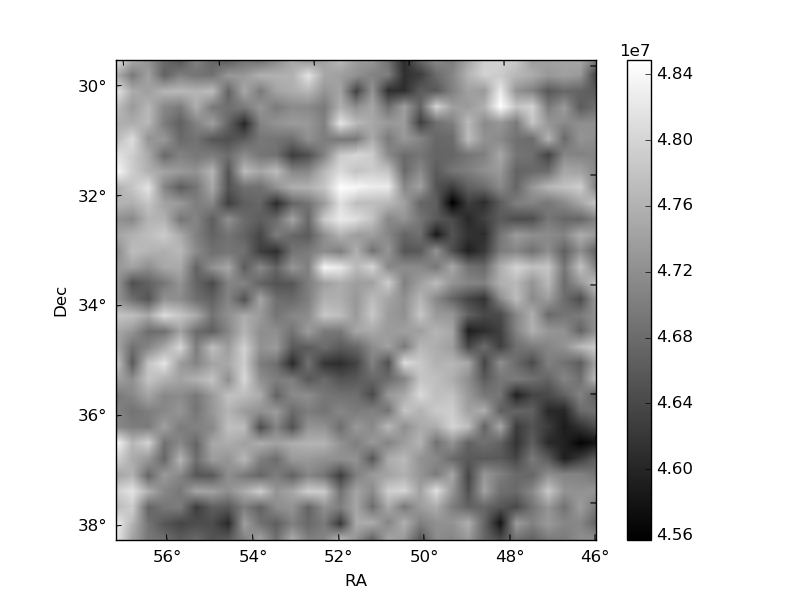
Quadrant B |
|---|---|---|---|
| Quadrant D | 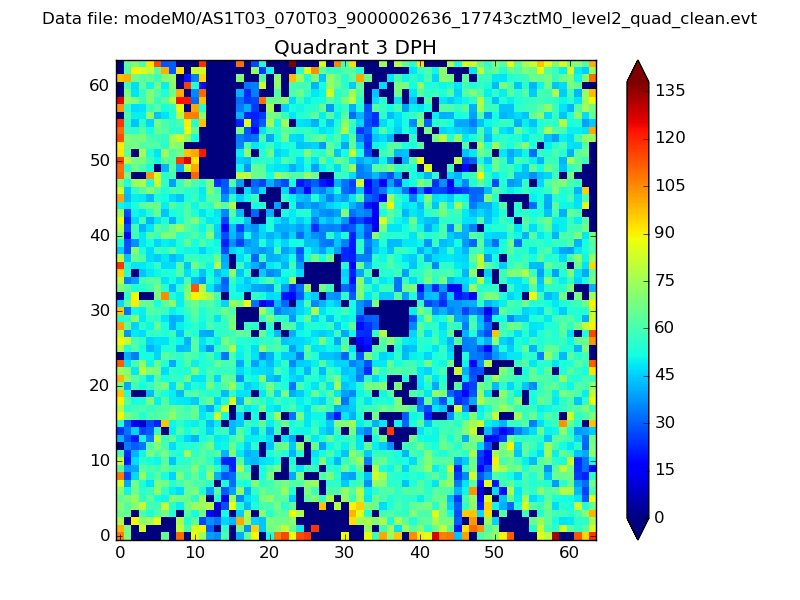 |
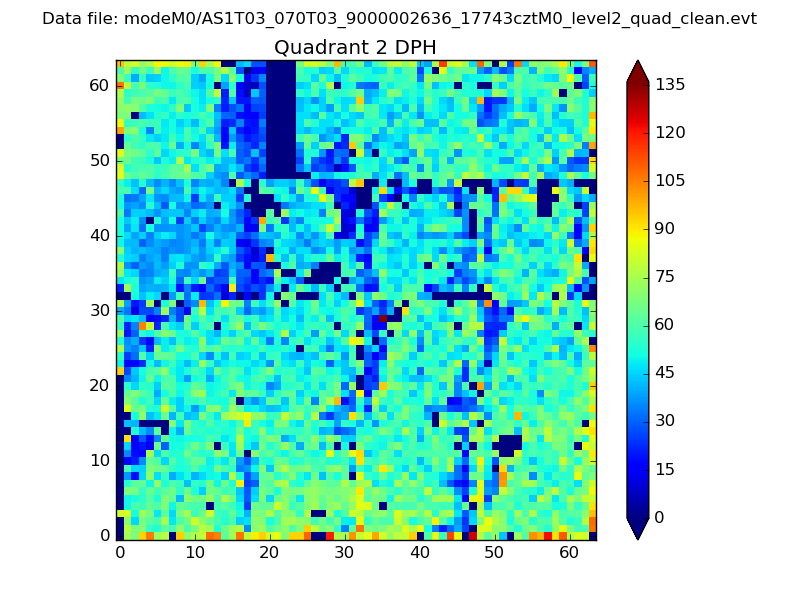 |
Quadrant C |
| Plot type | Count rate plots | Images |
|---|---|---|
| Comparison with Poisson distribution Blue bars denote a histogram of data divided into 1 sec bins. Red curve is a Poisson curve with rate = median count rate of data. |
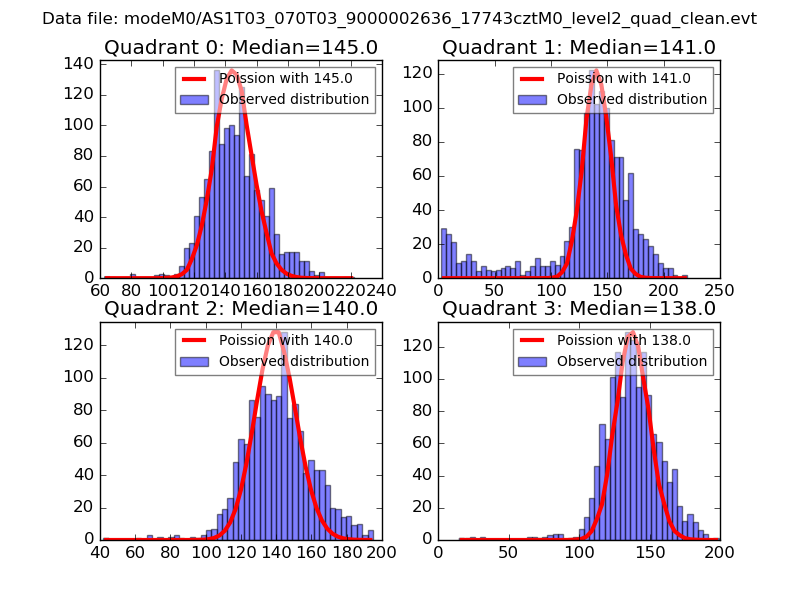 |
 |
| Quadrant-wise count rates Data is divided into 100 sec bins |
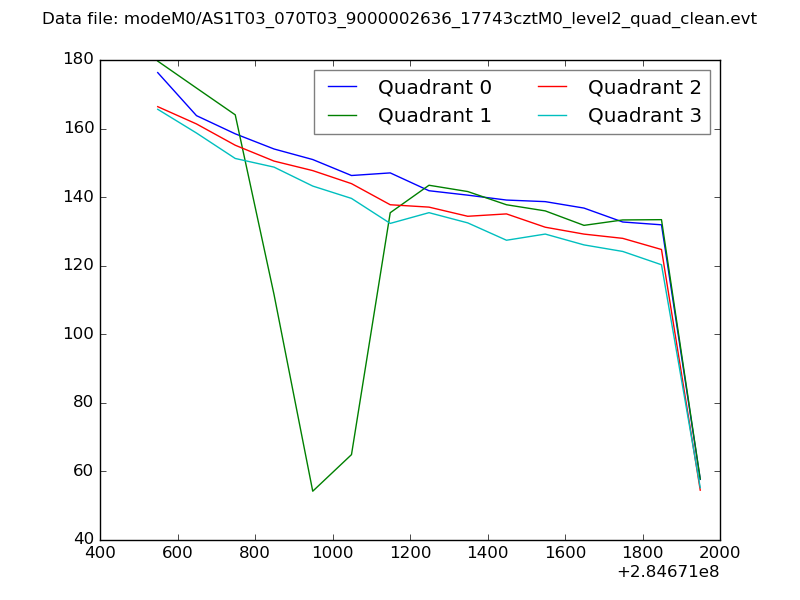 |
|
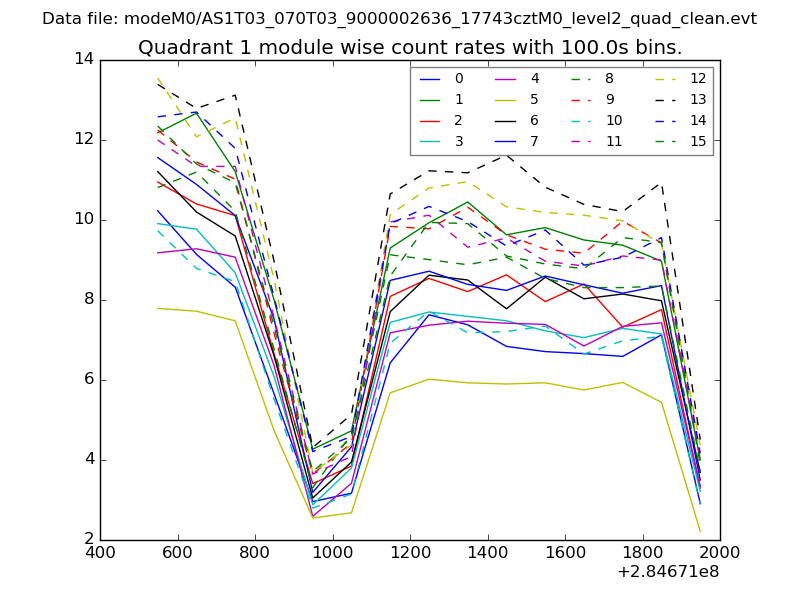
| Module-wise count rates for Quadrant A Data is divided into 100 sec bins |
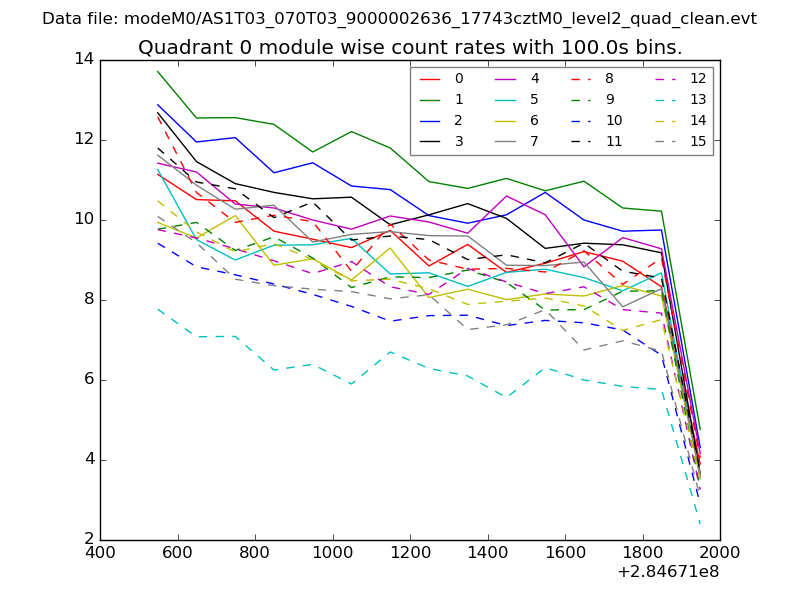 |
 |
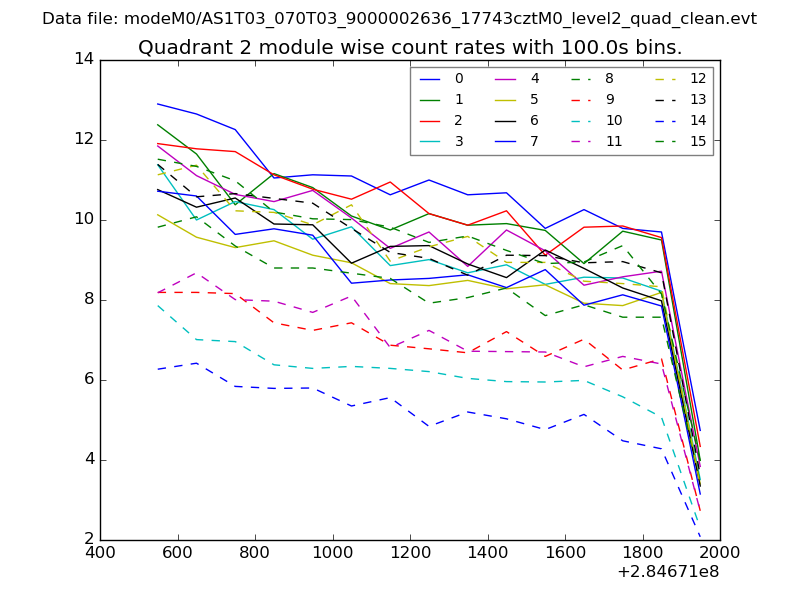
| Module-wise count rates for Quadrant B Data is divided into 100 sec bins |
 |
 |
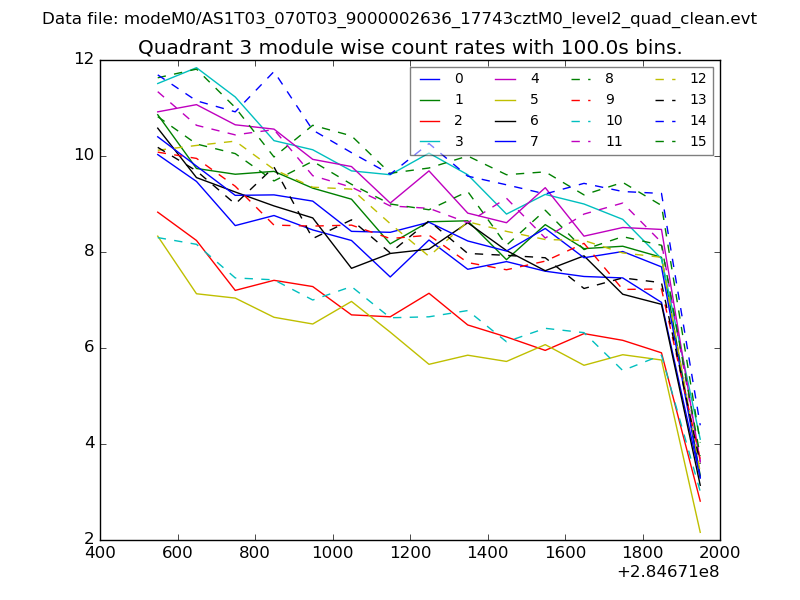
| Module-wise count rates for Quadrant C Data is divided into 100 sec bins |
 |
 |
| Module-wise count rates for Quadrant D Data is divided into 100 sec bins |
 |
 |
| Parameter | Plot |
|---|---|
| CZT HV Monitor | 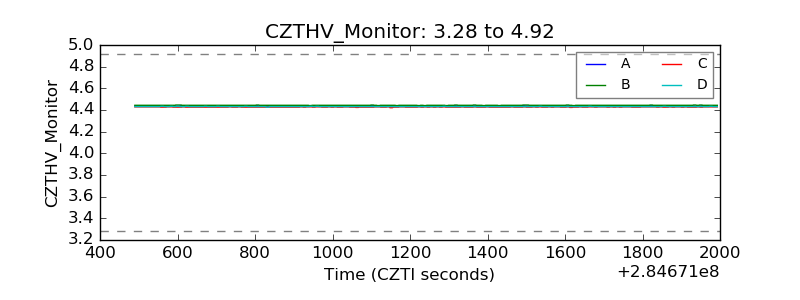 |
| D_VDD | 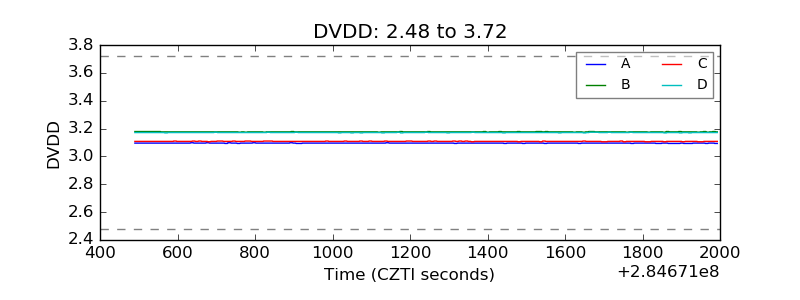 |
| Temperature 1 | 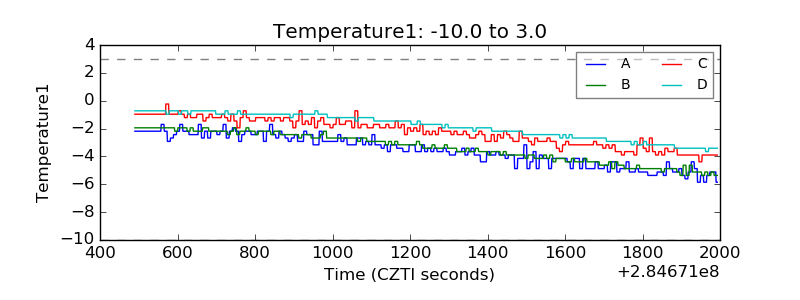 |
| Veto HV Monitor | 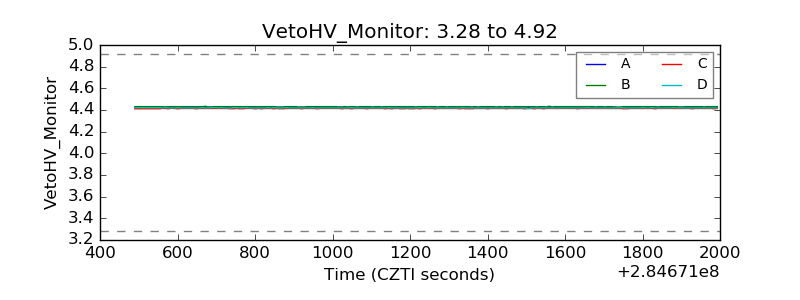 |
| Veto LLD | 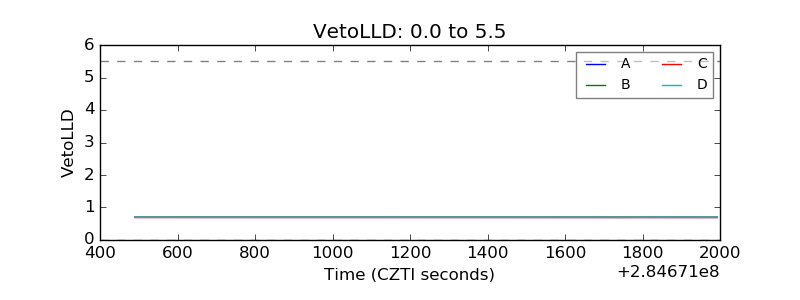 |
| Alpha Counter | 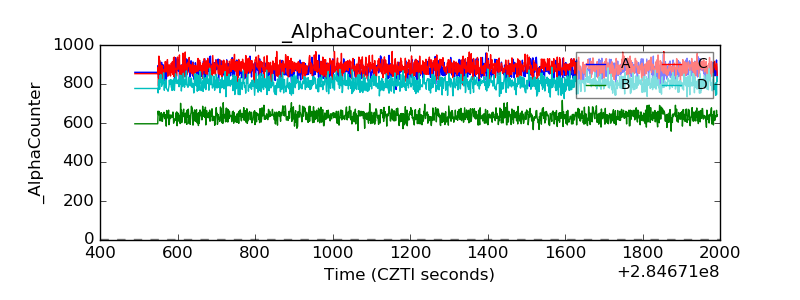 |
| _CPM_Rate | 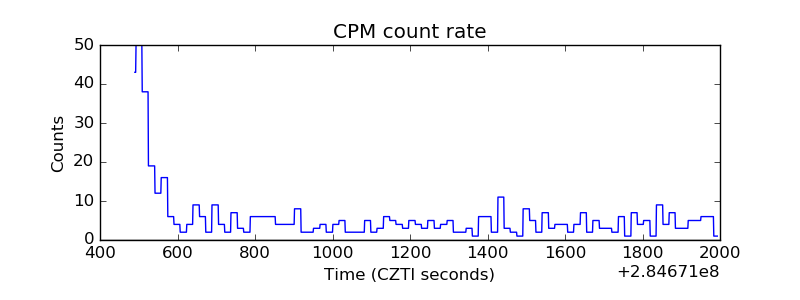 |
| CZT Counter | 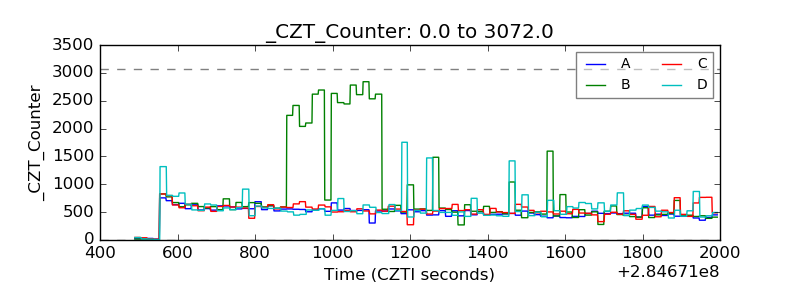 |
| +2.5 Volts monitor |  |
| +5 Volts monitor |  |
| _ROLL_ROT |  |
| _Roll_DEC | 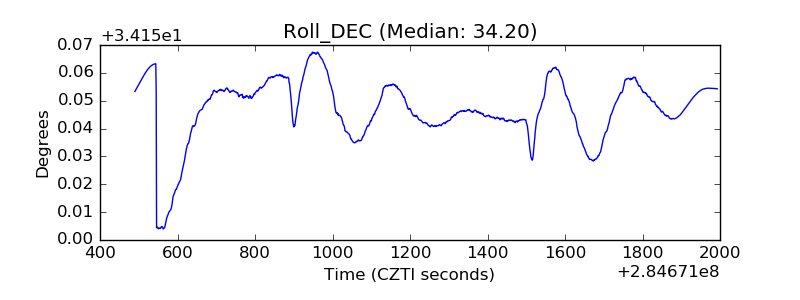 |
| _Roll_RA | 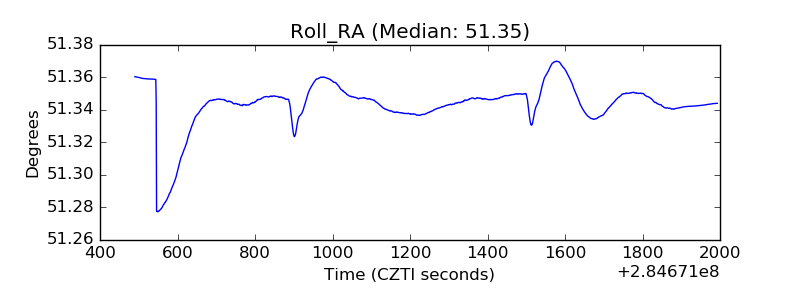 |
| Veto Counter | 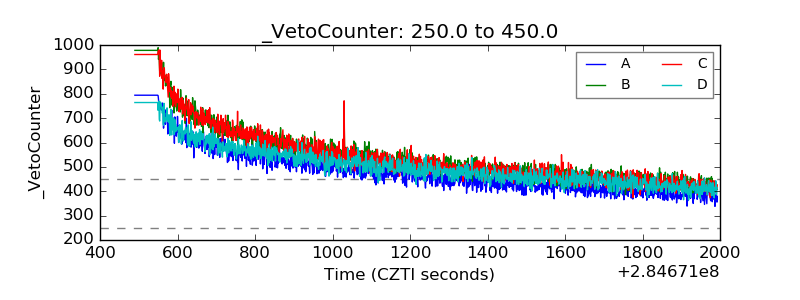 |