| Param | Original file | Final file |
|---|---|---|
| Filename | modeM0/AS1T03_070T04_9000002638cztM0_level2.fits | modeM0/AS1T03_070T04_9000002638cztM0_level2_quad_clean.evt |
| Size (bytes) | 145,103,040 | 70,848,000 |
| Size | 138.4 MB | 67.6 MB |
| Events in quadrant A | 888,214 | 298,957 |
| Events in quadrant B | 876,522 | 305,804 |
| Events in quadrant C | 883,224 | 288,620 |
| Events in quadrant D | 761,776 | 265,511 |
| Mode SS | |||
|---|---|---|---|
| Quadrant | BADHDUFLAG | Total packets | Discarded packets |
| A | 0 | 290 | 0 |
| B | 0 | 290 | 0 |
| C | 0 | 290 | 0 |
| D | 0 | 290 | 0 |
| Mode M9 | |||
|---|---|---|---|
| Quadrant | BADHDUFLAG | Total packets | Discarded packets |
| A | 0 | 40 | 0 |
| B | 0 | 40 | 0 |
| C | 0 | 40 | 0 |
| D | 0 | 40 | 0 |
| Mode M0 | |||
|---|---|---|---|
| Quadrant | BADHDUFLAG | Total packets | Discarded packets |
| A | 0 | 34819 | 0 |
| B | 0 | 31817 | 0 |
| C | 0 | 30214 | 0 |
| D | 0 | 34255 | 0 |
| Quadrant | Total seconds | Saturated seconds | Saturation percentage |
|---|---|---|---|
| A | 14272 | 502 | 3.517377% |
| B | 14272 | 209 | 1.464406% |
| C | 14272 | 129 | 0.903868% |
| D | 14272 | 167 | 1.170123% |
Noise dominated data is calculated using 1-second bins in cleaned event files. If a bin has >2000 counts, and if more than 50% of those come from <1% of pixels, then it is considered to be noise-dominated and hence unusable.
| Quadrant | # 1 sec bins | Bins with >0 counts | Bins with >2000 counts | High rate bins dominated by noise | Noise dominated (total time) | Noise dominated (detector-on time) | Marked lightcurve |
|---|---|---|---|---|---|---|---|
| A | 18187 | 14272 | 0 | 0 | 0.00% | 0.00% | 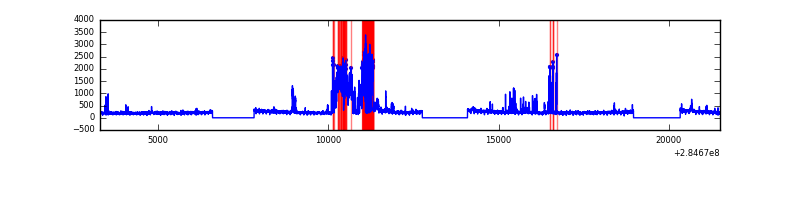 |
| B | 18187 | 14272 | 0 | 0 | 0.00% | 0.00% |  |
| C | 18187 | 14272 | 0 | 0 | 0.00% | 0.00% | 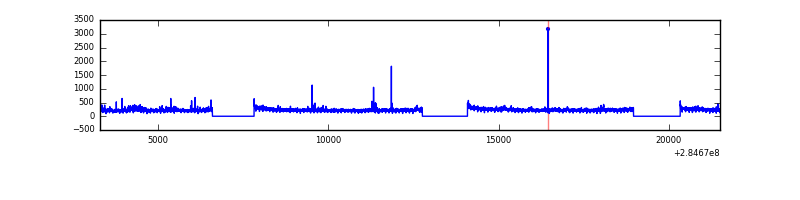 |
| D | 18187 | 14272 | 0 | 0 | 0.00% | 0.00% | 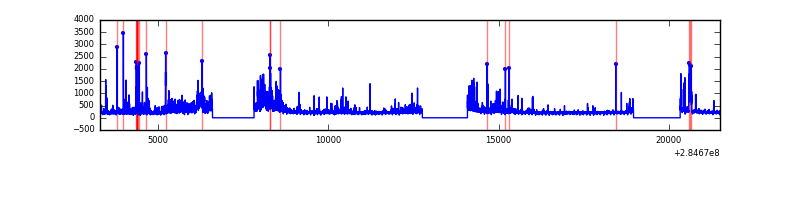 |
Top three noisy pixels from each quadrant. If the there are fewer than three noisy pixels in the level2.evt file, extra rows are filled as -1
| Pixel properties | Quadrant properties | ||||||
|---|---|---|---|---|---|---|---|
| Quadrant | DetID | PixID | Counts | Sigma | Mean | Median | Sigma |
| A | 0 | 29 | 832 | 10.36 | 231 | 218 | 59.2 |
| A | 7 | 110 | 736 | 8.74 | 231 | 218 | 59.2 |
| A | 15 | 236 | 691 | 7.98 | 231 | 218 | 59.2 |
| B | 2 | 9 | 700 | 10.19 | 231 | 222 | 46.9 |
| B | 5 | 128 | 579 | 7.61 | 231 | 222 | 46.9 |
| B | 2 | 8 | 578 | 7.59 | 231 | 222 | 46.9 |
| C | 1 | 81 | 658 | 7.07 | 233 | 219 | 62.1 |
| C | 2 | 191 | 623 | 6.5 | 233 | 219 | 62.1 |
| C | 3 | 126 | 618 | 6.42 | 233 | 219 | 62.1 |
| D | 3 | 14 | 570 | 6.25 | 217 | 199 | 59.4 |
| D | 10 | 189 | 550 | 5.91 | 217 | 199 | 59.4 |
| D | 6 | 83 | 535 | 5.66 | 217 | 199 | 59.4 |
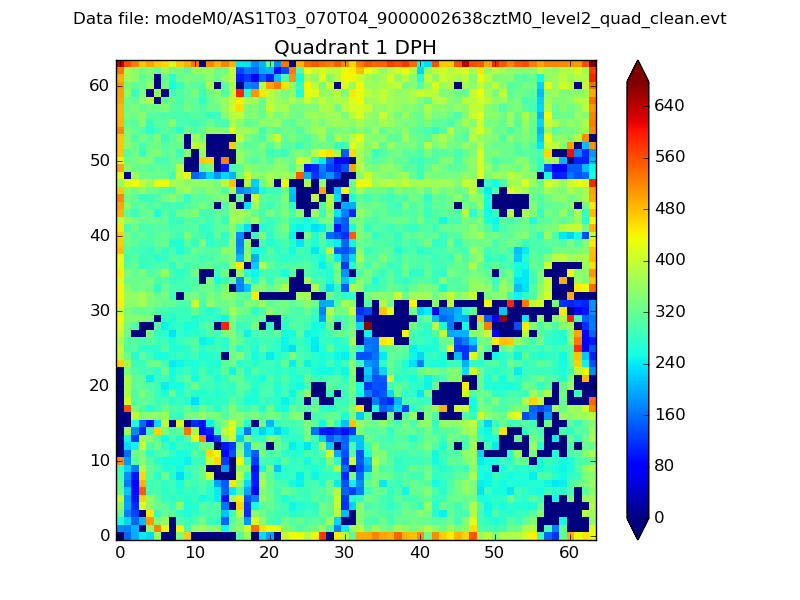
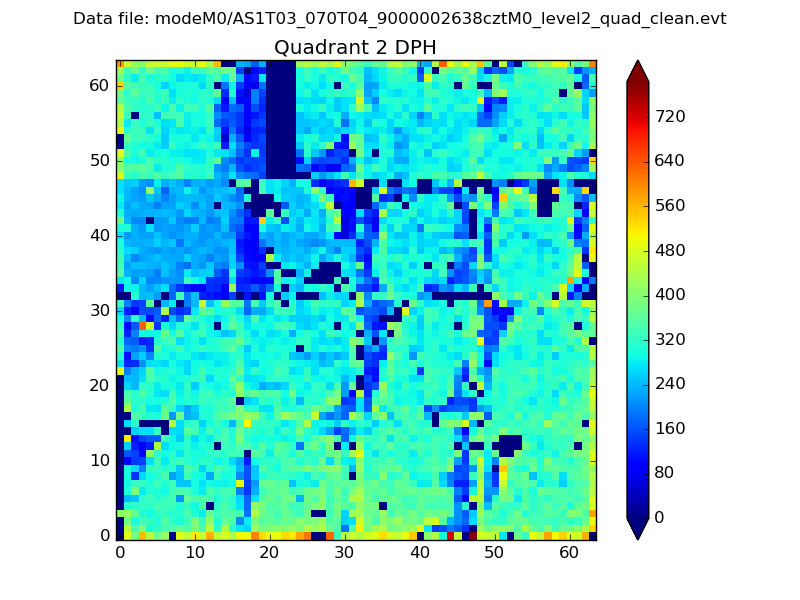
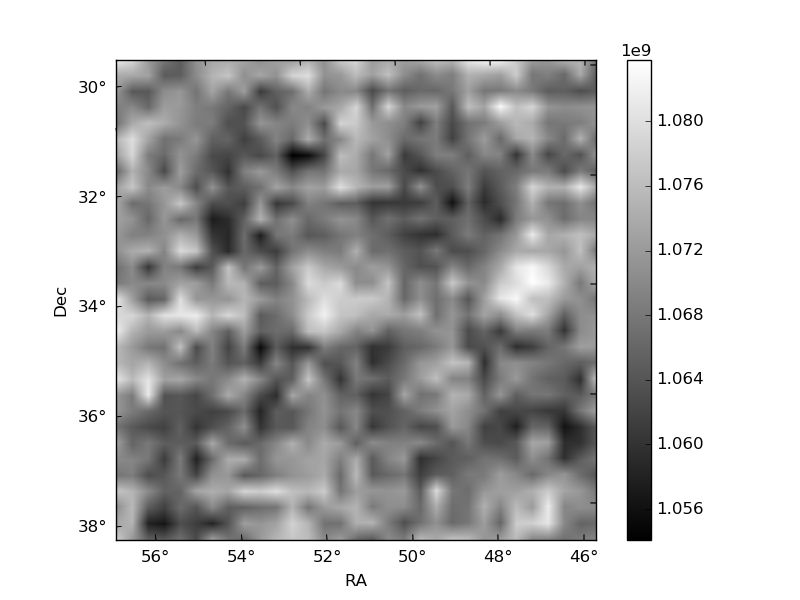
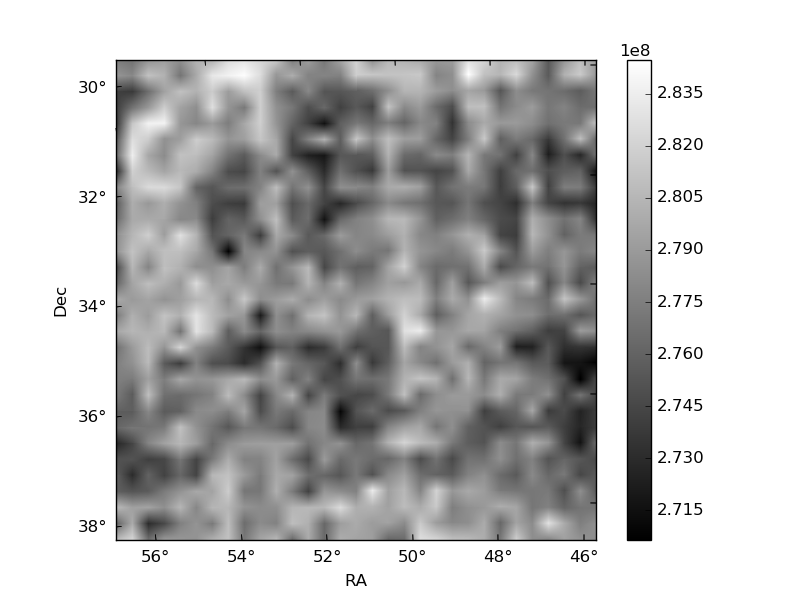
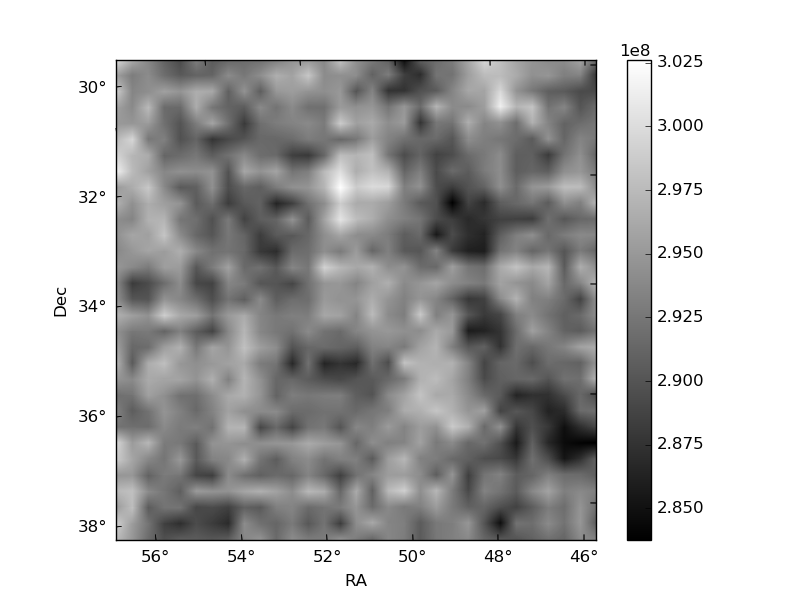
Histogram calculated using DETX and DETY for each event in the final _common_clean file
| Quadrant A | 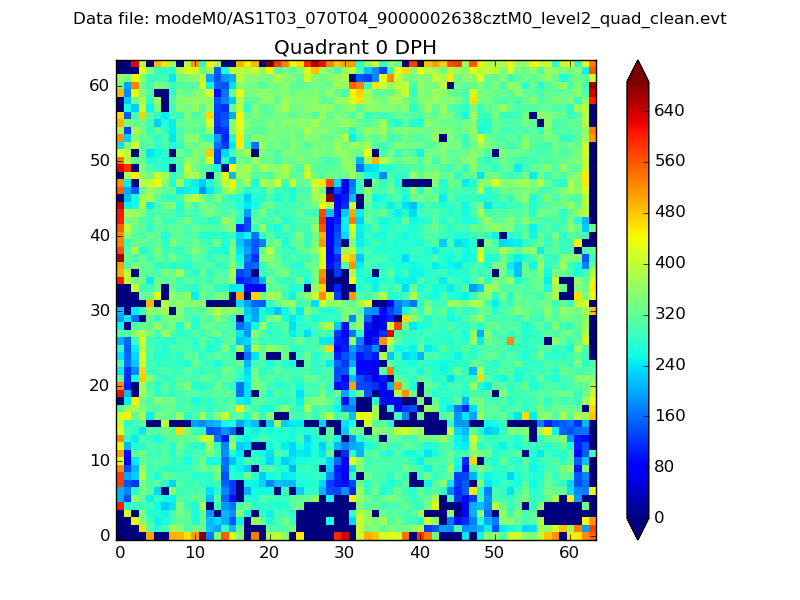 |
 |
Quadrant B |
|---|---|---|---|
| Quadrant D | 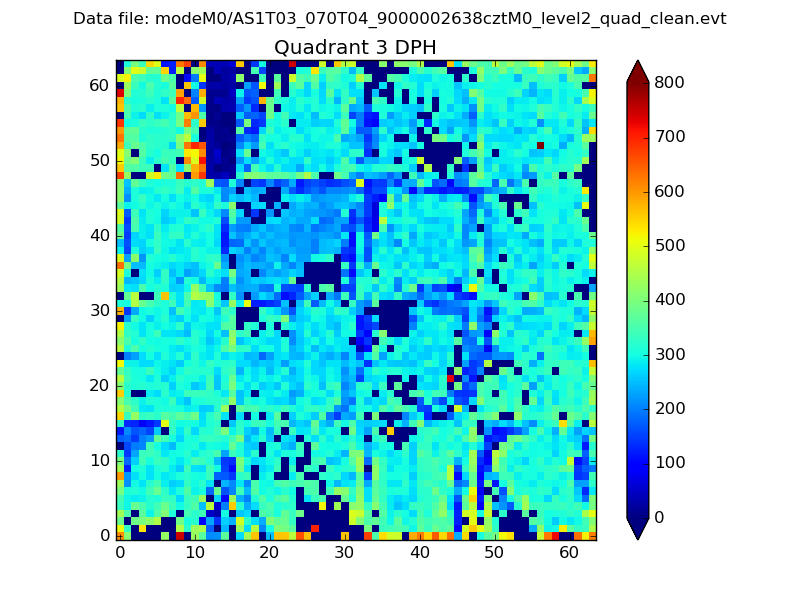 |
 |
Quadrant C |
| Plot type | Count rate plots | Images |
|---|---|---|
| Comparison with Poisson distribution Blue bars denote a histogram of data divided into 1 sec bins. Red curve is a Poisson curve with rate = median count rate of data. |
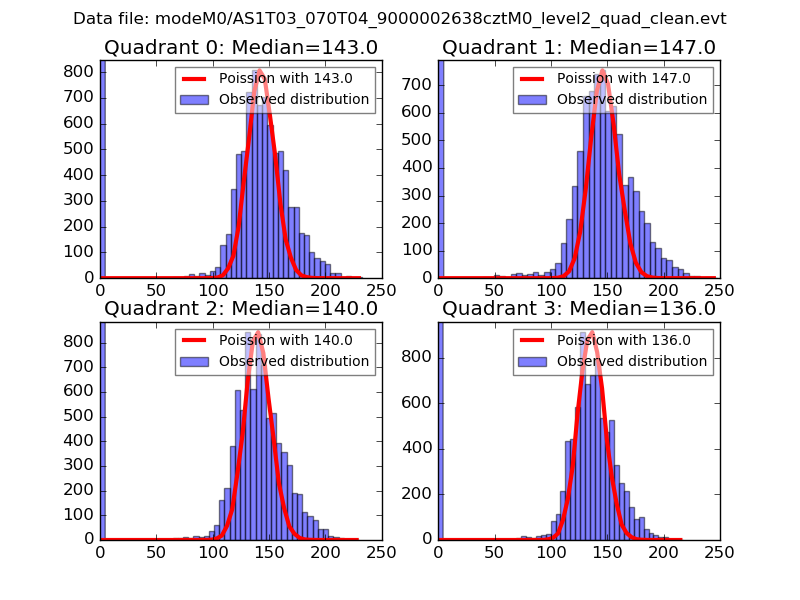 |
 |
| Quadrant-wise count rates Data is divided into 100 sec bins |
 |
|
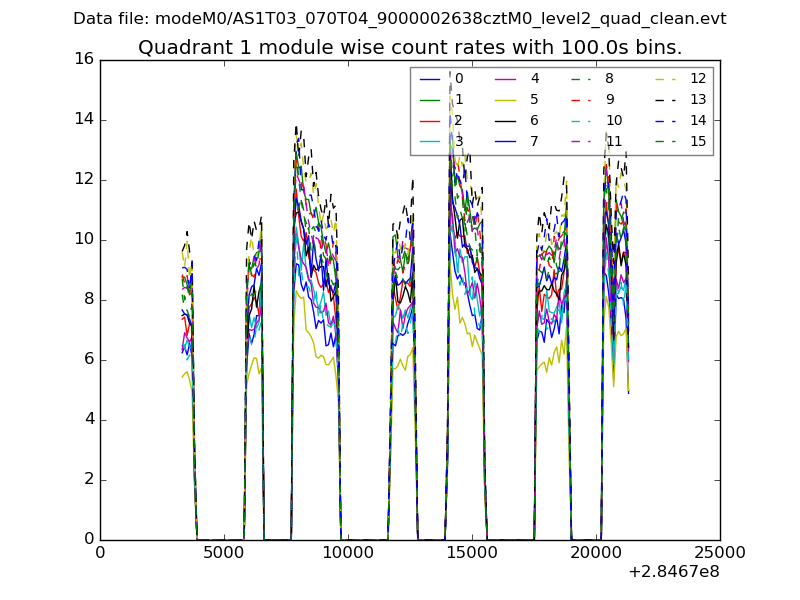
| Module-wise count rates for Quadrant A Data is divided into 100 sec bins |
 |
 |
| Module-wise count rates for Quadrant B Data is divided into 100 sec bins |
 |
 |
| Module-wise count rates for Quadrant C Data is divided into 100 sec bins |
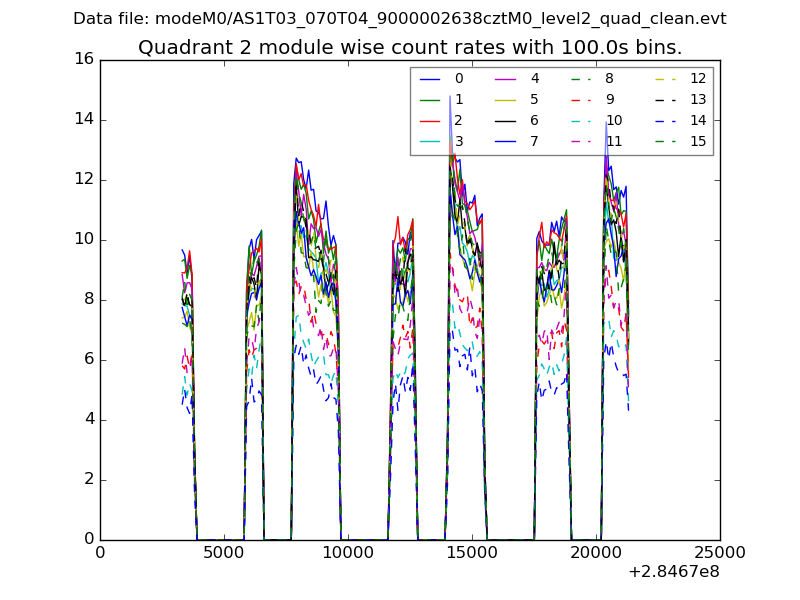 |
 |
| Module-wise count rates for Quadrant D Data is divided into 100 sec bins |
 |
 |
| Parameter | Plot |
|---|---|
| CZT HV Monitor |  |
| D_VDD | 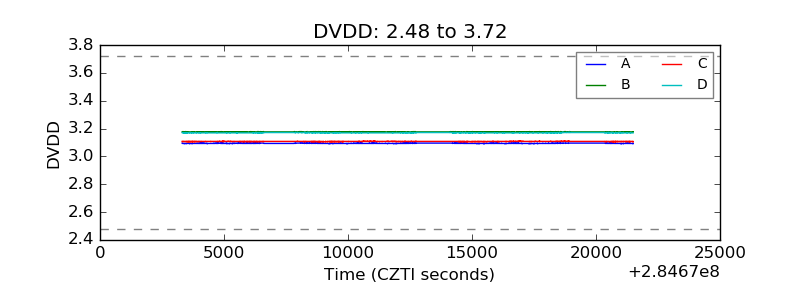 |
| Temperature 1 | 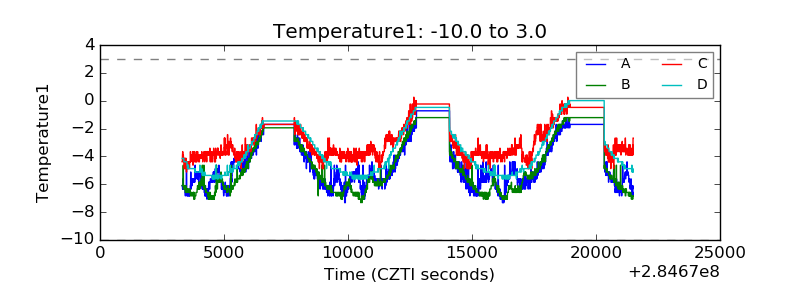 |
| Veto HV Monitor | 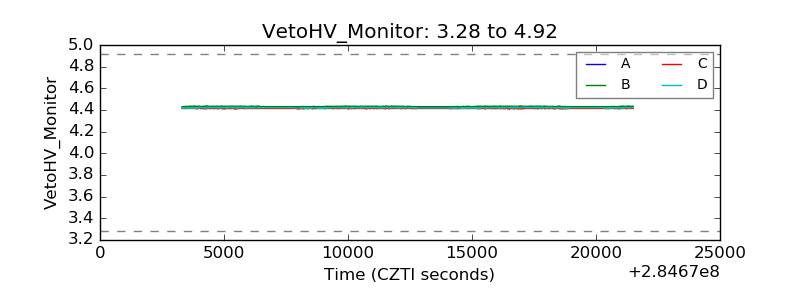 |
| Veto LLD |  |
| Alpha Counter |  |
| _CPM_Rate | 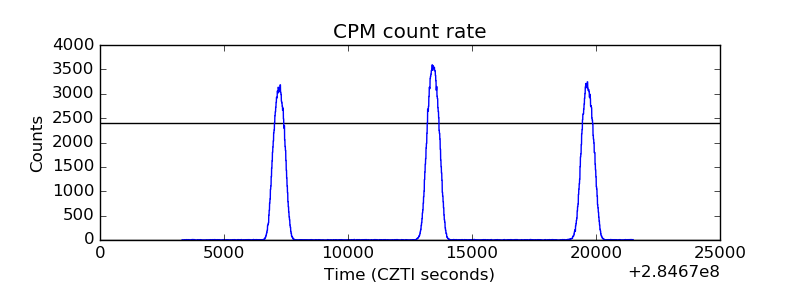 |
| CZT Counter | 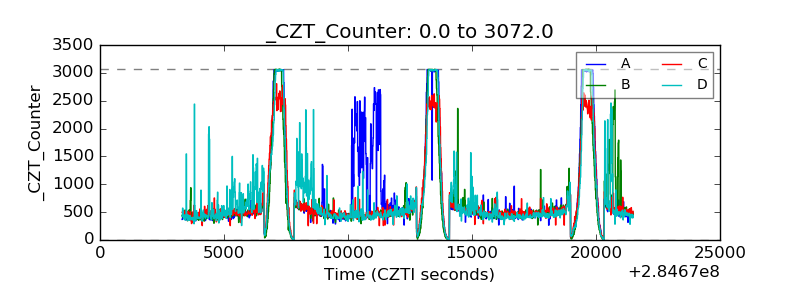 |
| +2.5 Volts monitor | 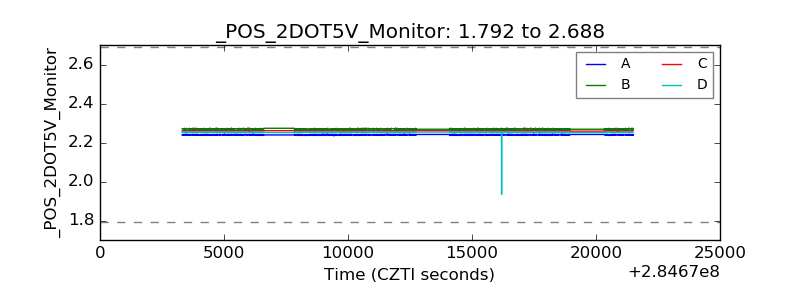 |
| +5 Volts monitor | 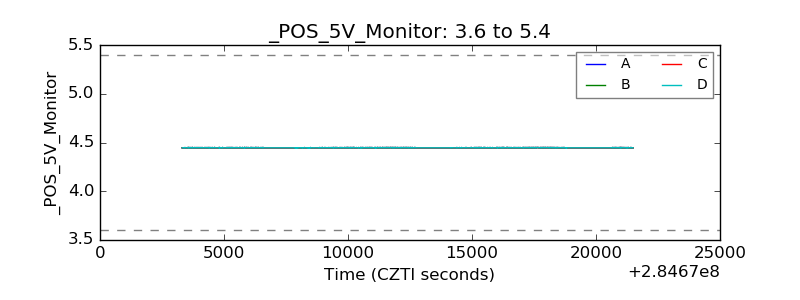 |
| _ROLL_ROT | 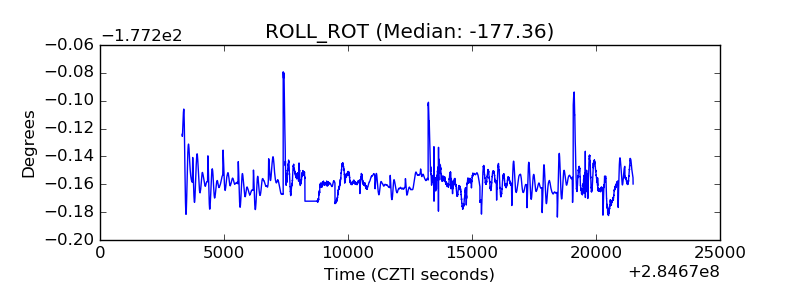 |
| _Roll_DEC | 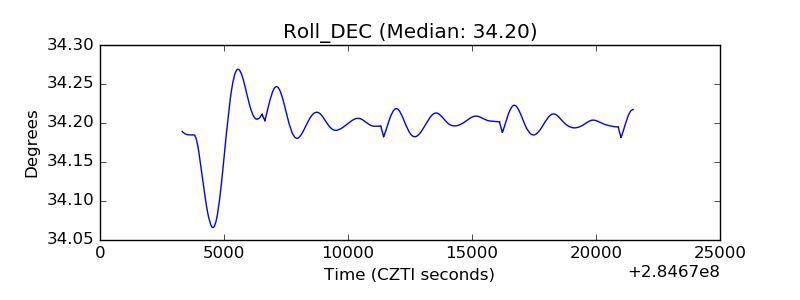 |
| _Roll_RA | 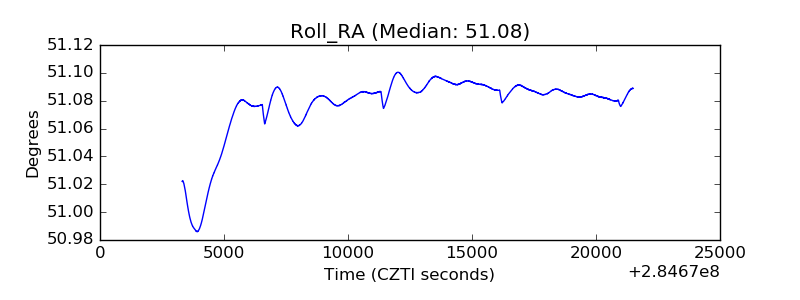 |
| Veto Counter |  |